
Autore
Jonathan Hobbs, CFA
Data
02 Jun 2026
Categoria
Investor update
IncomeShares Monthly Investor Update – May 2026
Il tuo capitale è a rischio se investi. Potresti perdere l’intero investimento. Consulta l’avviso completo sui rischi qui.
IncomeShares ended May with $183.8 million in AUM, $206.8 million in cumulative fund flows, and $65.5 million in trading turnover. As with April, all three metrics closed the month at new all-time highs. Our ETPs linked to digital asset stocks, semiconductors, and AI infrastructure names produced relatively higher distribution yields for the month.
This update breaks down the numbers.
Assets under management (AUM)
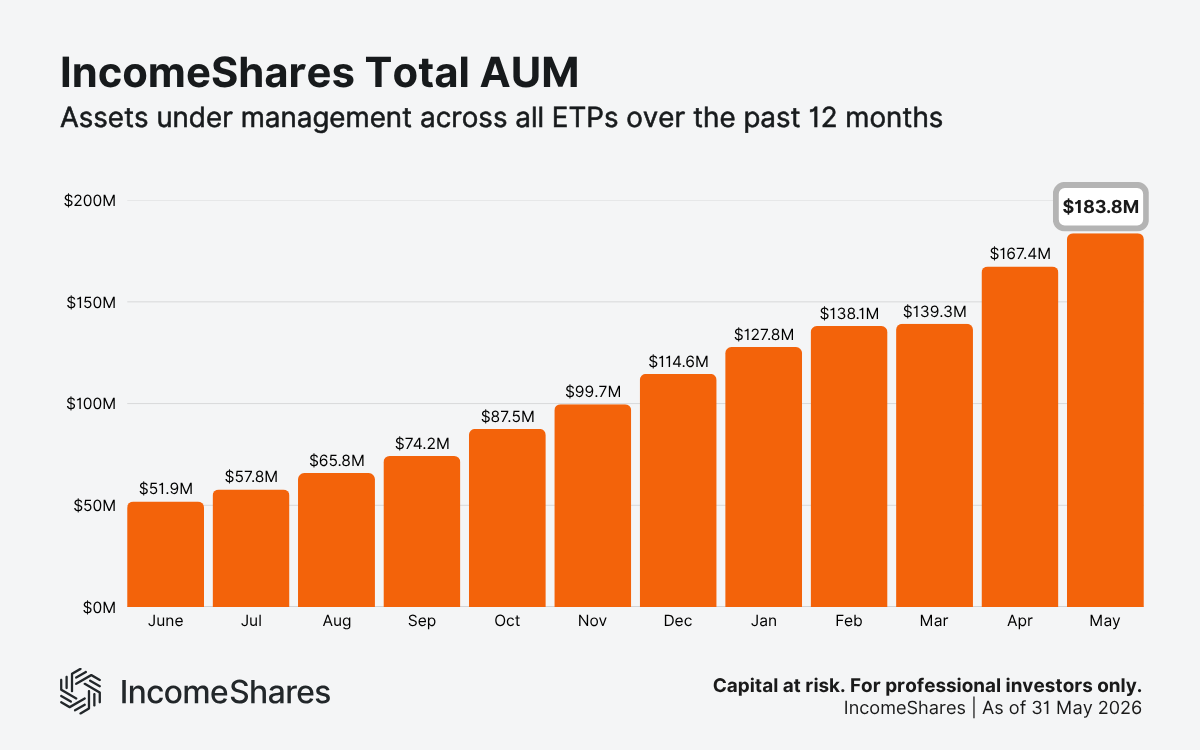
Total AUM closed May at $183.8 million – up from $167.4 million at the end of April.
The standout was Gold+ Yield, which crossed the $40 million milestone for the first time. Our largest product ended May with $40.2 million in AUM and accounts for almost 22% of the total.
Our Magnificent 7 Basket ETP takes second place at $17.9 million. Nasdaq 100, Silver+ Yield, and Tesla follow at $17.0, $12.0, and $11.3 million, respectively. The top five together hold around 53% of total AUM, down from 57% in April. The 35 ETPs we launched across March and April are now contributing to total AUM.
Cumulative fund flows
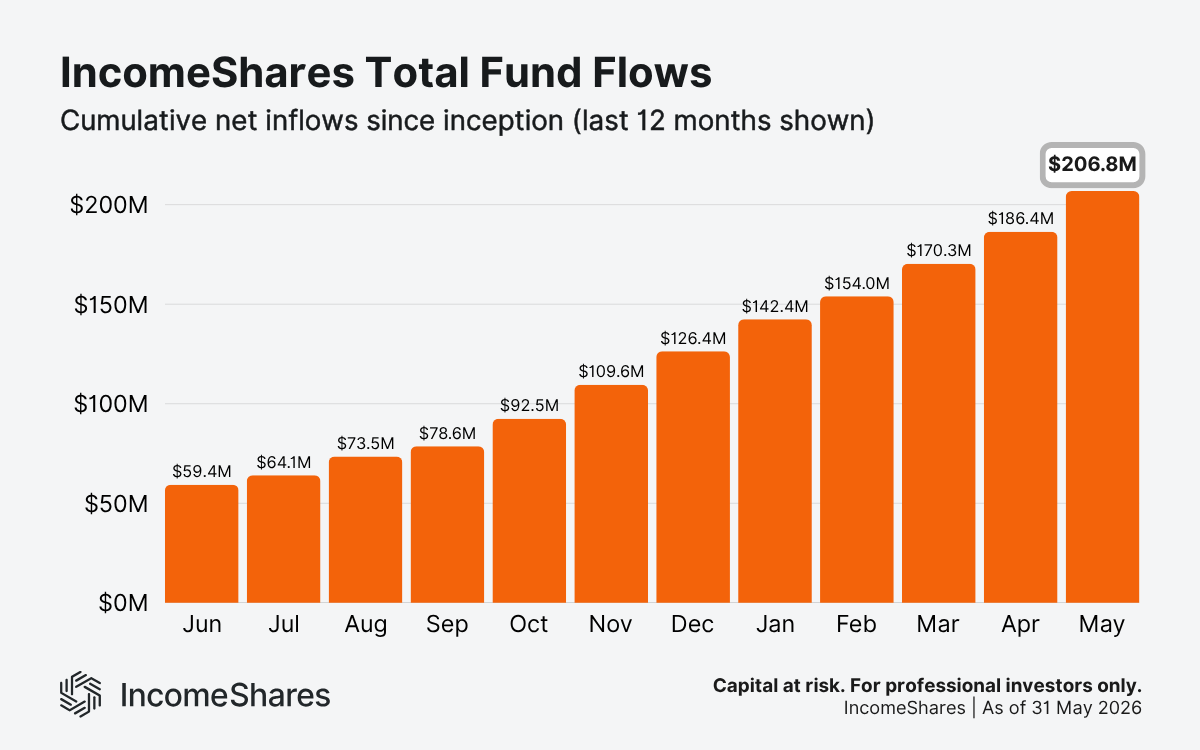
Cumulative fund flows hit $206.8 million by 31 May, crossing $200 million for the first time. Inflows of around $20.4 million in May make this our biggest monthly intake on record. This metric tracks net money invested into IncomeShares ETPs since inception. Positive flows suggest growing demand.
Gold+ Yield led again, attracting $3.0 million during the month. MicroStrategy and Magnificent 7 followed, with $2.0 and $1.8 million, respectively. AMD had a small $0.3 million net outflow during May.
Cumulative flows continue to run above total AUM, as you'd expect for products paying monthly income. Distribution payments reduce assets under management.
Trading turnover
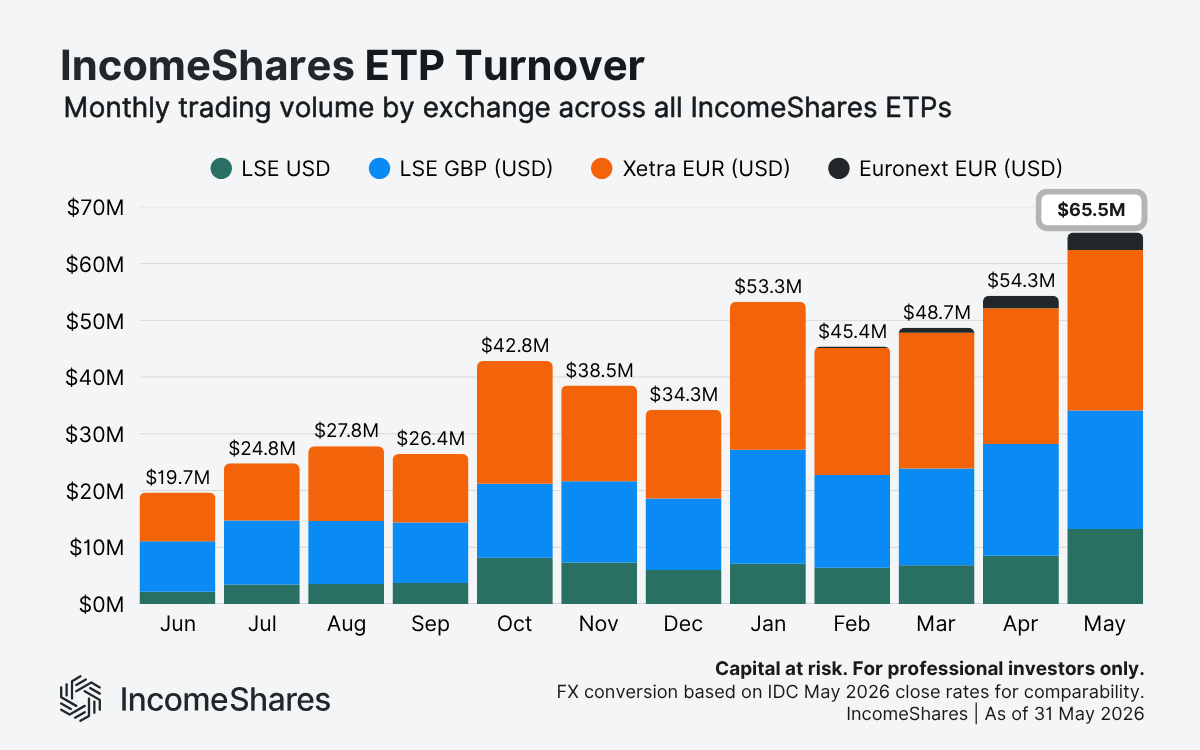
May was our busiest trading month yet, with $65.5 million in turnover across exchanges. That's a 21% jump from April's $54.3 million, and the fifth month running above $40 million.
All four listing venues contributed to the rise. LSE and Xetra are still the two main hubs. Euronext Amsterdam is now at $2.6 million – growing gradually since IncomeShares ETPs started trading there in November 2025.
Note: Figures use IDC FX rates as of the May month-end to convert GBP and EUR into USD for comparison.
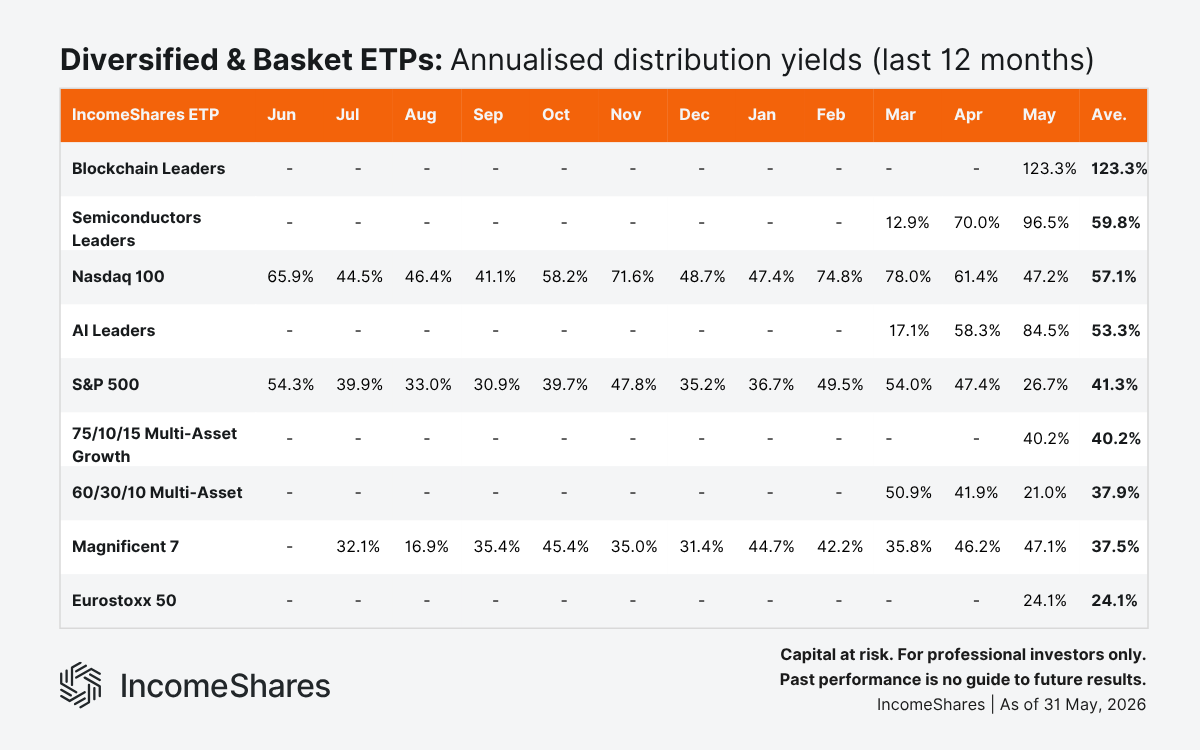
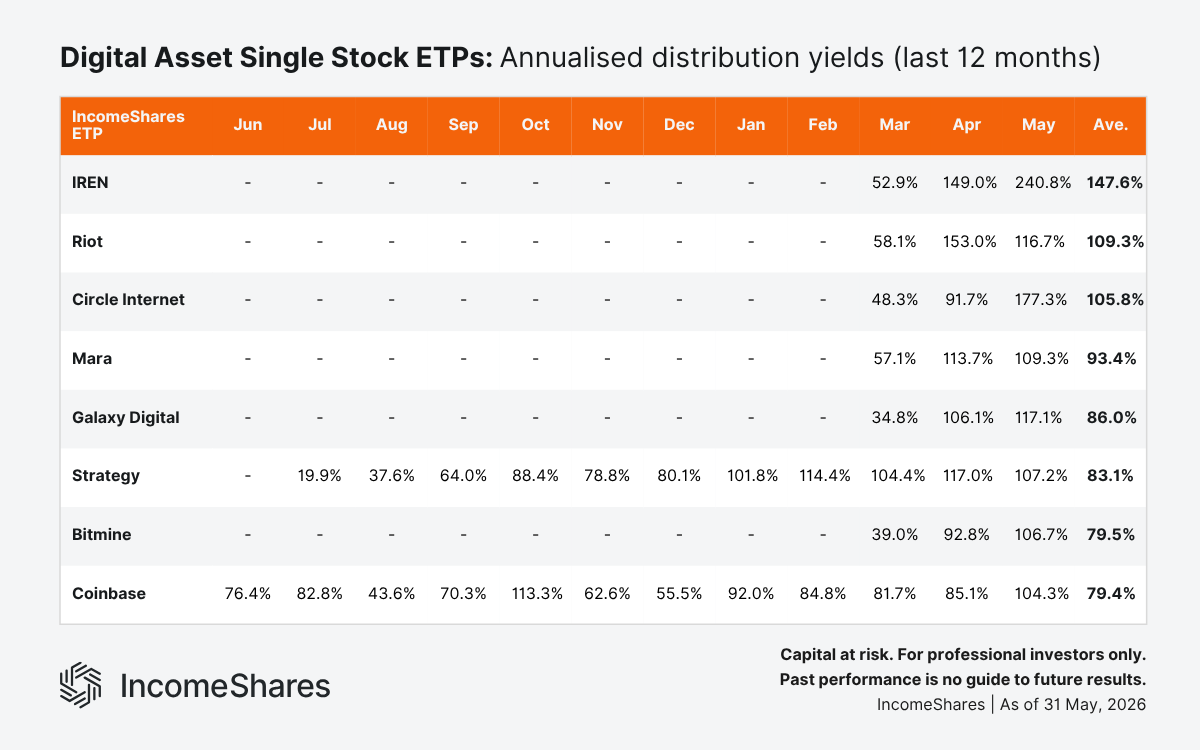
Distribution yields
Distribution yields represent the annualised income paid to investors as a percentage of an ETP's net asset value, based on the latest month's distribution. IncomeShares ETPs aim to generate this income from selling options. Yields change each month depending on strategy performance and market volatility.
May annualised distribution yields ranked from highest to lowest:
IREN Options ETP: 240.8%
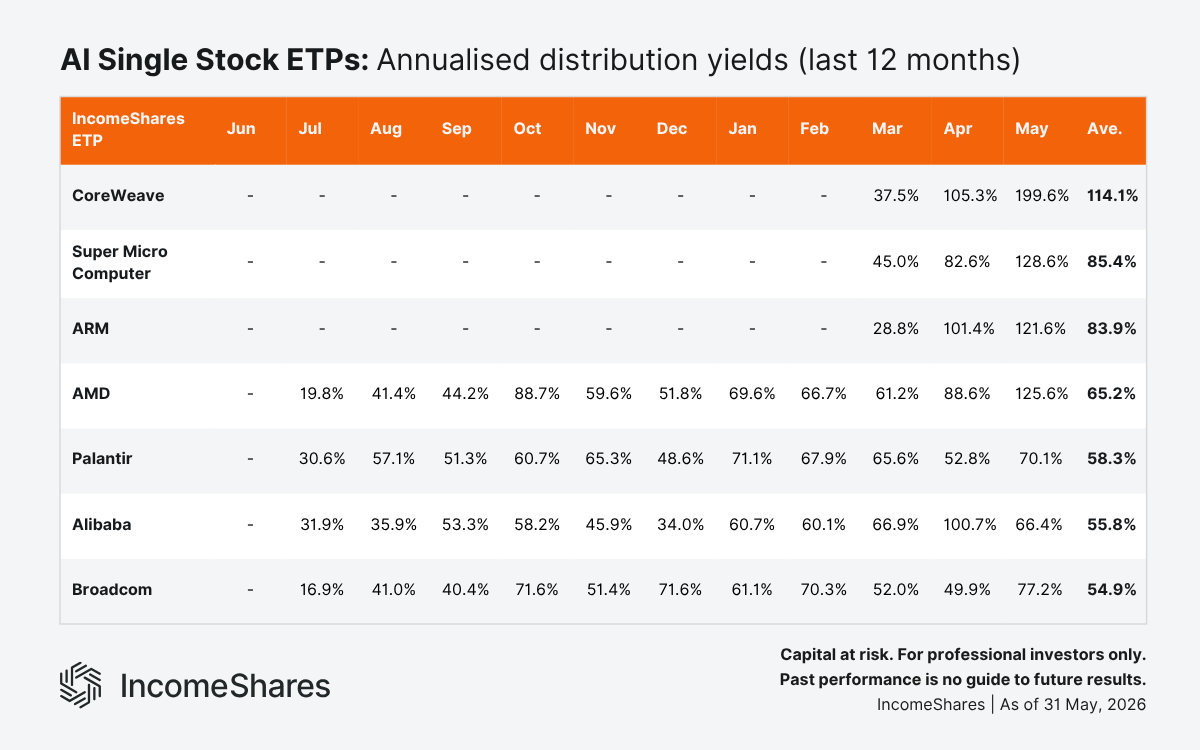
CoreWeave Options ETP: 199.6%
Circle Internet Options ETP: 177.3%
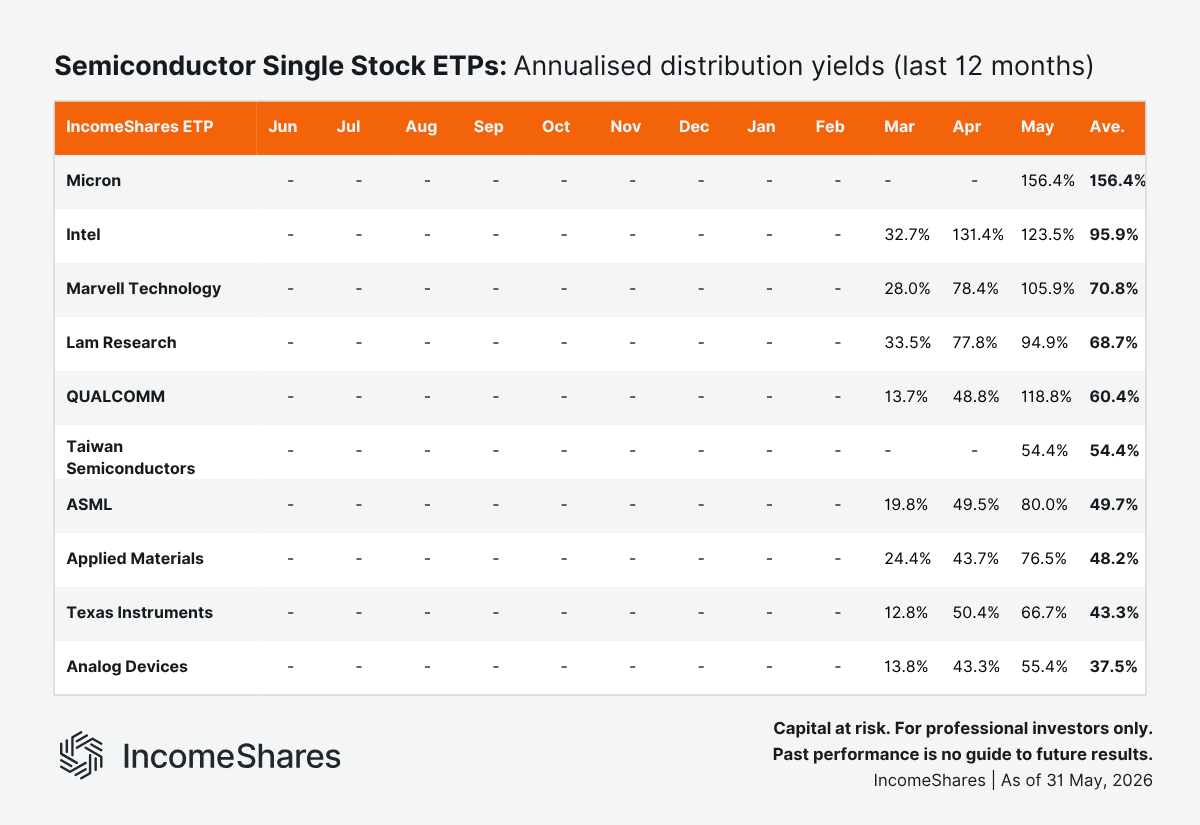
Micron Options ETP: 156.4%
Super Micro Computer Options ETP: 128.6%
AMD Options ETP: 125.6%
Intel Options ETP: 123.5%
Blockchain Leaders Options ETP: 123.3%
ARM Options ETP: 121.6%
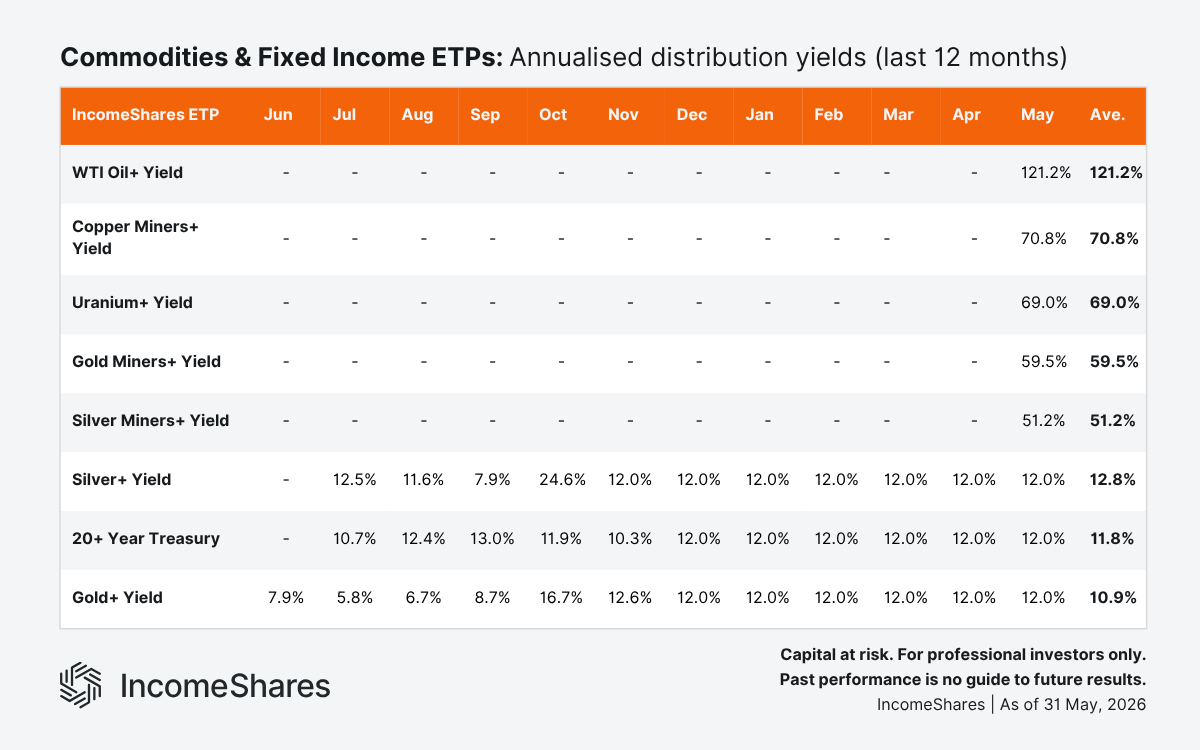
WTI Oil+ Yield ETP: 121.2%
QUALCOMM Options ETP: 118.8%
Galaxy Digital Options ETP: 117.1%
Riot Options ETP: 116.7%
Mara Options ETP: 109.3%
Strategy Options ETP: 107.2%
Bitmine Options ETP: 106.7%
Marvell Technology Options ETP: 105.9%
Coinbase Options ETP: 104.3%
Semiconductors Leaders Options ETP: 96.5%
Lam Research Options ETP: 94.9%
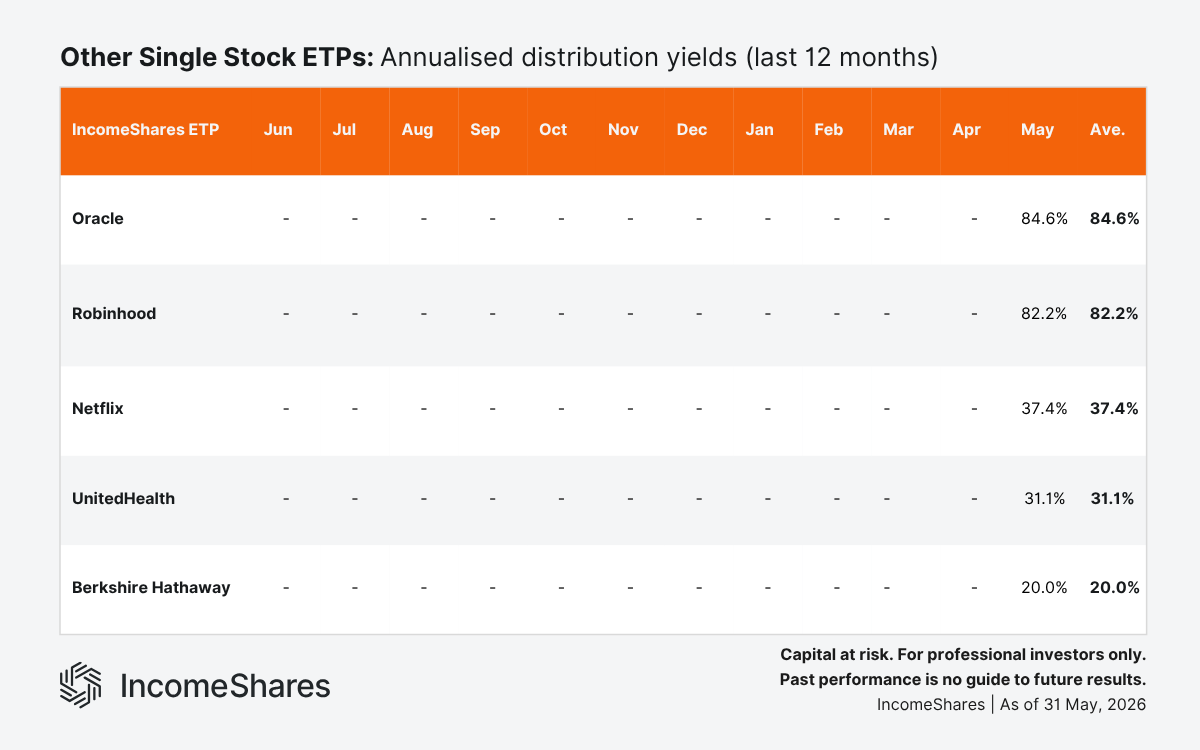
Oracle Options ETP: 84.6%
AI Leaders Options ETP: 84.5%
Robinhood Options ETP: 82.2%
ASML Options ETP: 80.0%
Applied Materials Options ETP: 76.5%
Broadcom Options ETP: 77.2%
Copper Miners+ Yield ETP: 70.8%
Palantir Options ETP: 70.1%
Uranium+ Yield ETP: 69.0%
Texas Instruments Options ETP: 66.7%
Alibaba Options ETP: 66.4%
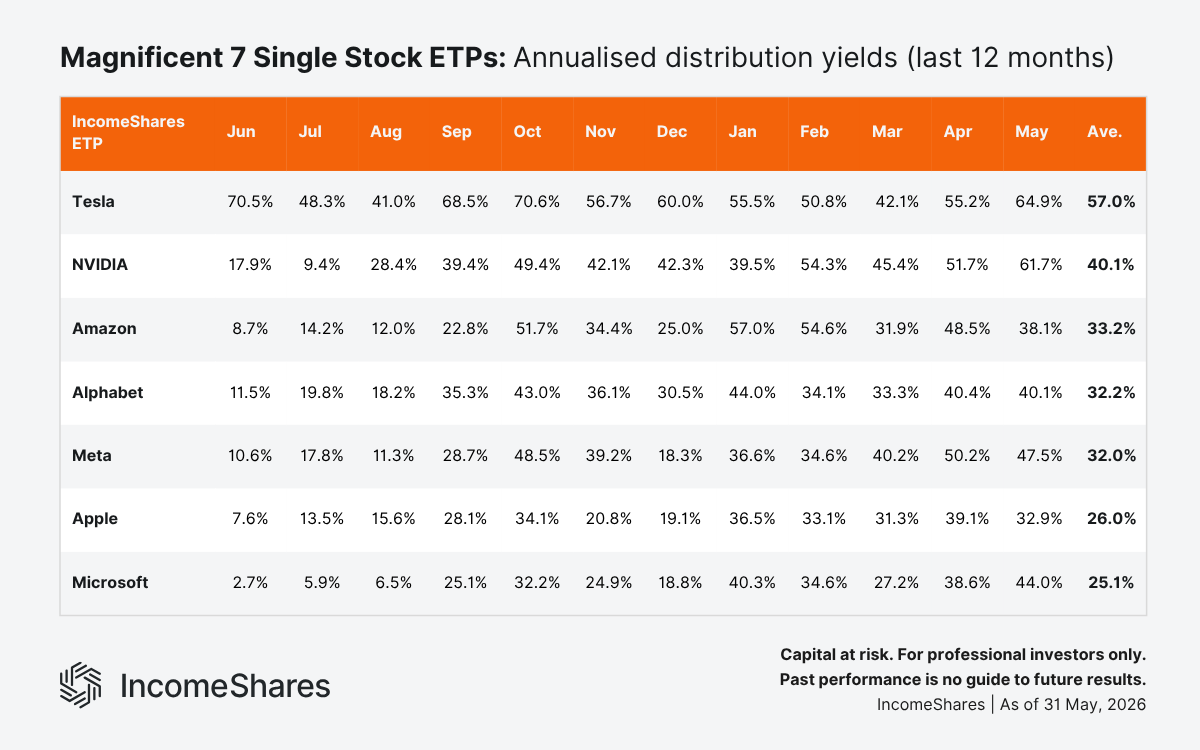
Tesla Options ETP: 64.9%
NVIDIA Options ETP: 61.7%
Gold Miners+ Yield ETP: 59.5%
Analog Devices Options ETP: 55.4%
Taiwan Semiconductors Options ETP: 54.4%
Silver Miners+ Yield ETP: 51.2%
Meta Options ETP: 47.5%
Nasdaq 100 Options ETP: 47.2%
Magnificent 7 Options ETP: 47.1%
Microsoft Options ETP: 44.0%
75/10/15 Multi-Asset Growth ETP: 40.2%
Alphabet Options ETP: 40.1%
Amazon Options ETP: 38.1%
Netflix Options ETP: 37.4%
Apple Options ETP: 32.9%
UnitedHealth Options ETP: 31.1%
S&P 500 Options ETP: 26.7%
Eurostoxx 50 Options ETP: 24.1%
60/30/10 Multi-Asset Options ETP: 21.0%
Berkshire Hathaway Options ETP: 20.0%
Silver+ Yield ETP: 12.0%
20+ Year Treasury Options ETP: 12.0%
Gold+ Yield ETP: 12.0%
The highest yields in May came from ETPs linked to three themes: digital asset stocks, semiconductors, and AI infrastructure. Each had heightened volatility during the month. Higher volatility can lead to higher option premiums, which may feed through to higher distributions.
Our IREN ETP took the top spot at 240.8%, followed by CoreWeave at 199.6%, and Circle Internet at 177.3%. Micron came in at 156.4% in its first full month of distributions.
The five commodity-linked ETPs we launched in April also produced high yields in May. WTI Oil+ Yield led the group at 121.2%. Copper Miners+ Yield, Uranium+ Yield, Gold Miners+ Yield, and Silver Miners+ Yield all came in above 50%.
With 54 ETPs now in the range, the tables below show annualised distribution yields over the past 12 months, grouped by theme. Not all ETPs have a full 12 months of data – each table shows yields from the month the product launched.
Key takeaways
AUM, cumulative fund flows, and trading turnover all closed at new all-time highs. Gold+ Yield crossed the $40 million AUM mark for the first time.
Trading turnover jumped 21% in May to $65.5 million, with all four exchanges contributing to the rise.
Our IREN, CoreWeave, and Circle Internet ETPs posted the highest distribution yields in May. Annualised yields across the range ranged from 12.0% to 240.8%, reflecting wide differences in underlying stock volatility.
Your capital is at risk if you invest. You could lose all your investment. Please see the full risk warning here.
Il tuo capitale è a rischio se investi. Potresti perdere l’intero investimento. Consulta l’avviso completo sui rischi qui.
Prodotti correlati:

Strategia
Put garantita da liquidità + Azioni
Rendimento da
cedole
39.43%

Strategia
Covered Call
Rendimento da
cedole
12.33%

Strategia
Basket of Income-generating ETPs
Rendimento da
cedole
36.59%

Strategia
Covered Call
Rendimento da
cedole
12.47%

Strategia
Strategia di reddito basata su opzioni
Rendimento da
cedole
28.98%

Strategia
Strategia di reddito basata su opzioni
Rendimento da
cedole
110.85%

Strategia
Strategia di reddito basata su opzioni
Rendimento da
cedole
90.98%

Strategia
Strategia di reddito basata su opzioni
Rendimento da
cedole
57.14%

Strategia
Basket di strategie di reddito su azioni blockchain leader
Rendimento da
cedole
113.52%

Strategia
Put garantita da liquidità + Azioni
Rendimento da
cedole
32.98%