
Auteur
Jonathan Hobbs, CFA
Date
30 Jan 2026
Catégorie
Education
How Earnings Seasons Affect Options Income ETPs
Votre capital est exposé à un risque si vous investissez. Vous pouvez perdre la totalité de votre investissement. Veuillez consulter l’avertissement complet sur les risques ici
Earnings season is when many public companies publish results within a short space of time. Stock prices can move more during these weeks because investors react to new information all at once. For options income ETPs, earnings season can affect two things: stock prices and income potential. Both affect total return.
How earnings results affect stock prices
Earnings results often compress investor uncertainty into one event. Before earnings, share prices reflect investor expectations of earnings. But after the announcement, they learn the actual results. When the two don’t match up, stock prices can adjust fast in either direction.
Take Tesla as an example. Tesla’s earnings releases have often led to large price moves (up and down). Investors focus on how many cars Tesla sold, how much profit it made per car, and what its management says about future production. They also watch long-term themes: AI spending, self-driving car progress, and updates on projects like robotaxis or energy storage.
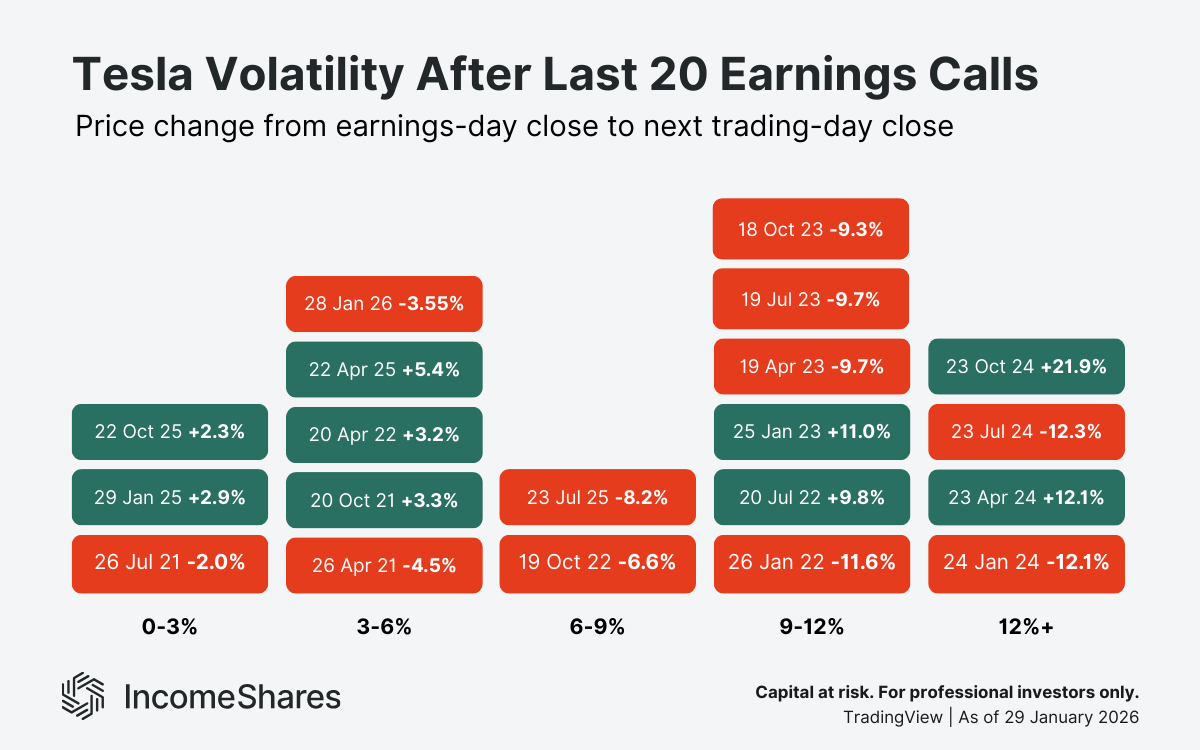
The chart below shows the volatility of Tesla’s stock price after its last 20 earnings calls. The figures for each block denote the percentage price move from the earnings-day close until the next trading-day close. Sometimes the price rose, sometimes it dropped. But more often than not, it was volatile. Six out of 20 times, the price moved between 9 and 12% in either direction. Four out of 20 times, it moved more than 12% over 24 hours.
During earnings season, this kind of price volatility tends to be more common across many stocks – not just Tesla.
How earnings affect option prices
Option prices react to expected future price movement, not to whether earnings are “good” or “bad”. That expectation shows up as implied volatility – the market’s estimate of how much a share price might move over a given period (in either direction), based on option prices.
Before earnings, investors might expect prices to move a lot, but they don’t know which way. That uncertainty can make options more expensive (i.e., have higher premiums). Call option premiums could get more expensive if investors think prices will rise post-earnings. Put option premiums could rise if investors want to take bearish bets or hedge against downside scenarios.
That pattern explains why selling options around earnings may generate higher income, while also carrying higher short-term risk.
What this means for options income ETPs
Options income ETPs aim to generate income by selling options on underlying assets, like stocks or ETFs. They might also hold positions in those underlying stocks. That means earnings can affect total returns in two ways:
The value of the ETP’s stock holdings.
The value of its option positions and payouts.
That could change both the ETP’s net asset value and income potential, which together make up total return.
Earnings season volatility can also increase assignment risk for options ETPs. If the stock trades past the strike price, the ETP (option seller) must fulfil its obligation to buy or sell shares. See our Assignment Risk Explained guide to learn how this works for call and put options.
IncomeShares currently offers options ETPs on stocks, indices, commodities, and fixed income. They hold exposure to the underlying investments and sell call or put options with the aim of generating monthly income.
Key takeaways
Earnings seasons often lead to larger short-term stock price moves.
Higher uncertainty ahead of earnings can increase option premiums.
Options income ETPs may generate higher income during these periods.
But bigger price moves can also increase short-term NAV variability.
Votre capital est exposé à un risque si vous investissez. Vous pouvez perdre la totalité de votre investissement. Veuillez consulter l’avertissement complet sur les risques ici
Produits associé:

Stratégie
Option de vente couverte par liquidités (cash) + actions
Rendement des
distributions
63.28%

Stratégie
Option de vente couverte par liquidités (cash) + actions
Rendement des
distributions
42.43%

Stratégie
Option de vente couverte par liquidités + actions
Rendement des
distributions
22.63%

Stratégie
Option de vente couverte par liquidités + actions
Rendement des
distributions
42.75%

Stratégie
Option de vente couverte par liquidités + actions
Rendement des
distributions
41.56%

Stratégie
Option de vente couverte par liquidités + actions
Rendement des
distributions
42.74%

Stratégie
Basket of Income-generating ETPs
Rendement des
distributions
39.99%

Stratégie
Option de vente couverte par liquidités + actions
Rendement des
distributions
73.16%

Stratégie
Option de vente couverte par liquidités + actions
Rendement des
distributions
101.03%

Stratégie
Option de vente couverte par liquidités + actions
Rendement des
distributions
69.01%