
Autor
Jonathan Hobbs, CFA
Fecha
07 Jan 2026
Categoría
Market Insights
IncomeShares Monthly Investor Update – December 2025
Su capital está en riesgo si invierte. Podría perder toda su inversión. Por favor, consulte la advertencia de riesgos completa aquí.
2025 was the first full calendar year for the IncomeShares exchange-traded product range. It was also the year IncomeShares moved from early-stage growth into something more established.
Assets, fund flows, trading activity, income, and total returns all built steadily through the year.
Below is a full-year snapshot.
Assets under management (AUM)
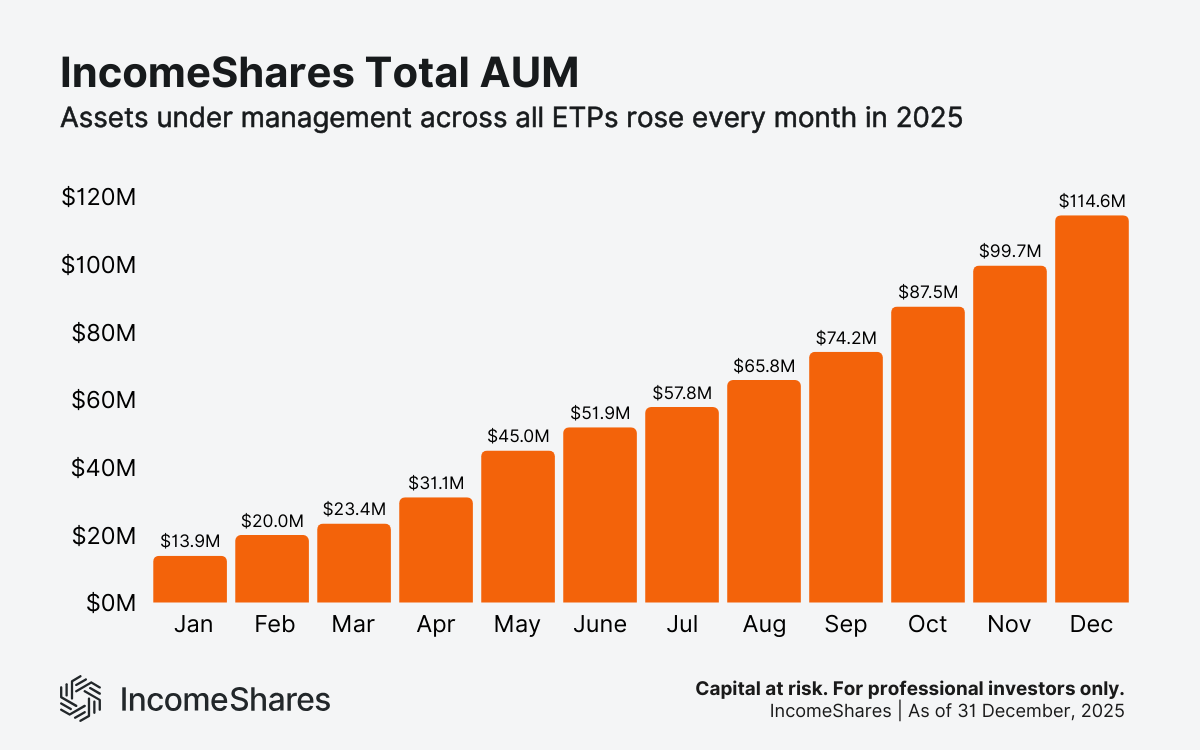
Assets under management increased every month in 2025. The range started in January at $13.9m and finished December at $114.6m. Growth was gradual and sustained rather than driven by a single product launch or short-term spike in demand.
Cumulative fund flows
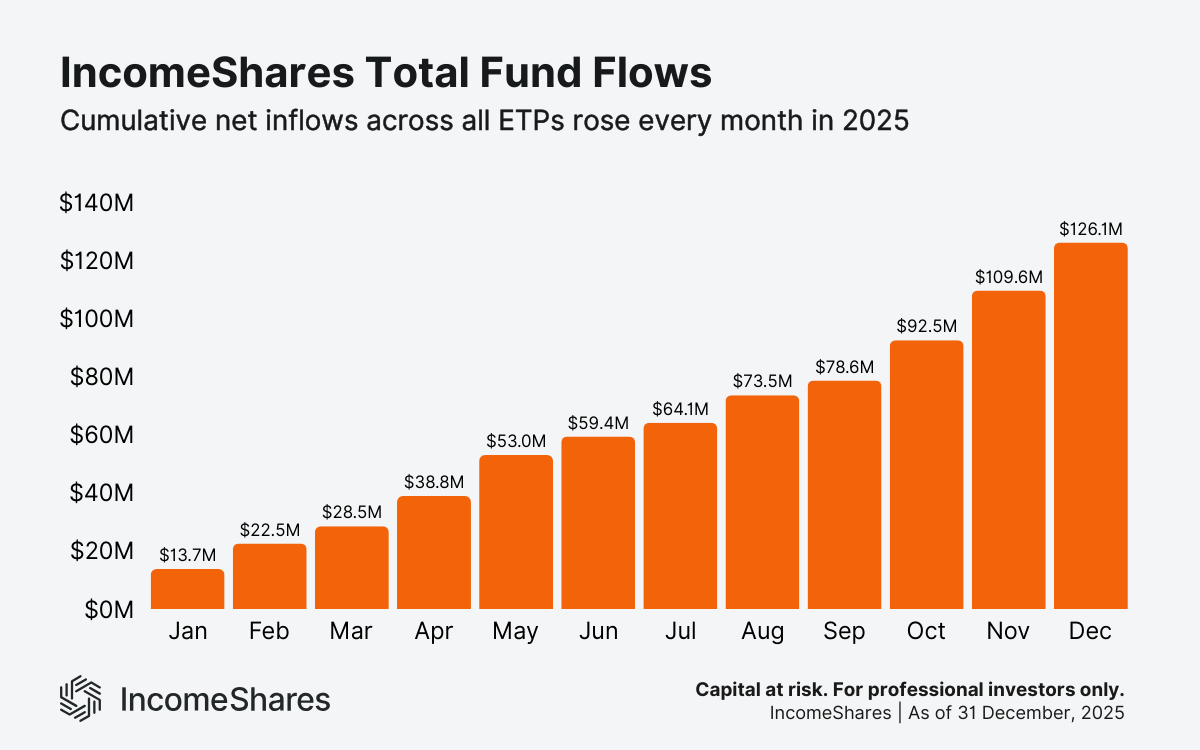
Net inflows show the total amount of capital added to IncomeShares ETPs, after redemptions. As with AUM, the total rose every month. Cumulative net inflows reached $126.1m for the year – a sign of rising demand for IncomeShares ETPs.
These flows exceeded year-end AUM. Asset growth in 2025 came mostly from fresh capital, with income paid out during the year.
Trading turnover
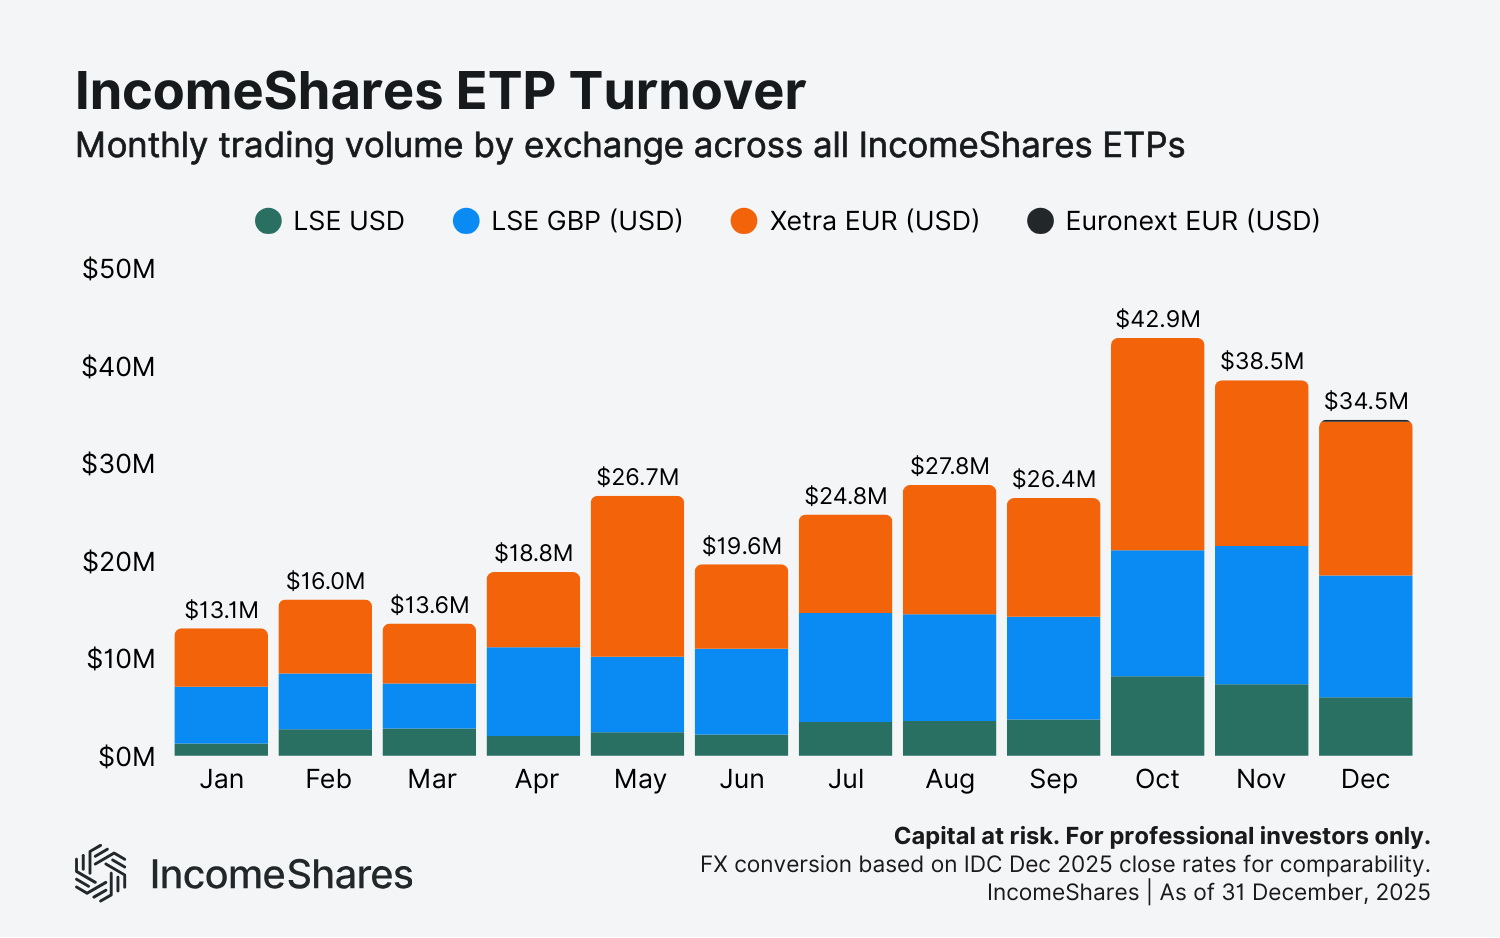
Trading activity dropped in December to $34.5m, but is still up significantly for the year. Summing up totals for the year, London Stock Exchange accounted for $159.6m and Xetra $142.7m.
Note: Figures use IDC FX rates as of the December month-end to convert GBP and EUR into USD for comparison.
Distribution yields
Distribution yields represent the annualised income paid to investors as a percentage of an ETP’s net asset value, based on the latest month’s yield. IncomeShares ETPs aim to generate this income from selling options. Yields change each month depending on strategy performance and market volatility.
December annualised distribution yields ranked from highest to lowest:
MicroStrategy Options ETP: 80.1%
Broadcom Options ETP: 71.6%
Tesla Options ETP: 60.0%
Coinbase Options ETP: 55.5%
AMD Options ETP: 51.8%
Nasdaq 100 Options ETP: 48.7%
Palantir Options ETP: 48.6%
NVIDIA Options ETP: 42.3%
S&P 500 Options ETP: 35.2%
Alibaba Options ETP: 34.0%
Magnificent 7 Options ETP: 31.4%
Alphabet Options ETP: 30.5%
Amazon Options ETP: 25.0%
Apple Options ETP: 19.1%
Microsoft Options ETP: 18.8%
Meta Options ETP: 18.3%
Silver+ Yield ETP: 12.0%
20+ Year Treasury Options ETP: 12.0%
Gold+ Yield ETP: 12.0%
The table below shows the distribution yields for each month of the year:
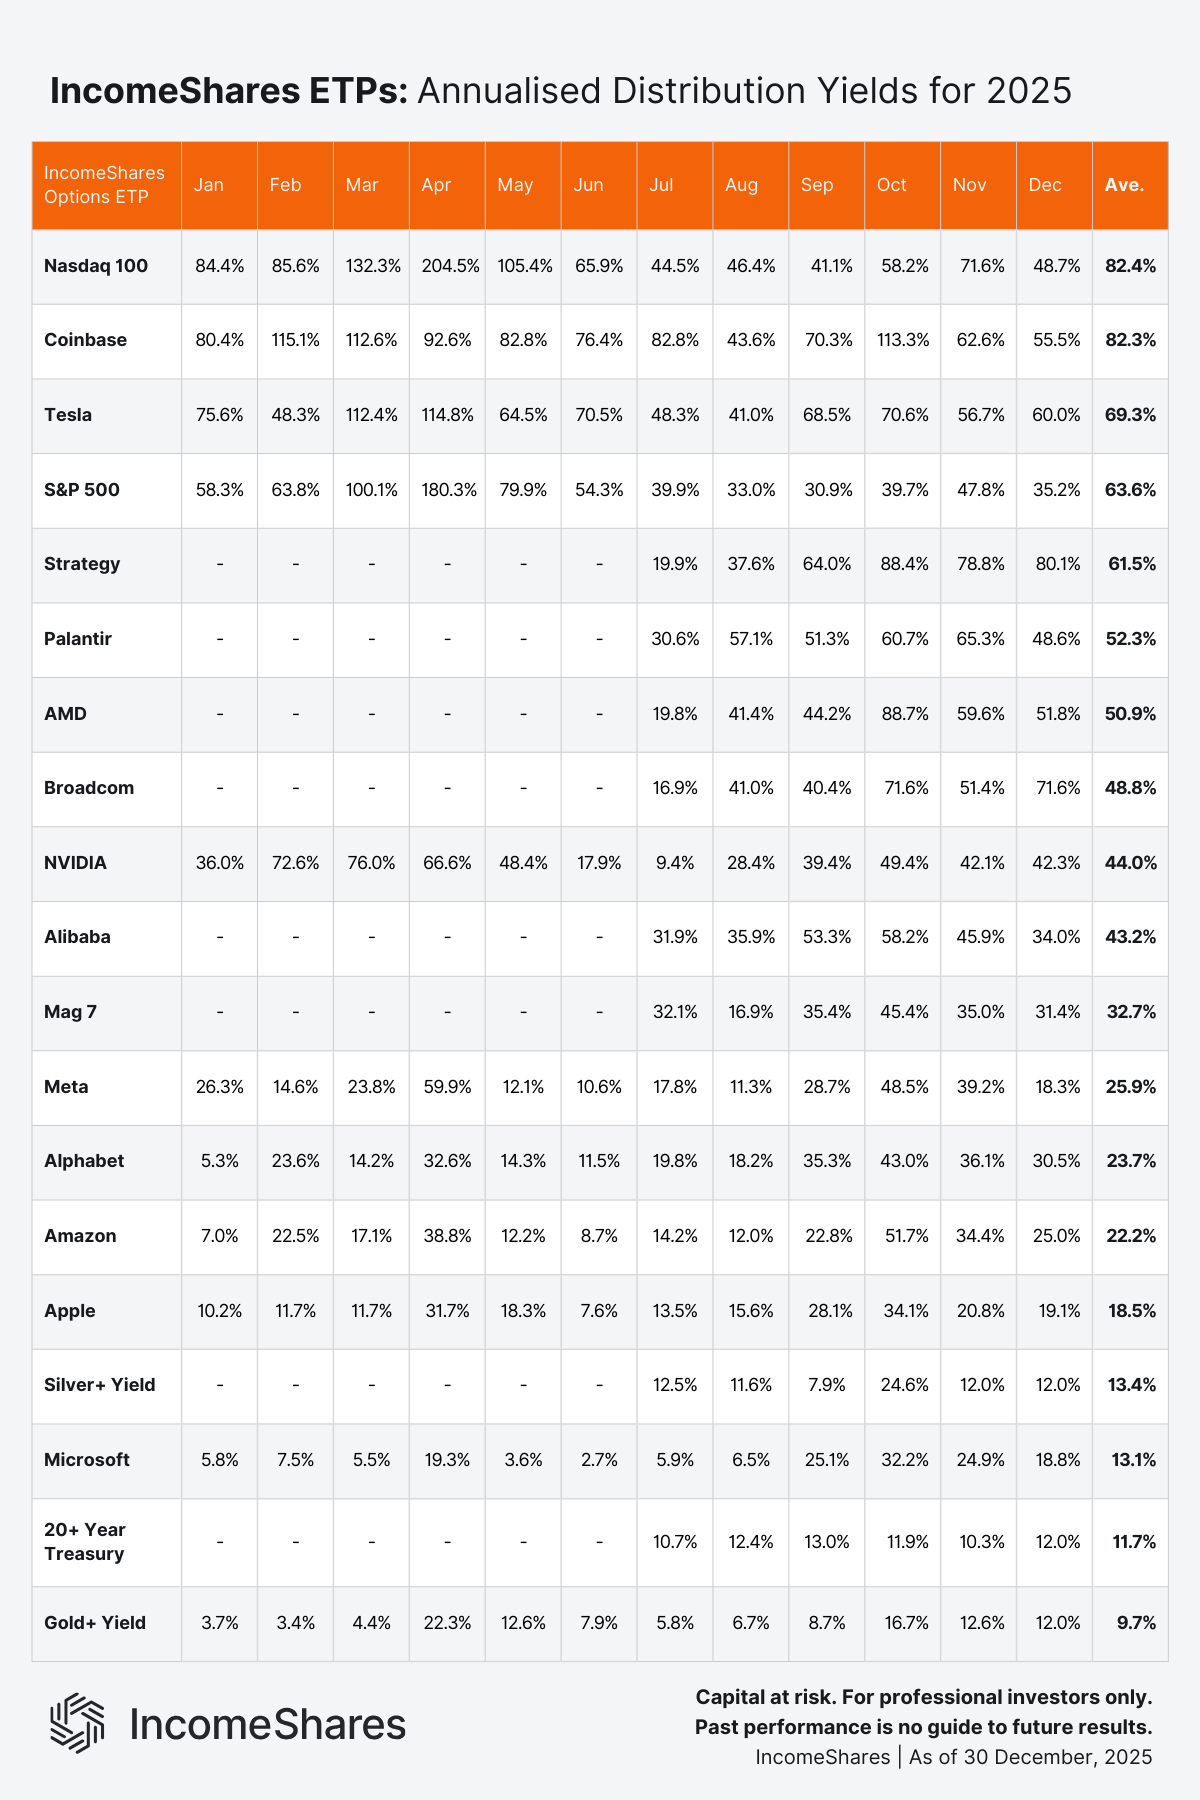
2025 saw persistently high income across the IncomeShares ETP range, with yields varying by product and volatility.
The Nasdaq 100 and S&P 500 Options ETPs, which sell shorter-dated put options, generated average annualised yields of 82.4% and 63.6%, respectively. For single-stock ETPs, Coinbase, Tesla, and MicroStrategy all delivered average annualised yields above 60%.
Lower-volatility strategies such as Gold+ Yield, Silver+ Yield, and the 20+ Year Treasury Options ETP produced lower, more stable yields over the year.
Total returns – 2025
The next chart shows total returns for IncomeShares ETPs in 2025, ranked from highest to lowest. These figures assume all income was reinvested back into the ETPs.
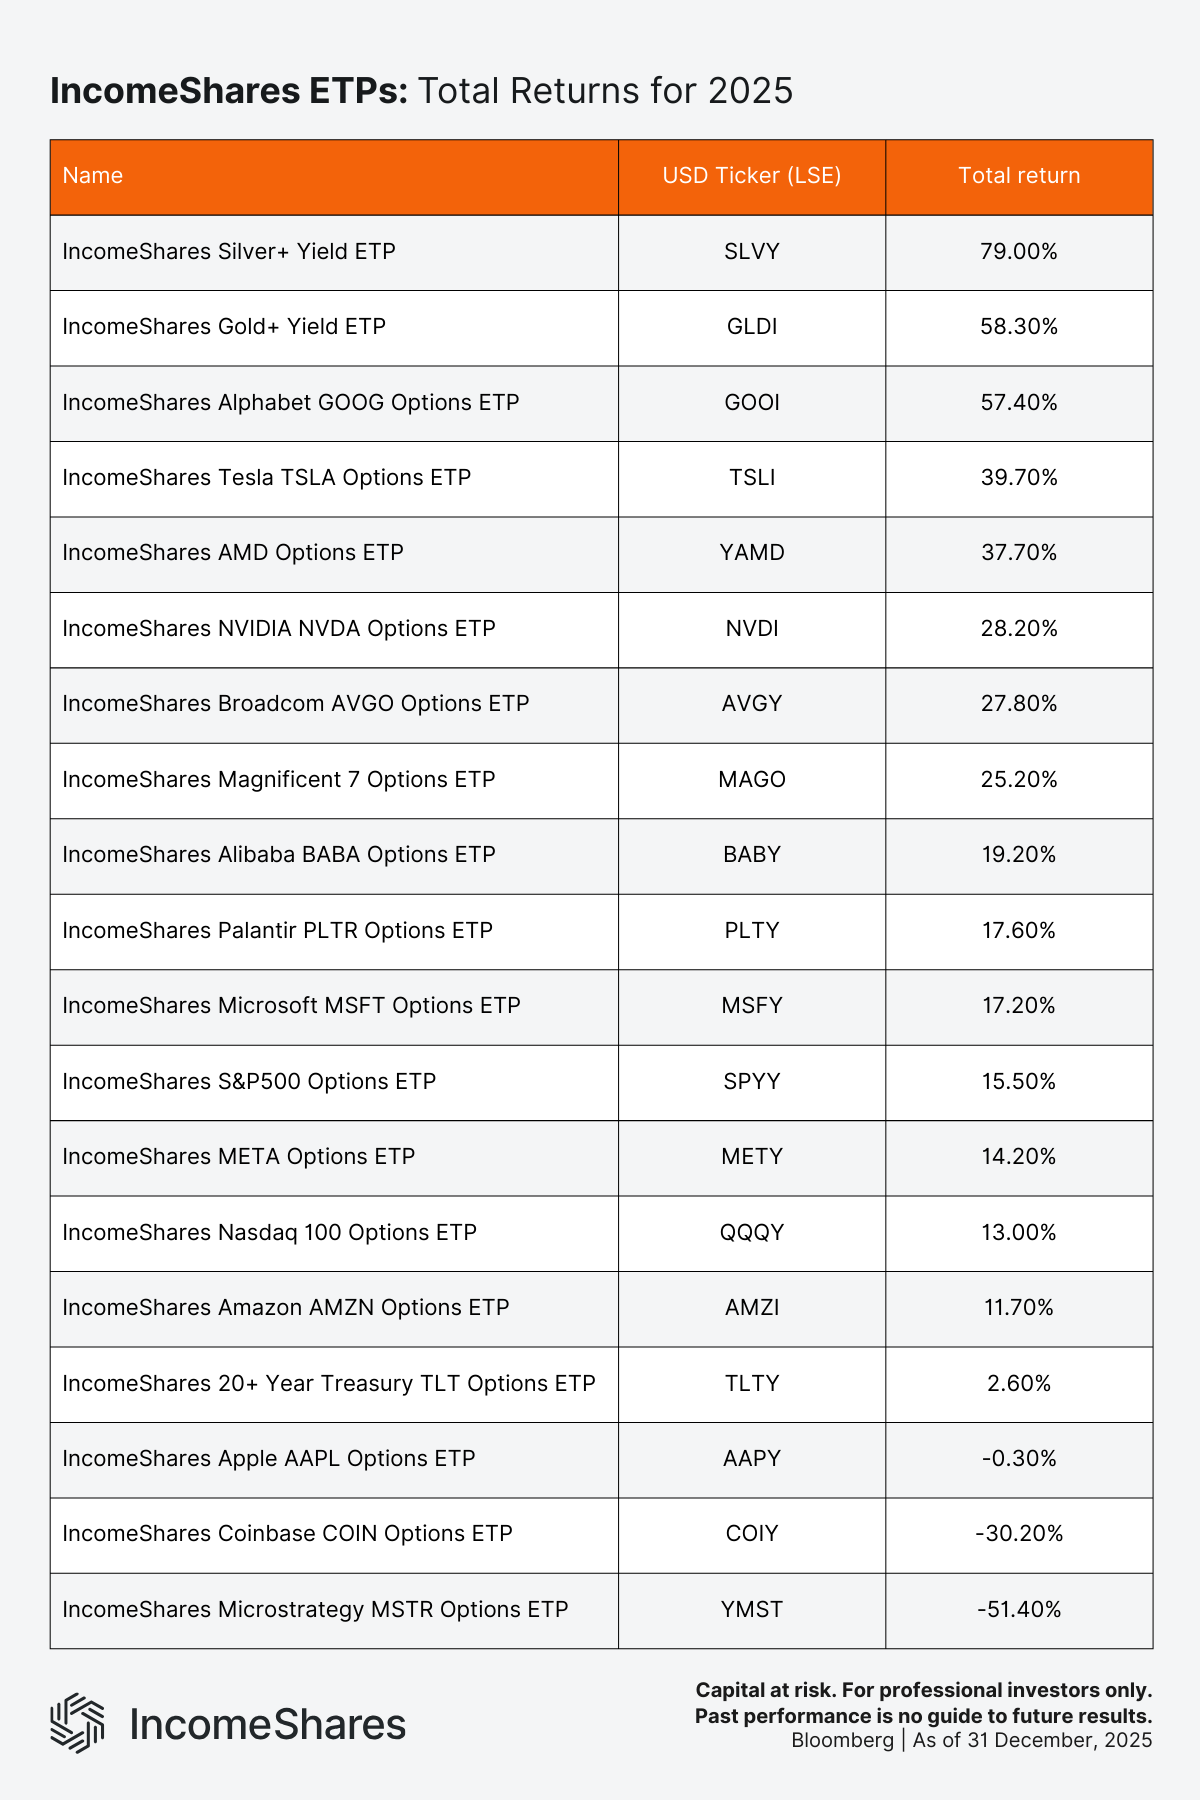
Several patterns are worth highlighting.
Silver+ Yield was the strongest performer, returning just under 80% since launch. Silver prices had a strong year, and the strategy captured a large portion of that move while generating income through selling call options on the underlying asset.
Gold+ Yield also delivered a strong total return of around 58%, again reflecting a rising underlying market combined with option income.
Among single-stock strategies, Tesla and Alphabet stood out, returning roughly 40% and 57% respectively. These results reflect both strong underlying share performance and the August transition from covered calls to a cash-secured put plus equity strategy, which improved upside participation in trending markets.
At the other end of the range, our Coinbase and MicroStrategy ETPs posted negative total returns for the year, despite generating high distribution yields. Both underlying stocks experienced large drawdowns and high volatility.
Note: several ETPs launched on 27 June 2025, so they don’t have a full 12 months of performance data. These include AMD, Broadcom, Palantir, Magnificent Seven, Alibaba, MicroStrategy, and Silver+ Yield, and the 20+ Year Treasury ETP.
Key takeaways
AUM: Assets rose from $13.9m to $114.6m in 2025, increasing every month.
Flows: Net inflows reached $126.1m, exceeding ending AUM even after income distributions were paid out.
Liquidity: Monthly turnover more than doubled over the year, peaking at $42.9m in October.
Income: High and persistent income was generated across the range, with yields driven by volatility and strategy design.
Returns: Most ETPs delivered positive total returns, shaped by underlying asset behaviour and the August shift to cash-secured put plus equity on single-stock products.
Su capital está en riesgo si invierte. Podría perder toda su inversión. Por favor, consulte la advertencia de riesgos completa aquí.
Productos Relacionados:

Estrategia
Put garantizado con efectivo + Acciones
Rendimiento de
Distribución
48.84%

Estrategia
Put garantizado con efectivo + Acciones
Rendimiento de
Distribución
55.60%

Estrategia
Put garantizado con efectivo + Acciones
Rendimiento de
Distribución
70.75%

Estrategia
Put garantizado con efectivo + Acciones
Rendimiento de
Distribución
39.42%

Estrategia
Covered Call
Rendimiento de
Distribución
11.94%

Estrategia
Basket of Income-generating ETPs
Rendimiento de
Distribución
38.29%

Estrategia
Covered Call
Rendimiento de
Distribución
11.90%

Estrategia
Put garantizado con efectivo + Acciones
Rendimiento de
Distribución
97.31%