
Auteur
Jonathan Hobbs, CFA
Date
17 Feb 2026
Catégorie
Market Insights
IncomeShares Monthly Investor Update – January 2026
Votre capital est exposé à un risque si vous investissez. Vous pouvez perdre la totalité de votre investissement. Veuillez consulter l’avertissement complet sur les risques ici
IncomeShares made new highs in assets under management, cumulative fund flows, and trading turnover in January. The MicroStrategy Options ETP had the highest distribution yield of our ETP range, and Silver+ Yield had the highest total return.
This update breaks down the numbers for the month.
Assets under management (AUM)
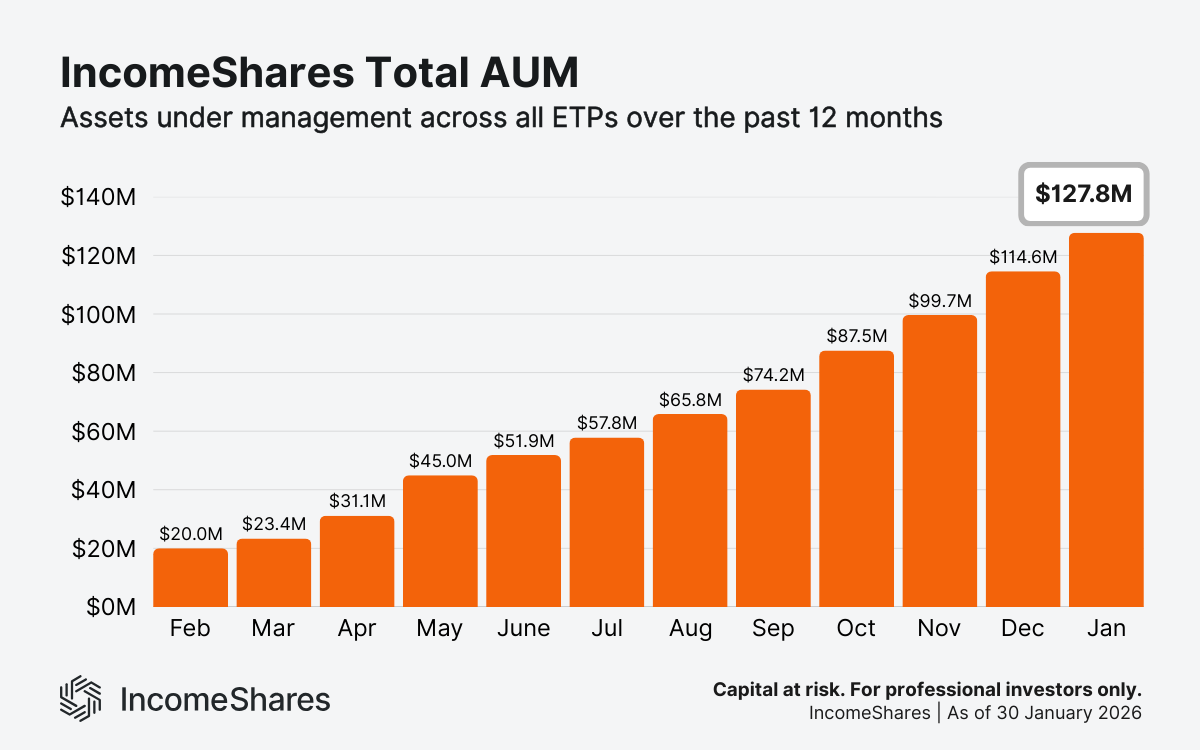
Total assets under management closed January at $127.8 million – increasing by about 11.5% from December. Total AUM has risen every month since July 2024, when we launched our first ETPs.
Gold+ Yield continues to be our largest product, with $31.24 million in AUM. Our Nasdaq 100, Magnificent 7 basket, Silver, and Tesla ETPs ended January with $12.97, $11.77, $10.05, and $9.95 million in AUM, respectively. Together with Gold+ Yield, these ETPs account for about 60% of our total AUM.
Cumulative fund flows
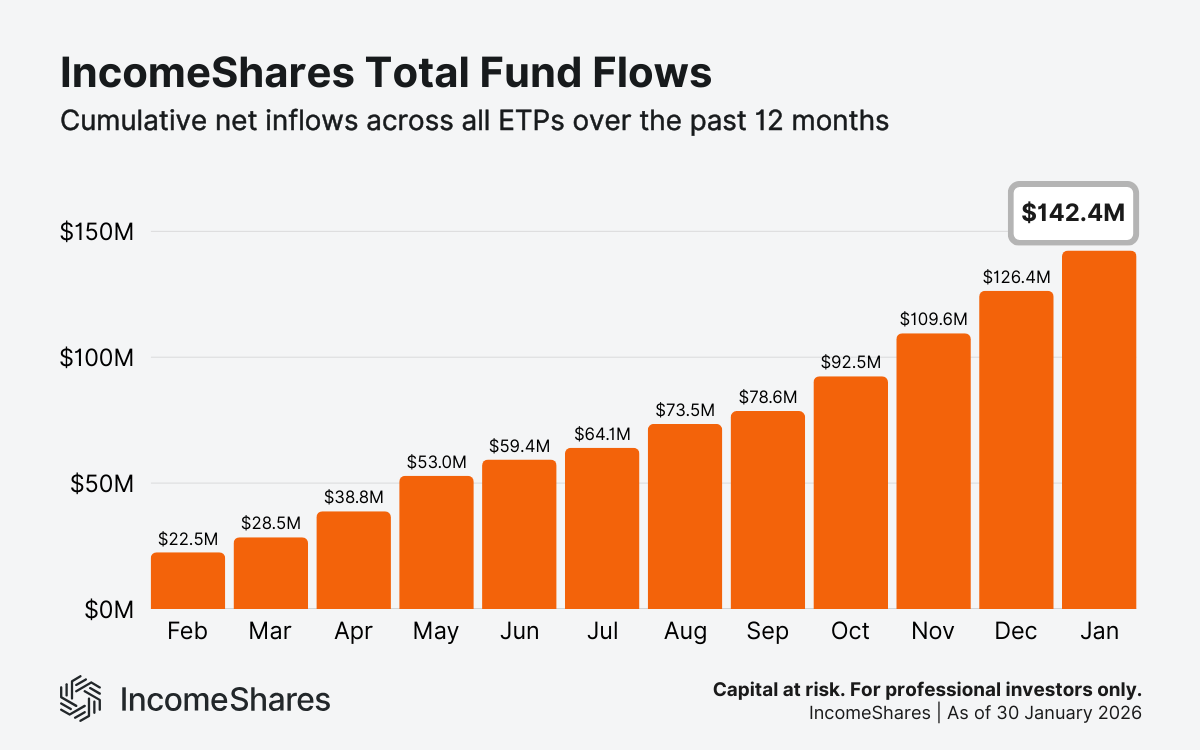
Cumulative fund flows reached $142.4 million by the end of January – a 12.7% increase from December. This metric tracks the net amount of money investors have added to IncomeShares exchange-traded products. Positive flows suggest a growing demand.
Our Gold+ Yield and Magnificent 7 ETPs saw the largest net inflows in January, adding $2.6 and $2.4 million, respectively.
Total fund flows have also risen every month since inception, and continue to exceed total AUM by a small margin. That’s expected for products that pay monthly income to investors, since distribution payments are subtracted from assets under management.
Trading turnover
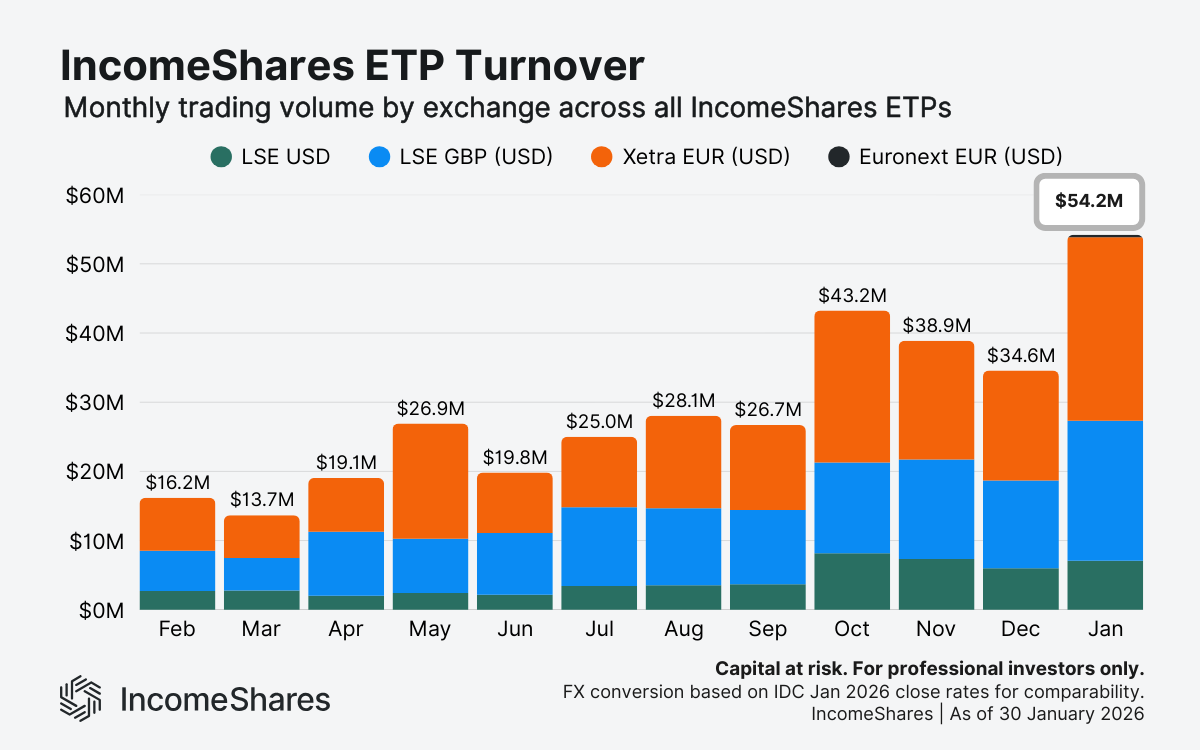
Total trading activity reached $54.2 million across exchanges for January – breaking the $50 million turnover mark for a single month.
Turnover was split fairly evenly between the London Stock Exchange ($27.3 million) and Xetra ($26.5 million). On the LSE, our GBP products accounted for $20.2 million turnover with USD products at $7.1 million.
Euronext Amsterdam turnover nearly doubled in January to $0.32 million. While this is a much smaller figure than other exchanges, IncomeShares ETPs only began trading on Euronext in November last year.
Note: Figures use IDC FX rates as of the January month-end to convert GBP and EUR into USD for comparison.
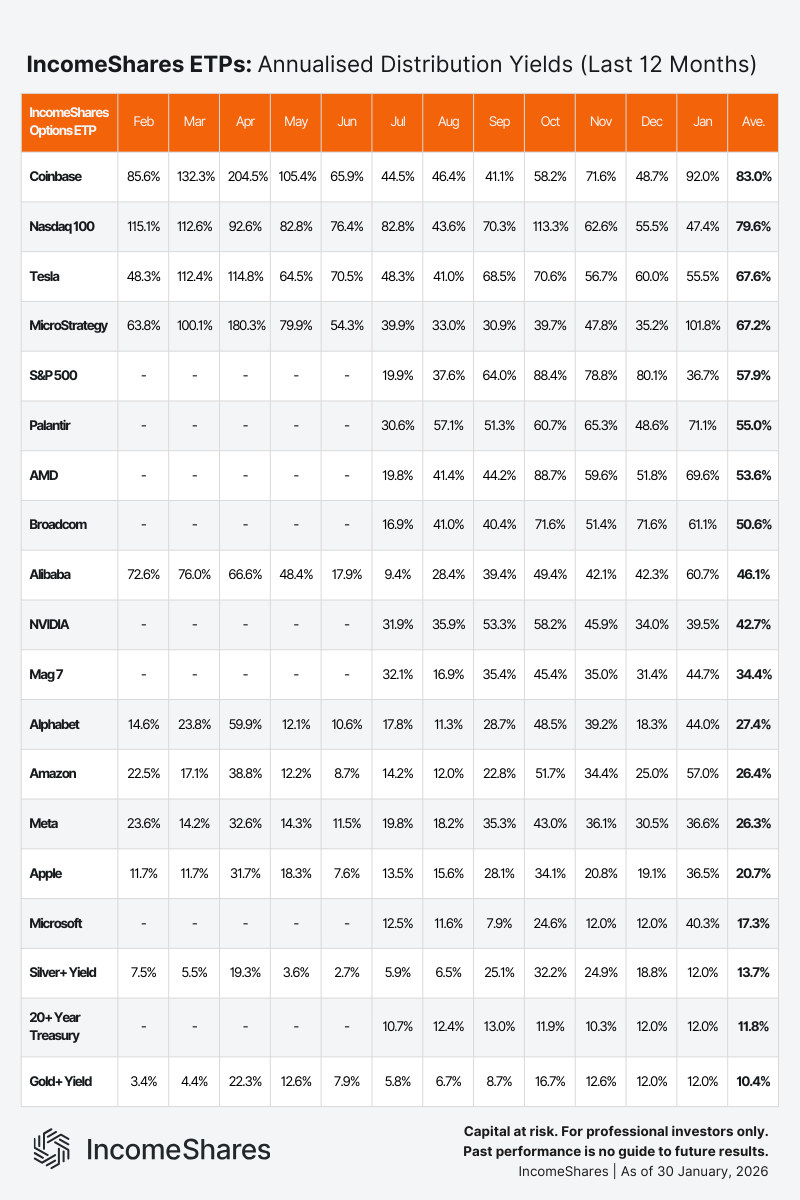
Distribution yields
Distribution yields represent the annualised income paid to investors as a percentage of an ETP’s net asset value, based on the latest month’s yield. IncomeShares ETPs aim to generate this income from selling options. Yields change each month depending on strategy performance and market volatility.
January annualised distribution yields ranked from highest to lowest:
MicroStrategy Options ETP: 101.8%
Coinbase Options ETP: 92.0%
Palantir Options ETP: 71.1%
AMD Options ETP: 69.6%
Broadcom Options ETP: 61.1%
Alibaba Options ETP: 60.7%
Amazon Options ETP: 57.0%
Tesla Options ETP: 55.5%
Nasdaq 100 Options ETP: 47.4%
Magnificent 7 Options ETP: 44.7%
Alphabet Options ETP: 44.0%
Microsoft Options ETP: 40.3%
NVIDIA Options ETP: 39.5%
S&P 500 Options ETP: 36.7%
META Options ETP: 36.6%
Apple Options ETP: 36.5%
20+ Year Treasury Options ETP: 12.0%
Silver+ Yield ETP: 12.0%
Gold+ Yield ETP: 12.0%
The table below shows the distribution yields over the past 12 months.
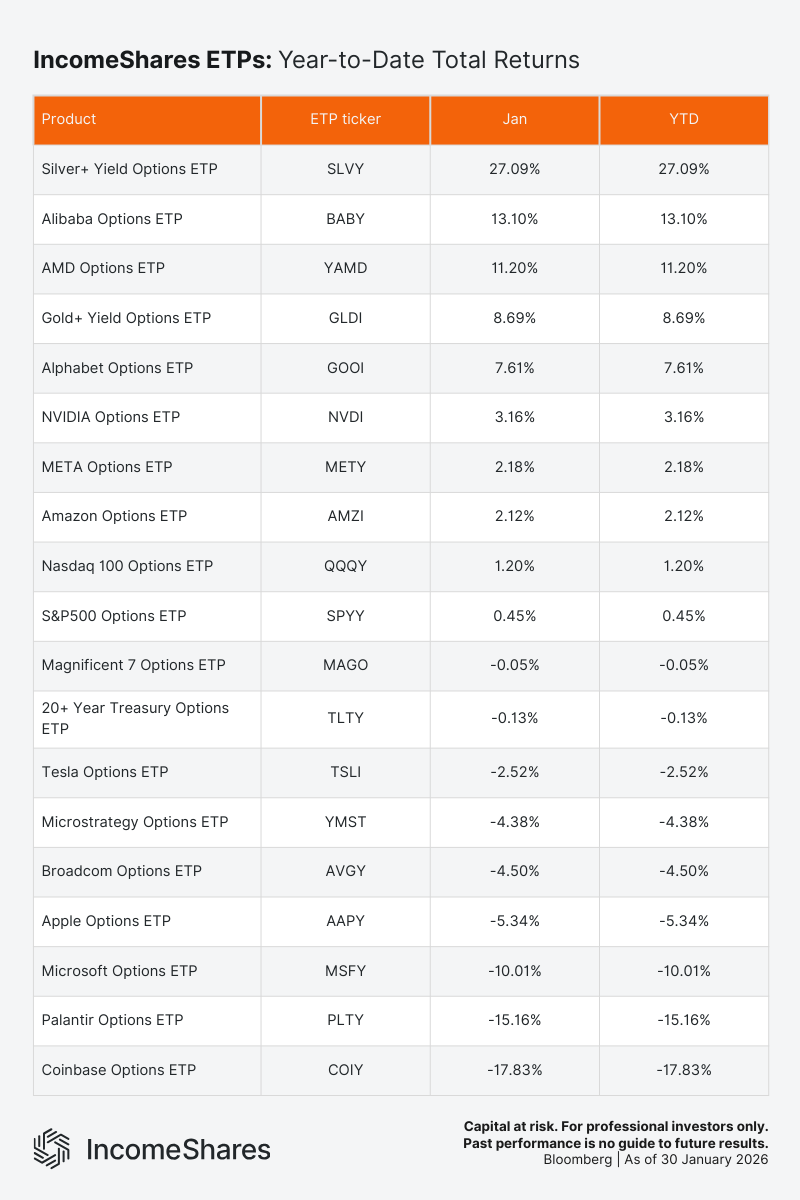
Total returns year-to-date
The next chart shows total returns for IncomeShares ETPs year-to-date, ranked from highest to lowest. These figures assume all income was reinvested back into the ETPs.
Key takeaways
IncomeShares AUM rose from $114.6 million to $127.8 million in January. Total AUM has increased every month since inception.
Cumulative net inflows reached $142.4 million. Cumulative fund flows have also increased every month since inception.
Monthly turnover reached a new high of $54.2 million across exchanges.
MicroStrategy, Coinbase, and Palantir ETPs paid the highest distribution yields of the IncomeShares range in January.
Silver, AMD, and Alibaba ETPs saw the highest total returns in January.
Votre capital est exposé à un risque si vous investissez. Vous pouvez perdre la totalité de votre investissement. Veuillez consulter l’avertissement complet sur les risques ici
Produits associé:

Stratégie
Option de vente couverte par liquidités (cash) + actions
Rendement des
distributions
47.37%

Stratégie
Option de vente couverte par liquidités + actions
Rendement des
distributions
52.98%

Stratégie
Option de vente couverte par liquidités + actions
Rendement des
distributions
46.87%

Stratégie
Option de vente couverte par liquidités + actions
Rendement des
distributions
70.60%

Stratégie
Covered call
Rendement des
distributions
11.83%

Stratégie
Basket of Income-generating ETPs
Rendement des
distributions
38.09%

Stratégie
Covered Call
Rendement des
distributions
11.50%

Stratégie
Option de vente couverte par liquidités + actions
Rendement des
distributions
85.26%