
Autor
Jonathan Hobbs, CFA
Fecha
13 Oct 2025
Categoría
Education
Why NAVs Move Daily in Income Options ETPs
Su capital está en riesgo si invierte. Podría perder toda su inversión. Por favor, consulte la advertencia de riesgos completa aquí.
Investors might wonder why an options ETP’s net asset value moves each day - even though the ETP mostly holds cash. Here’s the main reason: the market constantly reprices the value of the options that the ETP sells for its income strategy. Those daily price changes can move the NAV up or down.
This article breaks it down in more detail – including how daily NAVs can shift with stock prices, volatility, and time.
What NAV really shows
The net asset value (NAV) is the total market value of everything inside an ETP (exchange-traded product). That includes cash, assets held or liabilities owed – and the current market value of open option positions.
Even though options ETPs mostly hold cash, they also hold open option positions. Those values can move daily depending on market conditions. For example, factors like implied volatility or time decay can affect the price of an option on any given trading day. When those values change, the ETP’s total value changes – so the NAV moves too.
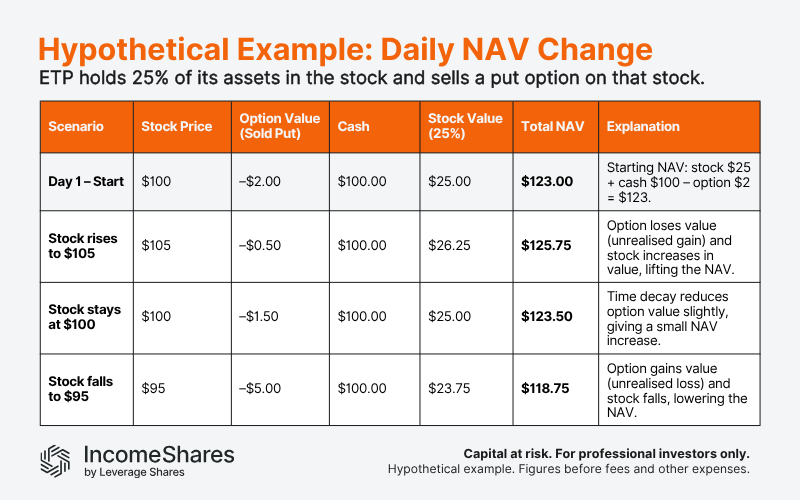
Example: daily NAV changes for a cash-secured put plus equity ETP
Let’s say an ETP sells one put option on Stock A for $2.00 per share. Each option covers one share. The ETP also holds 25% of its assets in Stock A and keeps the rest in cash to back the option.
On the first day, Stock A trades at $100 and the sold put is worth $2.00. The ETP’s NAV reflects all three parts:
Cash it holds
Value of the stock it owns
Market value of the open option position
If the stock rises to $105: the put option loses value for the option buyer. That’s because no one wants the right to sell Stock A for $100 when the market price is $105. Since the ETP sold that option, the drop in value helps its position. It’s an unrealised gain because the ETP still holds the option. The small stock holding also gains value. Together, those moves push the NAV higher.
If the stock falls to $95: The put option gains value for the buyer because selling at $100 becomes attractive. Since the ETP sold that option, the higher option price hurts its position. If the buyer hasn’t exercised, it’s an unrealised loss shown in the NAV. If they do exercise, that loss becomes realised. The stock holding also falls in value.
If the stock stays near $100: The option’s value can still change even if the stock doesn’t move. For example, time decay usually helps the ETP because the option loses value as expiry gets closer. Lower volatility can do the same, because there’s typically less chance of the option moving into profitability for the buyer. Higher volatility can make the option more expensive, which hurts the ETP’s position.
These small shifts can cause the NAV to move – even if the stock price stays the same.
The same logic applies to NAV calculations for other IncomeShares option selling strategies, including covered calls and 0DTE put-writing.
Key takeaways
NAV changes daily because the market reprices the ETP’s open option positions.
The cash balance stays steady, but the market value of options and any assets moves each day.
The same logic applies across IncomeShares strategies – whether it’s cash-secured puts, covered calls, or 0DTE put-writes.
Su capital está en riesgo si invierte. Podría perder toda su inversión. Por favor, consulte la advertencia de riesgos completa aquí.
Productos Relacionados:

Estrategia
Put garantizado con efectivo + Acciones
Rendimiento de
Distribución
50.34%

Estrategia
Put garantizado con efectivo + Acciones
Rendimiento de
Distribución
54.31%

Estrategia
Put garantizado con efectivo + Acciones
Rendimiento de
Distribución
72.13%

Estrategia
Put garantizado con efectivo + Acciones
Rendimiento de
Distribución
39.43%

Estrategia
Covered Call
Rendimiento de
Distribución
12.33%

Estrategia
Covered Call
Rendimiento de
Distribución
12.47%

Estrategia
Covered Call
Rendimiento de
Distribución
12.71%