
Autore
Jonathan Hobbs, CFA
Data
30 Jul 2025
Categoria
Market Insights
NAV vs Price: How to Track Options ETP Performance
Il tuo capitale è a rischio se investi. Potresti perdere l’intero investimento. Consulta l’avviso completo sui rischi qui.
IncomeShares exchange-traded products aim to generate income by selling options on US-listed assets. These ETPs are listed in Europe and the UK, but their underlying assets trade on US exchanges – in a different time zone. That time-zone gap can make it harder to track performance.
This article explains why an ETP’s market price may diverge from its Net Asset Value (NAV) and how that affects performance tracking. We’ll also learn why the NAV can give income investors a clearer picture of an ETP's performance.
Price vs NAV: What’s the difference?
The market price of an IncomeShares ETP is the last price it traded for on a UK or EU exchange. The NAV is the net asset value of the ETP’s assets, minus any operating costs to run the ETP. That NAV is calculated daily after US markets close. It reflects everything inside the ETP: its options, any underlying shares, and uninvested cash.
Because of this timing gap, a price move in the US market after the EU or UK market closes can cause the ETP’s NAV to move. But its market price won't reflect that move on the day, since the ETP stops trading when EU or UK markets close. This can make it seem like the ETP is mispriced compared to its NAV. But in reality, the price just hasn’t caught up yet.
Note: under normal conditions, an ETP’s price and NAV tend to move in sync. That’s because market makers can issue new shares or cancel existing ones to help keep the price close to NAV. This process adjusts supply to match demand and reduces price gaps.
Example: IncomeShares Gold+ Yield Options ETP (GLDI)
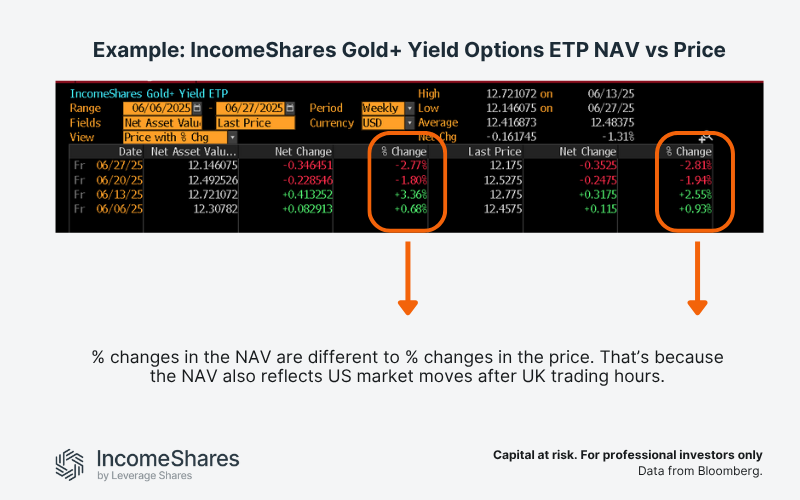
The image below shows the NAV and market price of the IncomeShares Gold+ Yield Options ETP (GLDI) across four weeks in June 2025. GLDI trades on the London Stock Exchange, while its underlying asset – the SPDR® Gold Shares ETF (GLD) – trades in the US.
On Friday 13 June, GLDI’s NAV rose 3.36%, but its market price only rose 2.55%. That’s because the NAV includes moves in GLD (and its related options positions) after UK markets closed, but the price doesn’t.
The market price may catch up the next day. But at first, it can lag the NAV by not reflecting what happened in US market hours. And if the value drops after UK hours, the opposite can happen – the price might fall less than the NAV.
NAV can provide a comprehensive view of how a UK/EU ETP tracks its underlying assets and positions. It includes the full US trading session.
IncomeShares ETPs aim to earn monthly income by selling options on US-traded assets. Some also hold the underlying asset, depending on the strategy. Tracking the ETP's market price alone, especially around big moves in the US, may not provide a complete understanding.
NAV reflects how the ETP is really performing, including what happened after UK or EU markets closed.
Key takeaways
- NAV shows an ETP’s fair value based on US market closes.
- Price can lag NAV when the underlying assets and positions move after EU hours.
- Understanding NAV, not just price, can provide a clearer view of performance – especially around big moves.
Il tuo capitale è a rischio se investi. Potresti perdere l’intero investimento. Consulta l’avviso completo sui rischi qui.
Prodotti correlati:

Strategia
Put garantita da liquidità + Azioni
Rendimento da
cedole
50.75%

Strategia
Put garantita da liquidità + Azioni
Rendimento da
cedole
28.02%

Strategia
Covered Call
Rendimento da
cedole
13.44%

Strategia
Basket of Income-generating ETPs
Rendimento da
cedole
55.84%

Strategia
Covered Call
Rendimento da
cedole
11.91%

Strategia
Covered Call
Rendimento da
cedole
15.60%