
Autore
Jonathan Hobbs, CFA
Data
14 May 2026
Categoria
Investor update
IncomeShares Monthly Investor Update – April 2026
Il tuo capitale è a rischio se investi. Potresti perdere l’intero investimento. Consulta l’avviso completo sui rischi qui.
IncomeShares launched 15 new exchange-traded products in April, expanding the range to 54 ETPs overall. AUM, cumulative fund flows, and trading turnover all closed the month at new all-time highs. Our ETPs linked to digital asset stocks, AI infrastructure names, and Intel produced relatively higher distribution yields for the month.
This update breaks down the numbers.
Assets under management (AUM)
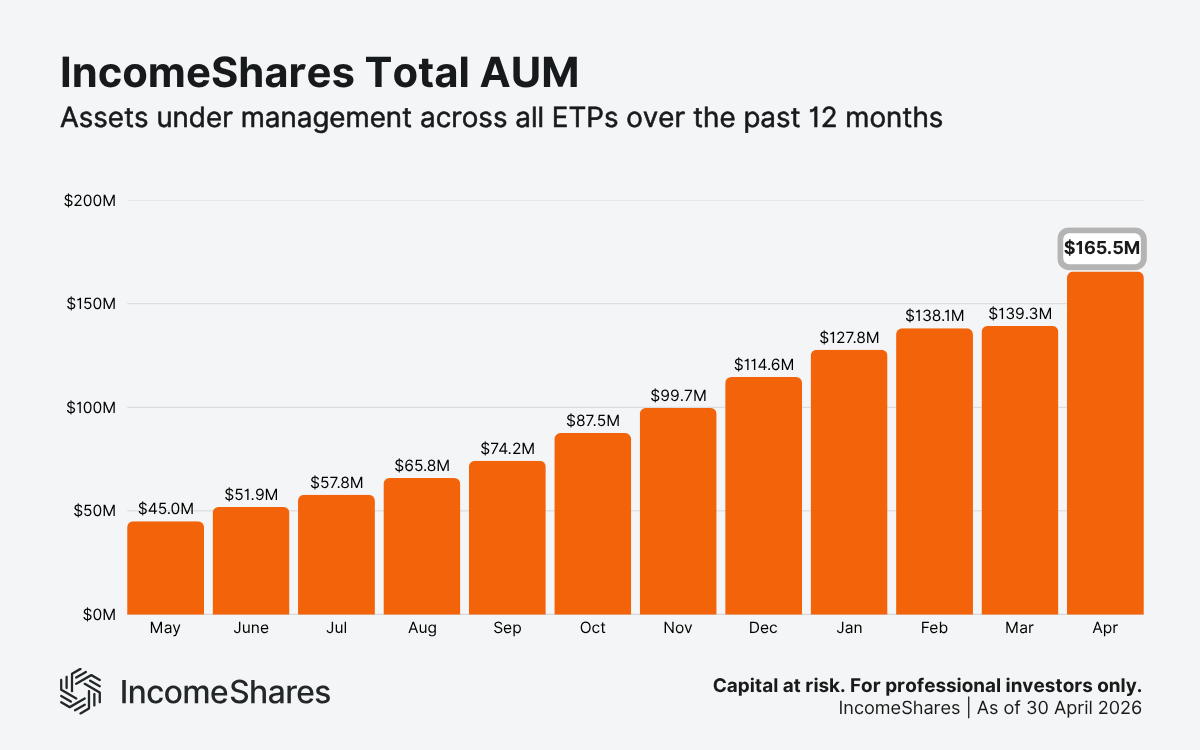
Total assets under management closed April at $165.5 million – up from $139.3 million at the end of March. This was our largest ever monthly rise in AUM in dollar terms, and the second largest percent increase since May last year. Net inflows of $16.1 million combined with market appreciation drove the $26.2 million AUM increase.
Gold+ Yield remains our largest product, with $39.23 million in AUM as of the end of April. Our Magnificent 7, Nasdaq 100, Silver+ Yield, and Tesla ETPs ended April with $16.03, $15.66, $12.27, and $11.51 million in AUM, respectively. Together with Gold+ Yield, these five ETPs account for about 56% of total AUM.
Cumulative fund flows
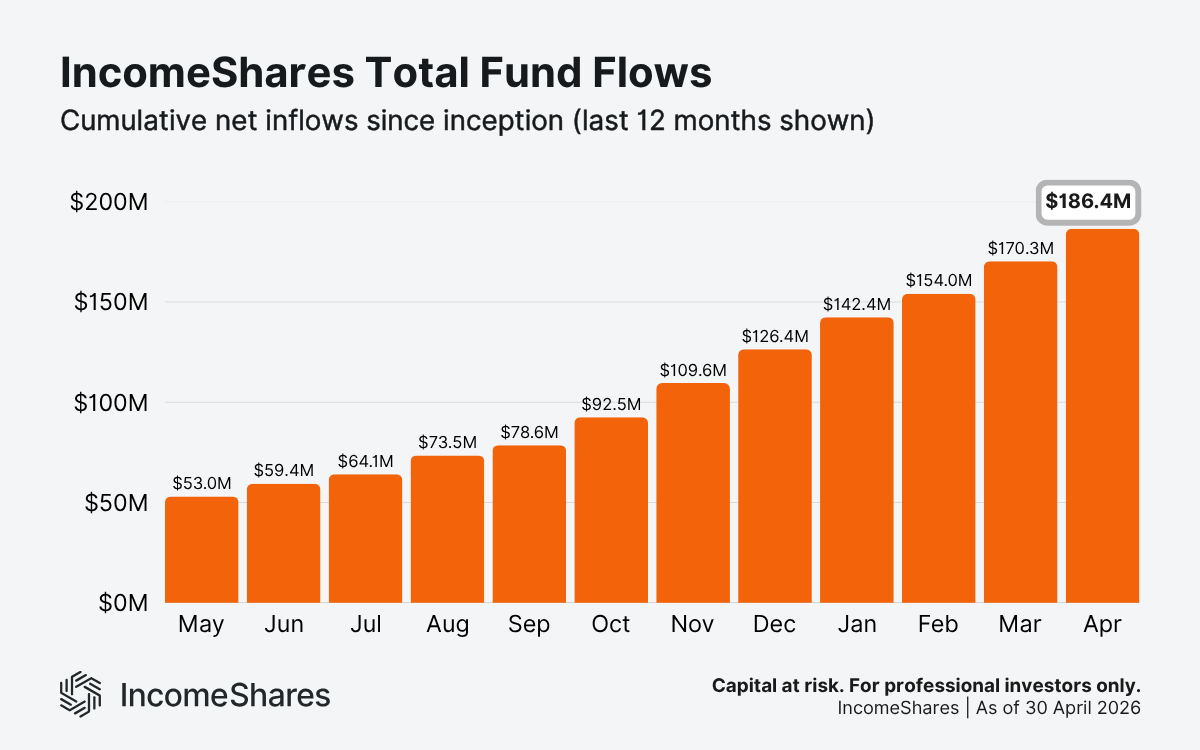
Cumulative fund flows reached $186.4 million by the end of April – a 9.5% increase from March. This metric tracks the net amount of money investors have added to IncomeShares exchange-traded products since inception. Positive flows suggest growing demand.
Gold+ Yield once again led monthly inflows in April, adding $2.77 million. Nasdaq 100 and Magnificent 7 followed with $2.43 and $2.15 million, respectively. Total fund flows have risen every month since inception, and continue to exceed total AUM. That's expected for products that pay monthly income, since distribution payments are subtracted from assets under management.
Trading turnover
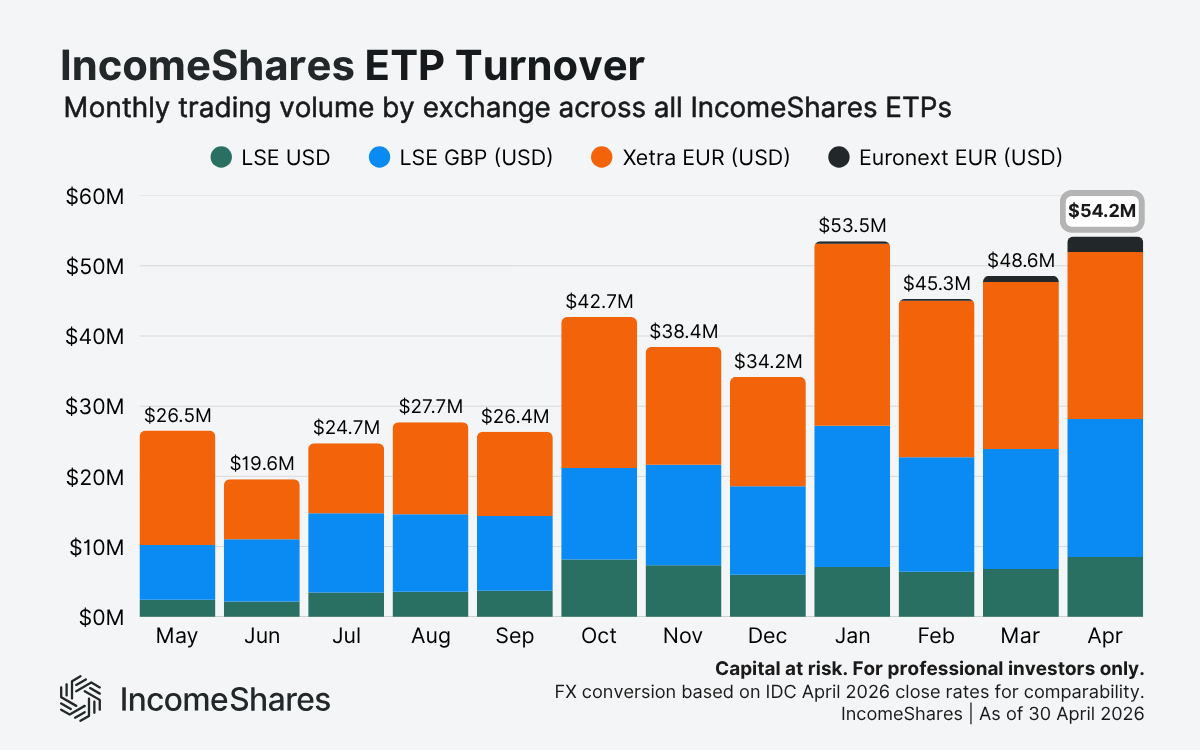
Total trading activity reached $54.2 million across exchanges in April – a new all-time high. Turnover has now held above $40 million for four months running.
Trading split fairly evenly between the London Stock Exchange and Xetra. Euronext Amsterdam continues to grow steadily since IncomeShares ETPs began trading there in November 2025.
Note: Figures use IDC FX rates as of the April month-end to convert GBP and EUR into USD for comparison.
15 new ETPs launched in April
IncomeShares listed 15 new exchange-traded products in April, expanding the range from 39 to 54 ETPs. The new products cover commodity-linked themes, US single stocks beyond tech, and diversified income products.
Commodity-linked ETPs: Gold Miners+ Yield, Silver Miners+ Yield, Copper Miners+ Yield, WTI Oil+ Yield, and Uranium+ Yield.
Single-stock options ETPs: Berkshire Hathaway, Micron, Netflix, Oracle, Robinhood, Taiwan Semiconductors, and UnitedHealth.
Diversified ETPs: 75/10/15 Multi-Asset Growth, Blockchain Leaders, and Eurostoxx 50 Options.
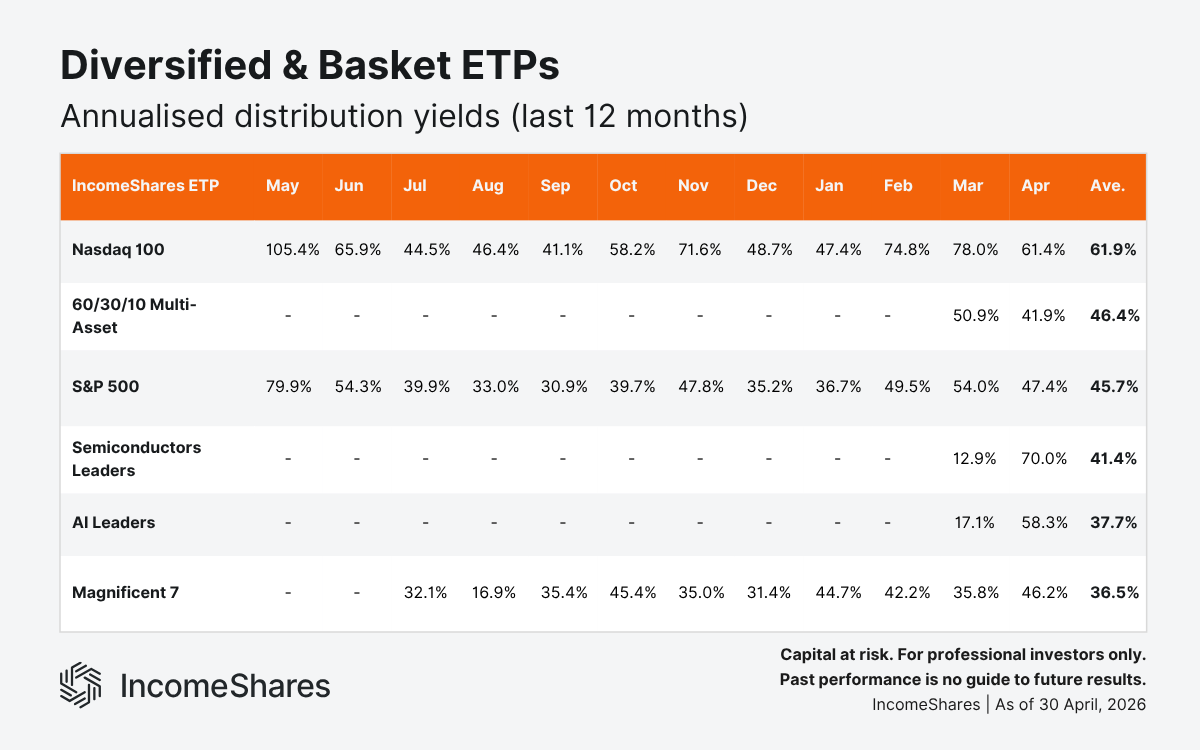
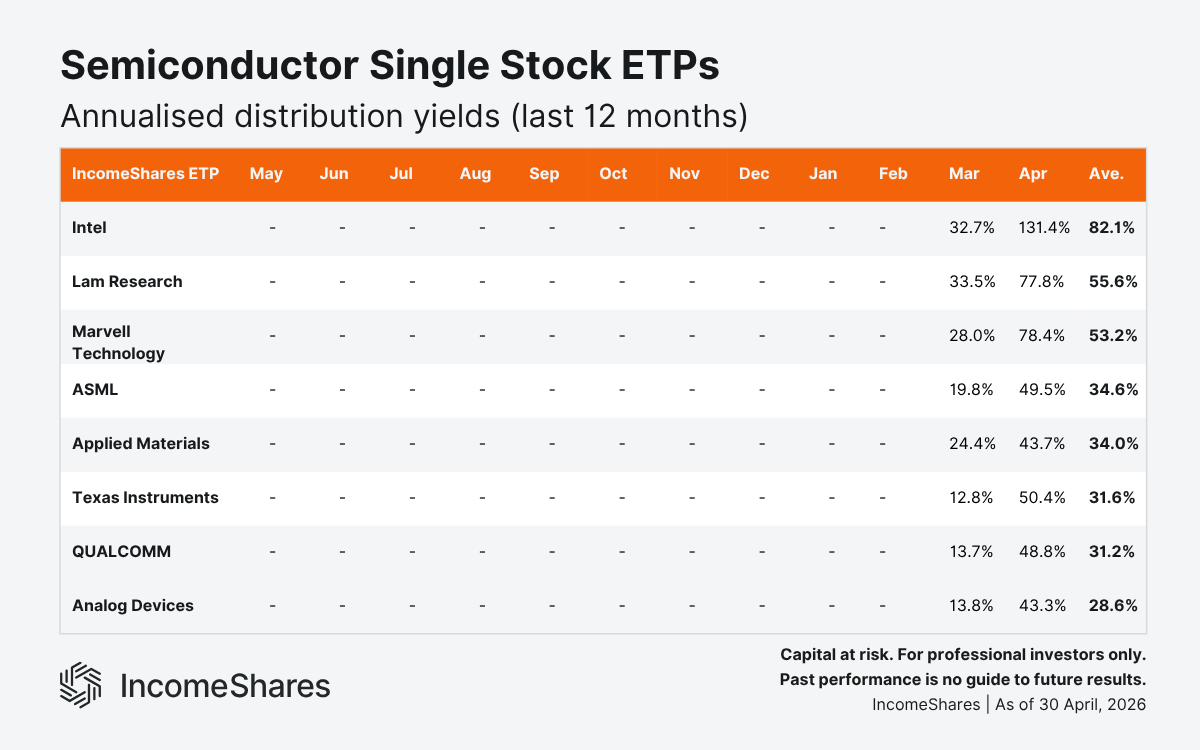
Distribution yields
Distribution yields represent the annualised income paid to investors as a percentage of an ETP's net asset value, based on the latest month's distribution. IncomeShares ETPs aim to generate this income from selling options. Yields change each month depending on strategy performance and market volatility.
April annualised distribution yields ranked from highest to lowest:
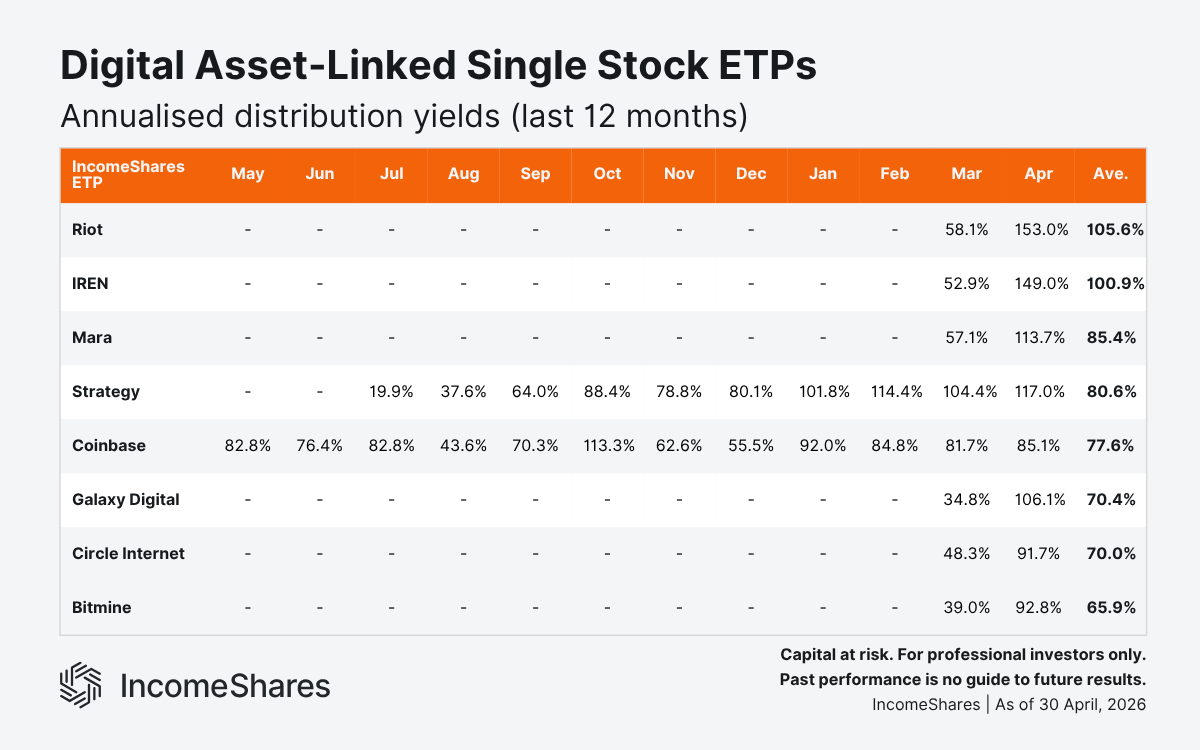
Riot Options ETP: 153.0%
IREN Options ETP: 149.0%
Intel Options ETP: 131.4%
MicroStrategy Options ETP: 117.0%
Mara Options ETP: 113.7%
Galaxy Digital Options ETP: 106.1%
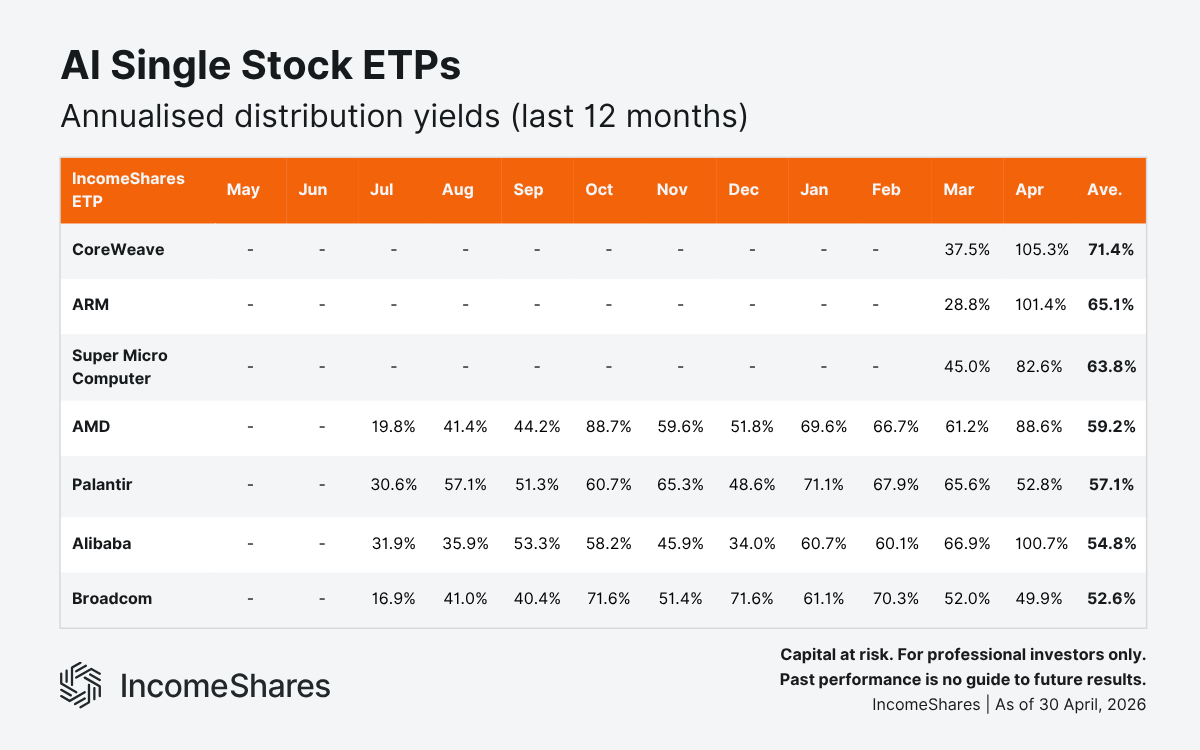
CoreWeave Options ETP: 105.3%
ARM Options ETP: 101.4%
Alibaba Options ETP: 100.7%
Bitmine Options ETP: 92.8%
Circle Internet Options ETP: 91.7%
AMD Options ETP: 88.6%
Coinbase Options ETP: 85.1%
Super Micro Computer Options ETP: 82.6%
Marvell Technology Options ETP: 78.4%
Lam Research Options ETP: 77.8%
Semiconductor Leaders Options ETP: 70.0%
Nasdaq 100 Options ETP: 61.4%
AI Leaders Options ETP: 58.3%
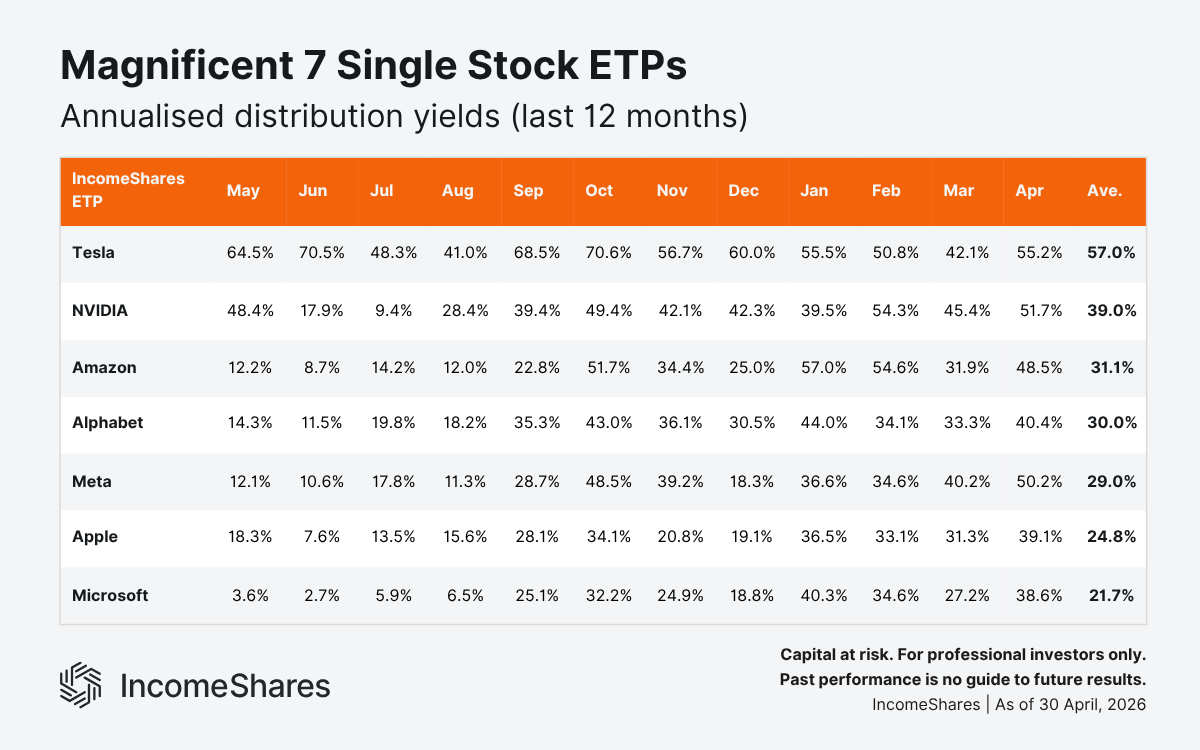
Tesla Options ETP: 55.2%
Palantir Options ETP: 52.8%
NVIDIA Options ETP: 51.7%
Texas Instruments Options ETP: 50.4%
Meta Options ETP: 50.2%
Broadcom Options ETP: 49.9%
ASML Options ETP: 49.5%
QUALCOMM Options ETP: 48.8%
Amazon Options ETP: 48.5%
S&P 500 Options ETP: 47.4%
Magnificent 7 Options ETP: 46.2%
Applied Materials Options ETP: 43.7%
Analog Devices Options ETP: 43.3%
60/30/10 Multi-Asset Options ETP: 41.9%
Alphabet Options ETP: 40.4%
Apple Options ETP: 39.1%
Microsoft Options ETP: 38.6%
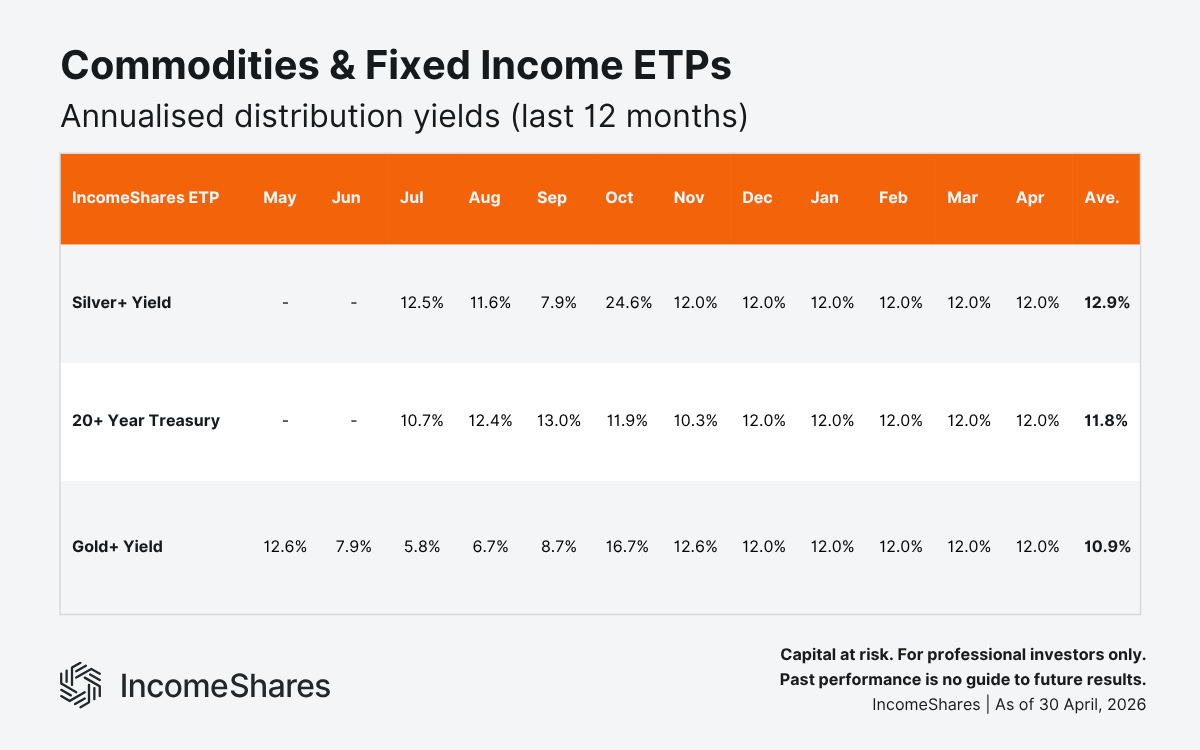
Silver+ Yield ETP: 12.0%
20+ Year Treasury Options ETP: 12.0%
Gold+ Yield ETP: 12.0%
Yields at the top of the table reflect heightened volatility in the underlying stocks. Higher volatility can lead to higher option premiums, which may flow through to higher monthly distributions.
April's top-yielding ETPs cluster into two volatile themes: digital asset-linked stocks and AI infrastructure. Names include Riot, Mara, Galaxy Digital, Bitmine, CoreWeave, and IREN.
Our Intel ETP also stands out at 131.4%. Intel's shares more than doubled in April – the best month in the stock's 55 years on the Nasdaq. The brunt of the rally followed a strong Q1 earnings report on 23 April.
With 54 ETPs now in the range, the tables below show annualised distribution yields over the past 12 months, grouped by theme. Not all ETPs have a full 12 months of data – each table shows yields from the month the product launched. The 15 ETPs launched in April aren't yet on these tables. Their first distributions will appear in next month's update.
Key takeaways
IncomeShares launched 15 new ETPs in April, expanding the range to 54 products across commodities, single stocks, and diversified baskets.
AUM, cumulative fund flows, and trading turnover all closed at new all-time highs. AUM jumped $26.2 million in April – the largest monthly rise on record.
Riot, IREN, and Intel ETPs posted the highest distribution yields in April. Annualised yields across the range stretched from 12.0% to 153.0%.
Il tuo capitale è a rischio se investi. Potresti perdere l’intero investimento. Consulta l’avviso completo sui rischi qui.
Prodotti correlati:

Strategia
Covered Call
Rendimento da
cedole
13.44%

Strategia
Basket of Income-generating ETPs
Rendimento da
cedole
55.84%

Strategia
Put garantita da liquidità + Azioni
Rendimento da
cedole
219.27%

Strategia
Put garantita da liquidità + Azioni
Rendimento da
cedole
388.86%

Strategia
Put garantita da liquidità + Azioni
Rendimento da
cedole
116.90%

Strategia
Put garantita da liquidità + Azioni
Rendimento da
cedole
121.97%

Strategia
Strategia di reddito basata su opzioni
Rendimento da
cedole
22.01%