
Auteur
Jonathan Hobbs, CFA
Date
23 Sep 2025
Catégorie
Market Insights
Is the US Stock Market Overvalued Today?
Votre capital est exposé à un risque si vous investissez. Vous pouvez perdre la totalité de votre investissement. Veuillez consulter l’avertissement complet sur les risques ici
Valuations in US stocks are a hot topic right now. Some indicators show levels near historic extremes, while others suggest things may not be as stretched as they look. This article breaks it down across the CAPE ratio, Buffett indicator, and other stock market valuation metrics.
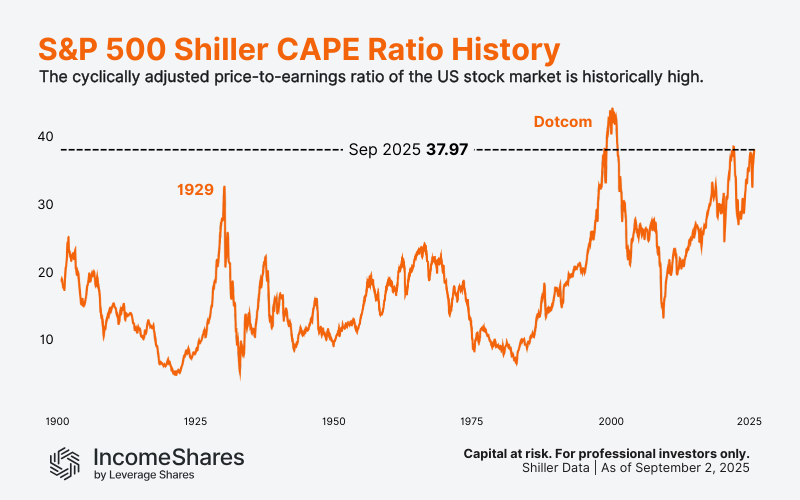
Shiller CAPE ratio
The Shiller CAPE ratio (cyclically adjusted price-to-earnings) is one way to measure the value of the S&P 500 index. It takes today’s index level and divides it by average earnings per share from the past ten years (adjusted for inflation). By using a decade of data, it helps smooth the usual ups and downs of business cycles.
As of September 2025, the CAPE sits at around 38 – well above its historical average. That suggests US stocks look expensive compared with history. The ratio is close to dot-com bubble levels and almost as high as in November 2021.
While high CAPE readings don’t guarantee a crash, they suggest investors are paying more for each dollar of earnings than usual.
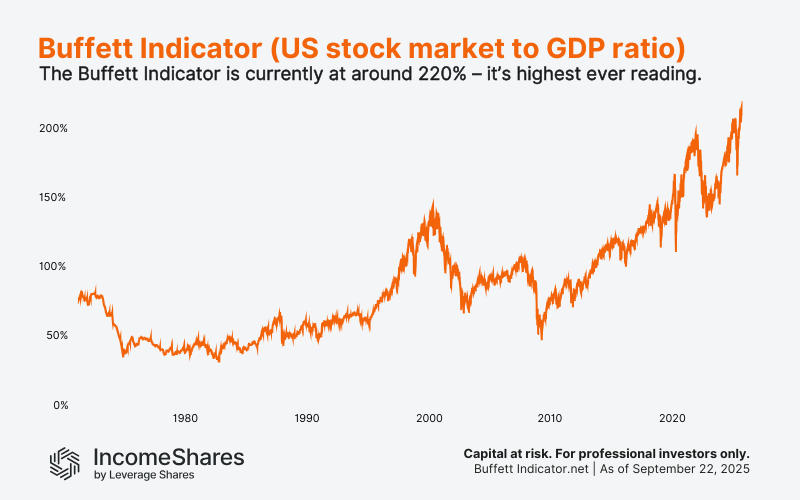
Buffett Indicator
The next chart shows the Buffett Indicator. It compares the US stock market value (Wilshire 5000 index) to the size of the US economy (Gross Domestic Product). The higher the number, the more expensive US stocks look compared to actual economic output.
The ratio is now hovering at roughly 220% – the highest level ever recorded (based on available data). This suggests the US stock market’s value has grown much faster than the US economy.
Two possible reasons stand out. First, big tech company values have risen substantially over the past decade. And second, many of these firms earn a large share of revenues overseas. Those revenues can boost company valuations but don’t count toward US GDP. That can make the ratio look higher today than in past decades.
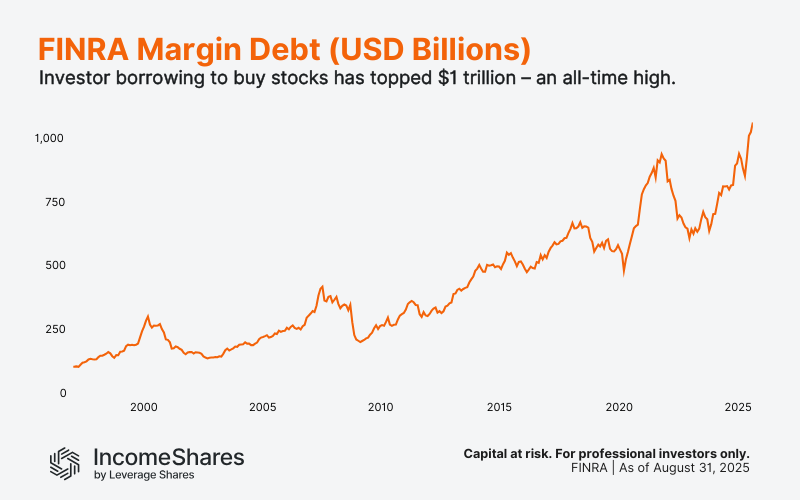
Margin debt
FINRA data shows investors have borrowed over $1 trillion against portfolios to buy more stocks – another all-time high. High margin debt can potentially magnify gains in rising markets. But it can also accelerate losses when markets fall, as investors typically need to sell more stocks to cover their positions. In some cases, this can set off a cascade of selling pressure for stocks.
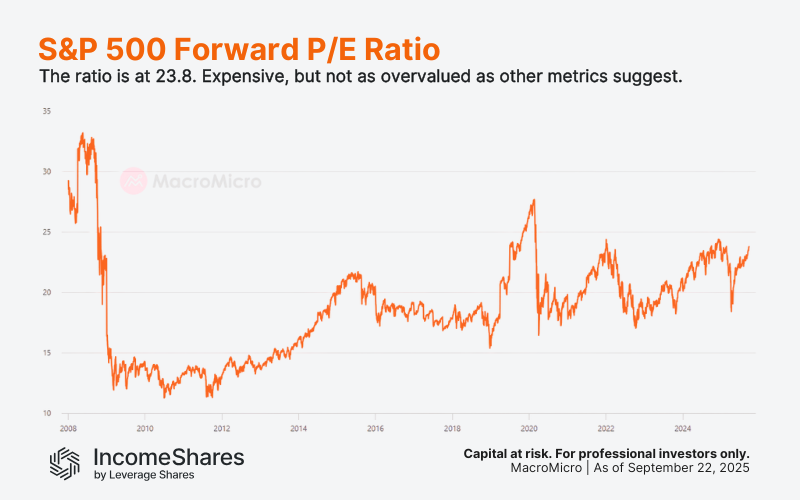
Forward P/E ratio
Not all indicators suggest the stock market is highly overvalued today. The forward price-to-earnings (P/E) ratio also measures the value of the S&P 500 index. But unlike the CAPE ratio, it compares today’s index level with analyst forecasts of future earnings over the next 12 months. In other words, it shows how much investors pay today for each dollar of expected future profit.
Right now, the forward P/E is about 23.8. That means investors pay $23.80 for every $1 of expected earnings over the next year. For context, it topped 27 in February 2020 before the Covid crash, and over 33 before the 2008 financial crisis.
That suggests today’s valuations aren’t universally extreme – provided US companies can continue to earn more profits. As with any valuation argument, much depends on which measure you focus on.
What this means for IncomeShares investors
Valuation metrics don’t predict when markets will rise or fall. They simply show how much investors are paying today relative to company earnings, GDP, or other data points.
For IncomeShares investors, the takeaway is that high valuations may increase uncertainty and volatility. That’s important because:
Options premiums often rise with volatility, which may boost income potential in IncomeShares ETPs.
Diversification across products like the MAG7 Options ETP (MAGO) or the 20+ Year Treasury Options ETP (TLTY) may help spread risk in concentrated markets.
The S&P 500 Options ETP (0DTE) combines put-selling with equity exposure. This approach may benefit from higher income potential while maintaining exposure to US stocks.
Key takeaways
Valuation indicators like CAPE, the Buffett Indicator, and margin debt are near historic highs.
Forward P/E ratios are elevated but not at extreme historical levels.
High valuations don’t guarantee a market drop, but they can increase volatility. This may affect both risk and income opportunities in option-based strategies.
Votre capital est exposé à un risque si vous investissez. Vous pouvez perdre la totalité de votre investissement. Veuillez consulter l’avertissement complet sur les risques ici
Produits associé:

Stratégie
Option de vente couverte par liquidités + actions
Rendement des
distributions
50.75%

Stratégie
Option de vente couverte par liquidités + actions
Rendement des
distributions
28.02%

Stratégie
Covered call
Rendement des
distributions
13.44%

Stratégie
Basket of Income-generating ETPs
Rendement des
distributions
55.84%

Stratégie
Covered Call
Rendement des
distributions
11.91%

Stratégie
Covered Call
Rendement des
distributions
15.60%