.webp)
Auteur
Jonathan Hobbs, CFA
Date
12 Aug 2025
Catégorie
Market Insights
IncomeShares 2025 ETP Growth Snapshot
Votre capital est exposé à un risque si vous investissez. Vous pouvez perdre la totalité de votre investissement. Veuillez consulter l’avertissement complet sur les risques ici
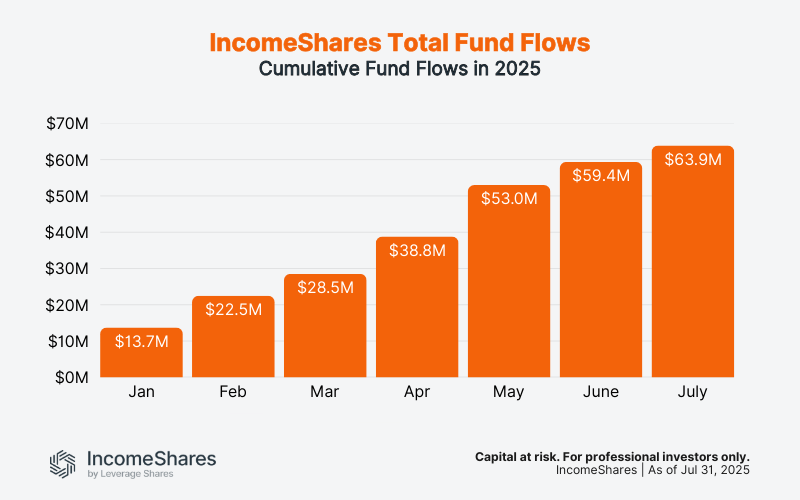
1. Cumulative fund flows
Cumulative fund flows represent the total amount of capital that has entered (or exited) the IncomeShares ETP range over time. Positive cumulative flows mean more money has come in than gone out – a sign of growing investor demand for IncomeShares products.
As shown in the chart below, IncomeShares ETPs have seen consistent monthly inflows throughout 2025. Cumulative fund flows climbed from $13.7 million in January to reach $63.9 million by the end of July. Each month has built on the last, reflecting growing interest in options-based strategies that aim to generate income.
2. Trading turnover growth
Trading turnover refers to the total dollar value of IncomeShares ETPs bought and sold by investors. A higher turnover means more trading activity.
Combined turnover across IncomeShares ETPs for July was $24.3 million. The chart below shows the monthly breakdowns by exchange and currency listing, using end-of-July GBPUSD and EURUSD exchange rates for comparability.
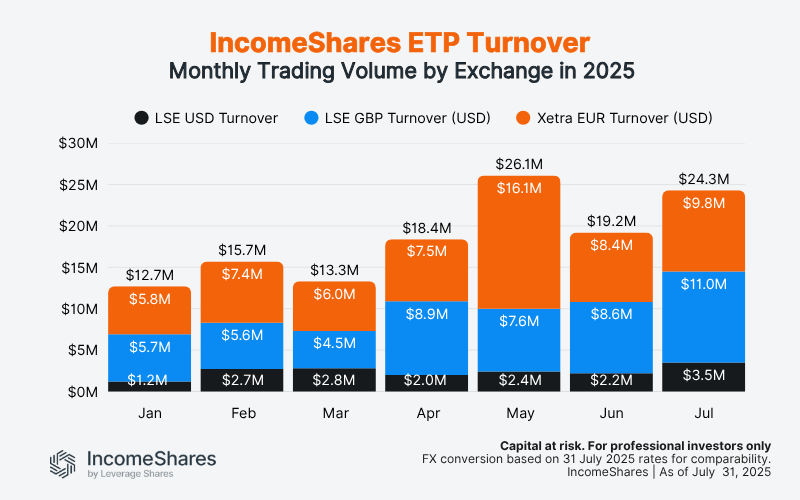
Total turnover has almost doubled since January. The data suggests increasing demand for options-based income strategies across listed venues in Europe and the UK.
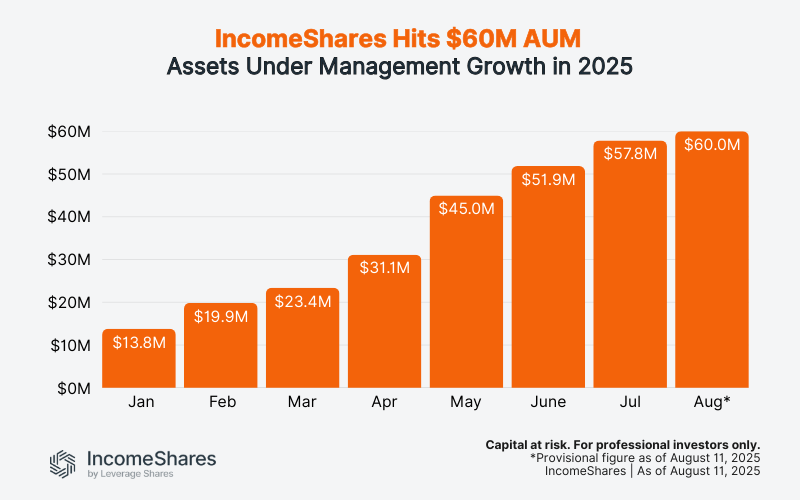
3. Assets under management (AUM) growth
IncomeShares hit a new milestone in August: $60 million in total AUM.
AUM has grown every month this year, from $13.8 million in January to $60 million as of 11 August – even as our ETPs continue to pay out consistent monthly income to investors.
IncomeShares currently offers 19 ETPs that aim to generate monthly income by selling options on single stocks, US stock market indexes, Treasury bonds, and commodities. The ETPs also have some upside exposure to the underlying investments themselves, based on their strategy and market conditions.
Votre capital est exposé à un risque si vous investissez. Vous pouvez perdre la totalité de votre investissement. Veuillez consulter l’avertissement complet sur les risques ici
Produits associé:

Stratégie
Option de vente couverte par liquidités + actions
Rendement des distributions
45.85%

Stratégie
Option de vente couverte par liquidités + actions
Rendement des distributions
40.89%

Stratégie
Covered call
Rendement des distributions
5.69%

Stratégie
Basket of Income-generating ETPs
Rendement des distributions
31.74%

Stratégie
Covered Call
Rendement des distributions
10.61%

Stratégie
Covered Call
Rendement des distributions
12.06%