

Auteur
Jonathan Hobbs, CFA
Date
21 Oct 2026
Catégorie
Education
How Your Entry Price Affects Options Income ETP Returns
Votre capital est exposé à un risque si vous investissez. Vous pouvez perdre la totalité de votre investissement. Veuillez consulter l’avertissement complet sur les risques ici
Your entry price determines your yield on cost (income on what you paid) in an options income exchange-traded product (ETP). But your total return depends on the ETP's income and how its net asset value (NAV) moves after you invest. This article compares the yields on cost and total returns of hypothetical investors who bought three IncomeShares ETPs at different prices.
All figures use daily data from Bloomberg, in US dollars, to 30 September 2026. Yields on cost use each ETP's latest monthly distribution from IncomeShares, declared on 30 September 2026. Total returns assume every distribution is reinvested.
Example 1: entry price on our NVIDIA Options ETP
Our NVIDIA Options ETP (USD ticker: NVDI) holds NVIDIA (NVDA) shares and sells put options on NVDA. The option buyers pay us a fee up front, called a premium. That premium goes towards the monthly income distributions we aim to pay.
The distribution yield is each monthly distribution as a share of the ETP's NAV, multiplied by twelve. Your yield on cost divides the same distribution by the price you paid per share instead.
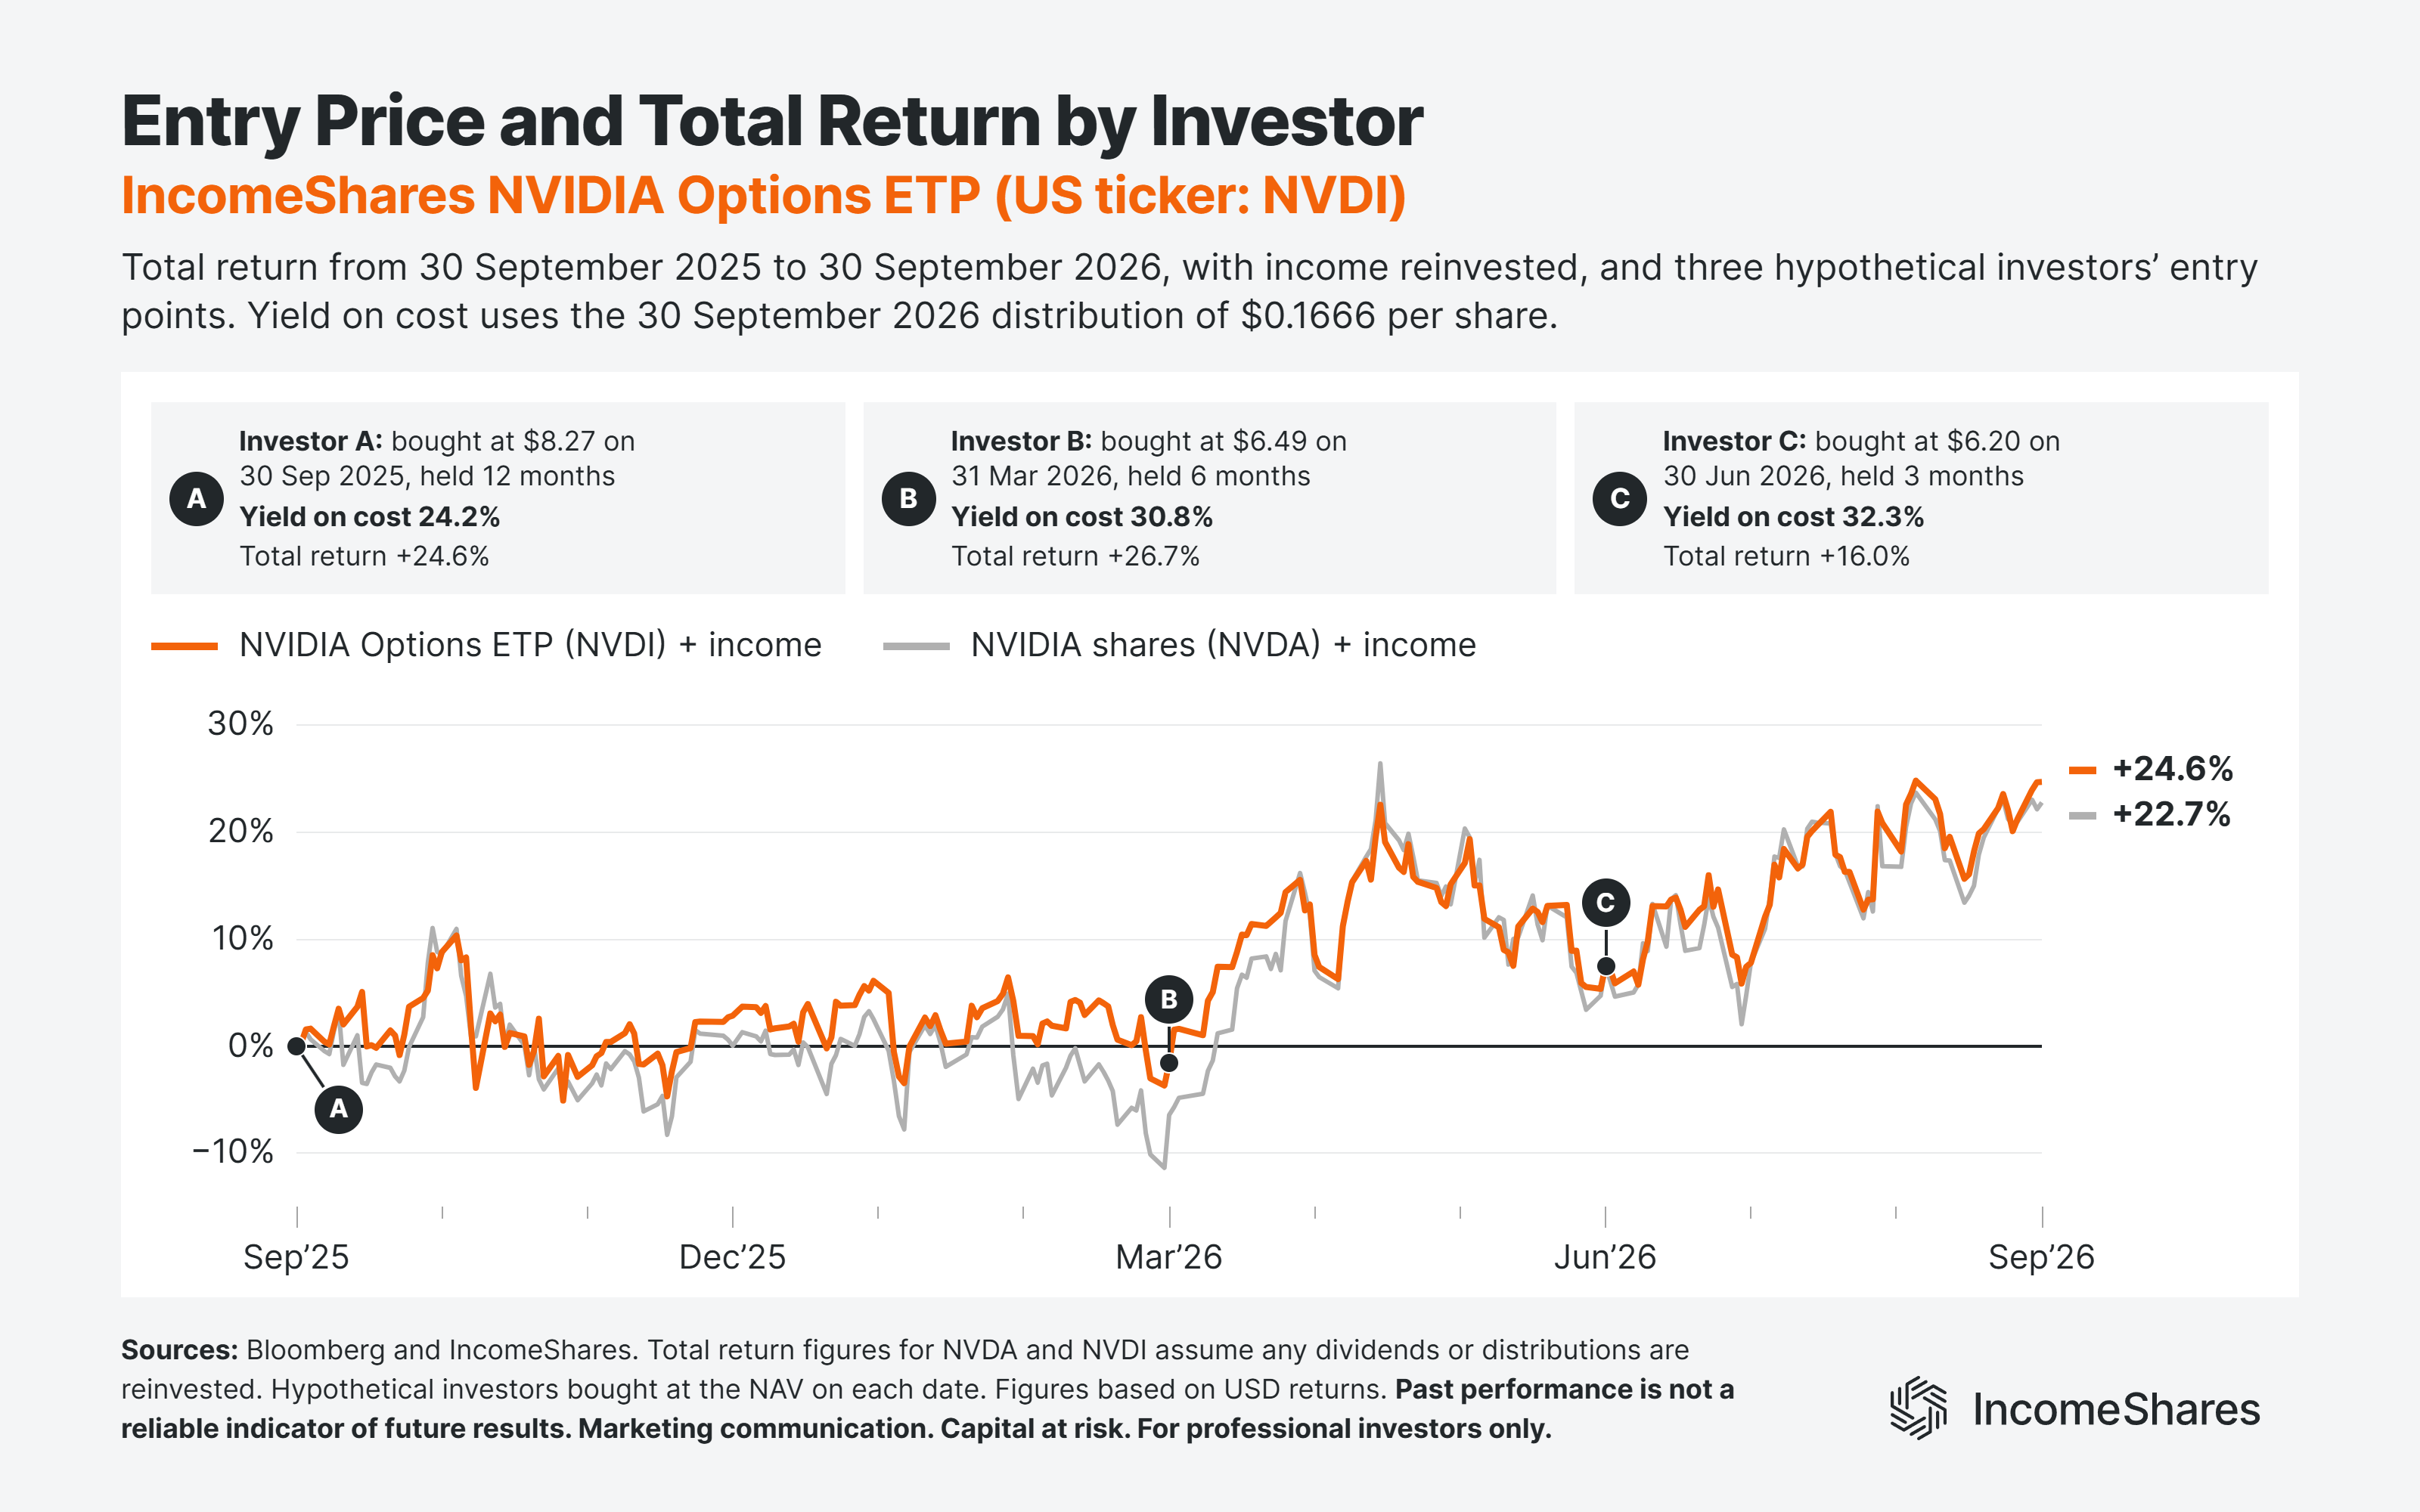
The three hypothetical investors bought the ETP's shares at the NAV on three dates. Investor A bought on 30 September 2025, Investor B on 31 March 2026, and Investor C on 30 June 2026. So by 30 September 2026, they'd held their shares for twelve, six, and three months, respectively. Here's where each stood by then:
Investor A: an entry price of $8.27 per share, a 24.2% yield on cost, and a 24.6% total return.
Investor B: a lower entry price ($6.49 per share), a higher yield on cost (30.8%), and a 26.7% total return.
Investor C: the lowest entry price ($6.20 per share), the highest yield on cost (32.3%), and a 16.0% total return.
NVDA's share price rose in all three investors' holding periods, and all three made a positive total return. Over the twelve months, the ETP's total return was 24.6%, against 22.7% for NVDA. The chart below shows both total returns, with each investor's entry point marked.
Example 2: entry price on our MicroStrategy Options ETP
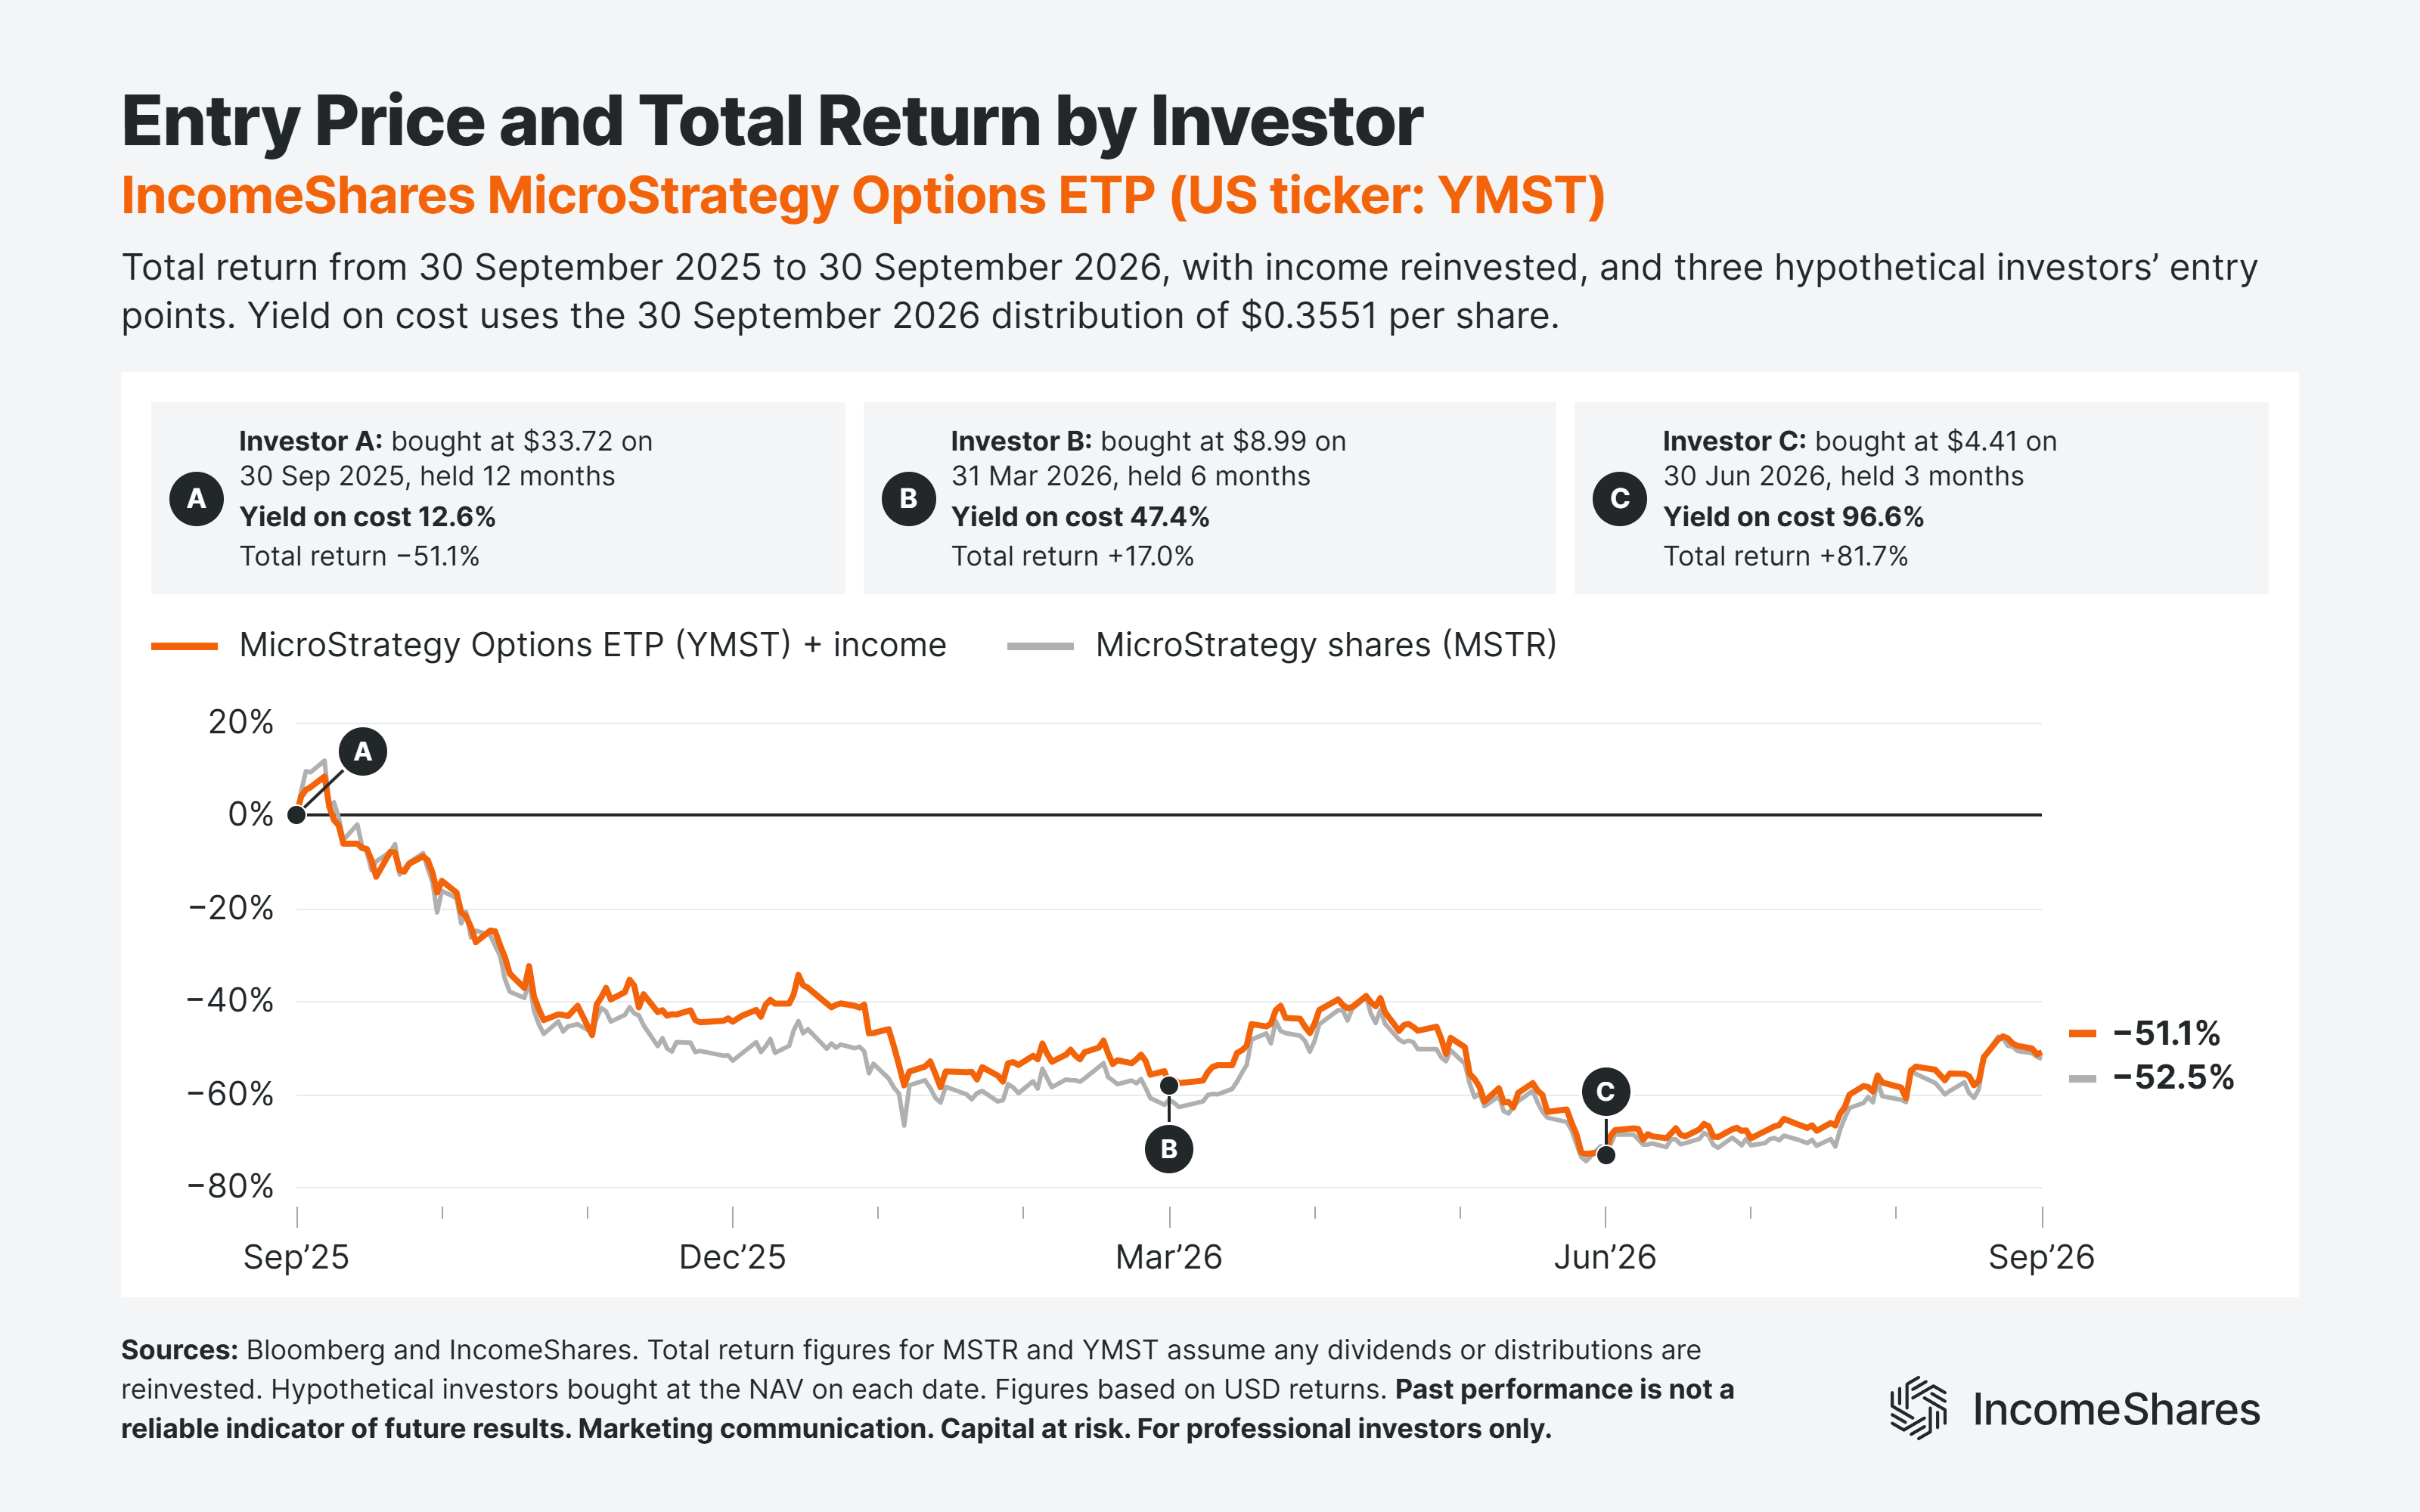
Our MicroStrategy Options ETP (USD ticker: YMST) works the same way, with MicroStrategy (MSTR) shares and put options on MSTR. Investors A, B, and C bought its shares on the same dates, but at very different prices:
Investor A: paid $33.72 per share, for a 12.6% yield on cost and a -51.1% total return.
Investor B: paid $8.99 per share – around a quarter of Investor A's entry price. That meant a 47.4% yield on cost and a 17.0% total return.
Investor C: paid $4.41 per share, which gave them a 96.6% yield on cost and an 81.7% total return.
MSTR's share price fell 73% between 30 September 2025 and 30 June 2026. It then rose 76.1% in the three months after Investor C bought in. Each yield on cost uses the ETP's latest distribution of $0.36 per share. But its distributions have varied widely – a year earlier, the distribution was $1.81 per share. Over the twelve months, the ETP's total return was -51.1%, against -52.5% for MSTR, as the next chart shows.
Example 3: entry price on our 20+ Year Treasury Options ETP
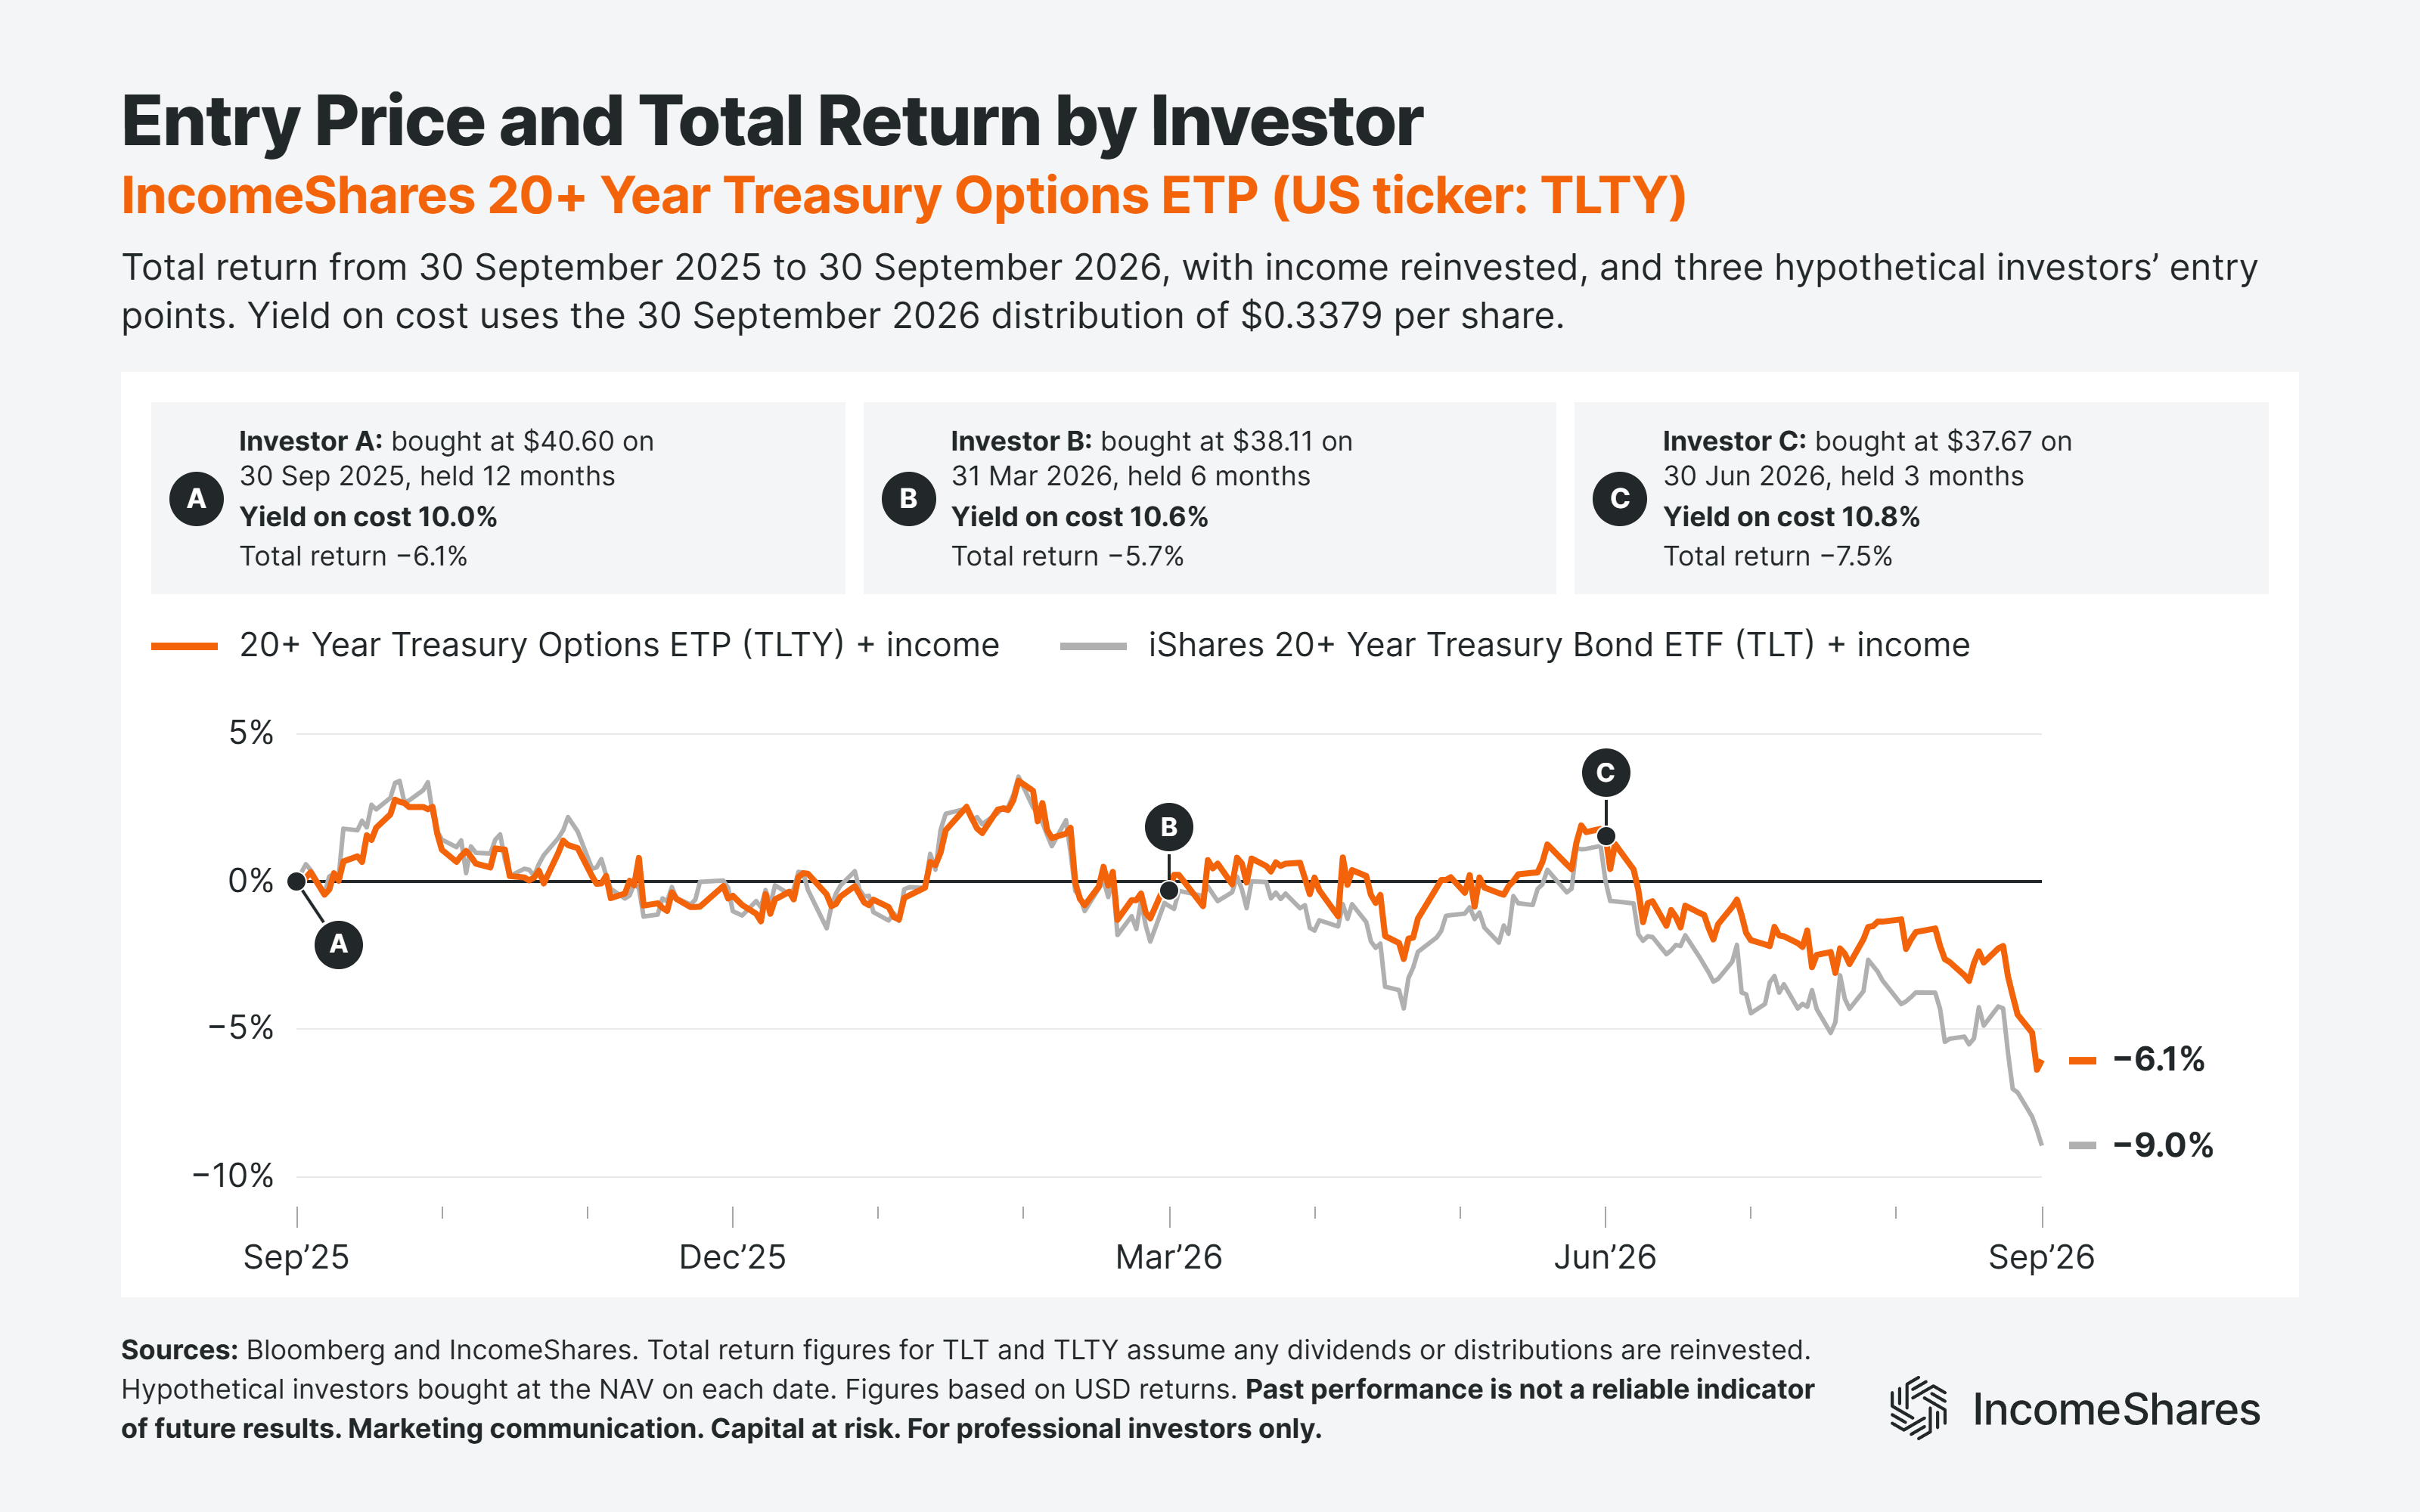
Our 20+ Year Treasury Options ETP (USD ticker: TLTY) works differently. It holds the iShares 20+ Year Treasury Bond ETF (TLT) and sells call options on that exchange-traded fund. We aim to pay a monthly distribution of around 1% of the NAV – a distribution yield of around 12%. This time, the three investors' entry prices were closer together:
Investor A: paid $40.60 per share, for a 10.0% yield on cost and a -6.1% total return.
Investor B: paid $38.11 per share and had a 10.6% yield on cost, with a -5.7% total return.
Investor C: paid the lowest price of the three ($37.67 per share), for a 10.8% yield on cost and a -7.5% total return.
All three yields on cost were below 12%. That's because the ETP's NAV fell below each investor's entry price, and the distribution fell with it. Meanwhile, TLT's price fell in all three investors' holding periods – and all three had a negative total return. Over the twelve months, the ETP's total return was -6.1%, versus -9.0% for TLT.
Key highlights
Your entry price determines your yield on cost. If the ETP's NAV falls below your entry price, your yield on cost will be lower than its distribution yield – and vice versa.
Your total return depends on the ETP's income and how its NAV moves after you invest.
Yield on cost uses the latest monthly distribution, so it can change quickly – especially on our put-selling ETPs.
Votre capital est exposé à un risque si vous investissez. Vous pouvez perdre la totalité de votre investissement. Veuillez consulter l’avertissement complet sur les risques ici
Produits associé:

Stratégie
Option de vente couverte par liquidités (cash) + actions
Rendement des
distributions
33.51%

Stratégie
Covered Call
Rendement des
distributions
11.94%

Stratégie
Option de vente couverte par liquidités + actions
Rendement des
distributions
75.84%