

Author
Jonathan Hobbs, CFA
Date
22 Jul 2026
Category
Education
Distribution Yield vs Yield on Cost: What You Earn
Your capital is at risk if you invest. You could lose all your investment. Please see the full risk warning here.
The distribution yield on an IncomeShares exchange-traded product and your yield on cost are two different numbers. This article explains what each one measures, and how to work out what your own investment is earning.
What the distribution yield shows
Our IncomeShares ETPs aim to generate income by selling options and collecting the premiums. We aim to pay that income to investors as monthly distributions, though distributions may vary.
The distribution yield turns those distributions into a single headline figure for the whole ETP. It takes the latest monthly distribution as a percentage of the fund's net asset value (NAV) per share. Then it multiplies that number by twelve to show it as a yearly figure.
Let's use a hypothetical example. Say an ETP pays $0.20 per share in a month. Its NAV is $8.00 per share. That's a monthly yield of 2.5% ($0.20 ÷ $8.00). If you multiply that by twelve to show it as a yearly figure, you get a 30% distribution yield.
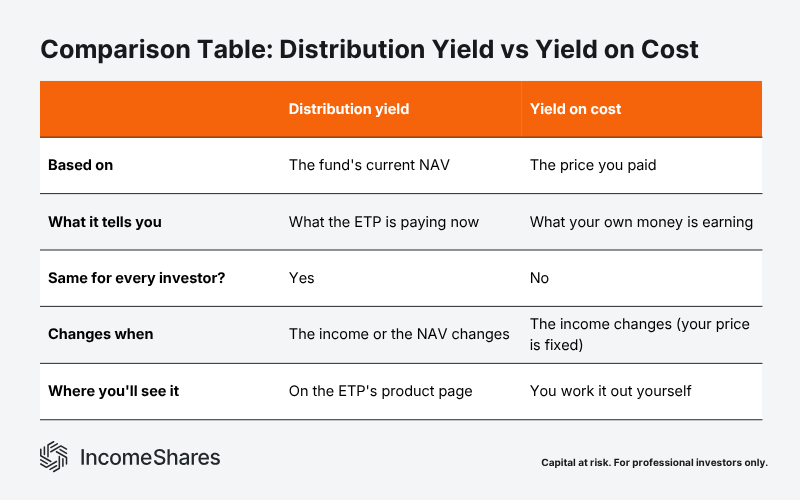
That 30% is the same figure for every investor. That's because it's based on the fund's NAV, not the price an investor paid for their ETP shares.
What yield on cost shows
The yield on cost is your own number. It works the same way, but divides the income by the price you actually paid for your ETP shares, not the current NAV.
Take the same ETP, still paying $0.20 per share this month. If you bought your shares at $10.00, that's a monthly yield on cost of 2% ($0.20 ÷ $10.00).If you multiply that number by twelve, your yield on cost is 24%. If you paid $12.00, it's 1.67% a month ($0.20 ÷ $12.00), or 20% over the year.
Two investors in the same product can have very different yields on cost because they may have paid different prices for their ETP shares. The distribution yield tells you what the product is paying now. Your yield on cost tells you what your own investment is yielding.
Keep in mind that a yield only counts the income, not the change in the value of your shares.
Three things to remember
The distribution yield is one figure for the whole ETP, based on its current NAV. Every investor sees the same number.
Yield on cost is your own figure. It depends on the price you paid for your ETP shares.
Neither yield reflects what your shares are now worth – only the income they pay.
Your capital is at risk if you invest. You could lose all your investment. Please see the full risk warning here.
Related Products:

Strategy
Covered Call
Distribution Yield
12.14%

Strategy
Basket of Income-generating ETPs
Distribution Yield
32.85%

Strategy
Covered Call
Distribution Yield
12.96%

Strategy
Portfolio of Multi-Asset Income Strategies
Distribution Yield
22.61%

Strategy
Portfolio of Multi-Asset Income Strategies
Distribution Yield
31.24%