
Author
Jonathan Hobbs, CFA
Date
03 Feb 2025
Category
Market Insights
How Distribution Yields Work in Options ETPs
Your capital is at risk if you invest. You could lose all your investment. Please see the full risk warning here.
Distribution yields help investors understand the income potential of options-based Exchange-Traded Products (ETPs). But they are not fixed: they fluctuate based on market conditions, option premiums, and the Net Asset Value (NAV) of the fund. In this guide, we’ll unpack how distribution yields work with options ETPs.
What is a distribution yield?
IncomeShares options ETPs aim to earn income by selling options (calls or puts) for premiums. A distribution yield is the annualised income paid out to investors from those premiums – expressed as a percentage of the ETP’s current NAV. The distribution yield provides a snapshot of current income potential but doesn’t guarantee future payouts.
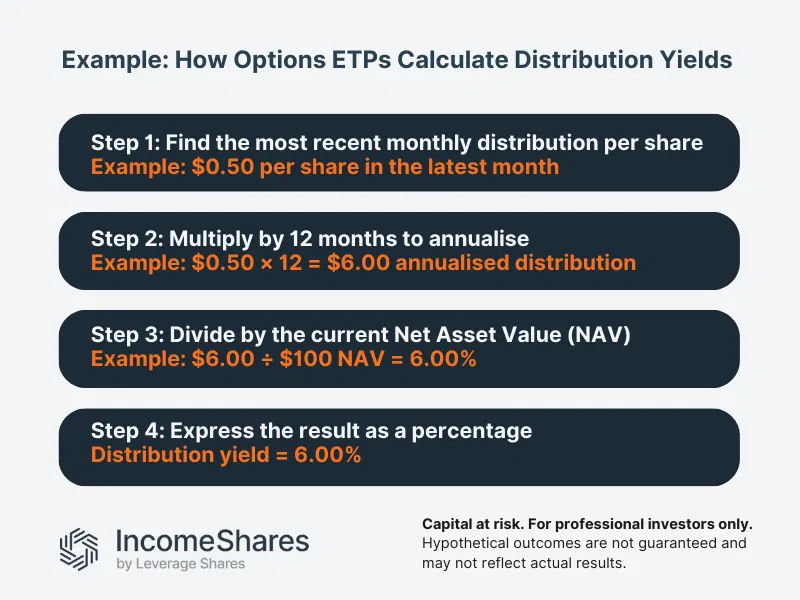
Distribution yield is based on the most recent monthly distribution (or payout), which is then annualised over 12 months. Here’s the basic formula:
Distribution yield (%) = (Most recent monthly distribution × 12 months / current NAV) × 100
Note: Annualising takes a short-term figure (like one month of income) and projects it over a full year. But it does not mean the yield will stay the same. Monthly distributions can fluctuate based on market conditions, which affects the annualised yield over time.
Why do distribution yields change with options ETPs?
A few factors might impact an ETP’s distribution yield:
Option premiums: Covered call and put-write strategies aim to generate income from selling options. If option premiums rise, yields may increase. If they drop, yields may fall.
Market volatility: Higher volatility can lead to higher options premiums. This can boost yields in options-based ETPs. In calmer markets, premiums might shrink, which can lower yields.
NAV fluctuations: If the ETP’s NAV rises, the distribution yield might decrease, even if income remains the same. If the NAV drops (for example, from NAV erosion) the yield may appear higher. Remember, the distribution yield is taken as a percentage of the ETP’s NAV.
Distribution yield examples from IncomeShares ETPs
Different ETPs use different options strategies and underlying assets, which can impact distribution yields. Here’s how it works with real products:
IncomeShares S&P 500 Options (0DTE) ETP: The ETP sells 0DTE (zero-day-to-expiration) put options on the S&P 500 index. It aims to collect premiums daily. As of the end of 2024, this ETP had a distribution yield (annualised) of 41.38%, based on December 2024’s distribution. Note: distribution yields can change based on short-term market movements and option pricing.
Gold+ Yield options ETP: This ETP sells out-of-the money call options on gold, with the aim of collecting premiums. Its annualised distribution yield was 2.80% as of the end of 2024.
Past performance is not indicative of future results.
Key takeaways
Distribution yields show the annualized income generated by an ETP as a percentage of its NAV.
Yields are calculated using the latest monthly distribution and multiplied by 12 to project a full-year figure, but actual payouts can change.
Options-based strategies like covered calls and put-writing generate income but also come with risks that impact long-term yield stability.
Your capital is at risk if you invest. You could lose all your investment. Please see the full risk warning here.
Related Products:

Strategy
Cash-Secured Put + Equity
Distribution Yield
39.42%

Strategy
Covered Call
Distribution Yield
11.94%