
Autor
Jonathan Hobbs, CFA
Fecha
12 Mar 2026
Categoría
Education
Price Return vs Total Return for Options Income ETPs
Su capital está en riesgo si invierte. Podría perder toda su inversión. Por favor, consulte la advertencia de riesgos completa aquí.
If you check the price of an options income ETP and it’s down, that number alone doesn’t show the full performance. This article explains why total return gives a more complete picture than price return – using three real examples.
Price return vs total return: what’s the difference?
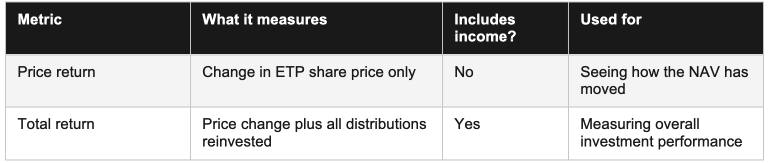
Price return (sometimes called NAV return) measures how much an ETP’s share price has moved. If you invested $10,000 into an ETP and the price is now $9,600, your price return is −4%.
Total return counts the price move plus every income distribution paid out by the exchange-traded product. It assumes you reinvested that income back into the ETP. For a product paying 10–12% a year, for example, the two figures can look very different.
Think of a rental property. It may not have risen in value. But if it paid rent each month and you reinvested that rent, your total return would be higher in this example.
Price return vs total return summary table:
How price return and total return compare: three examples
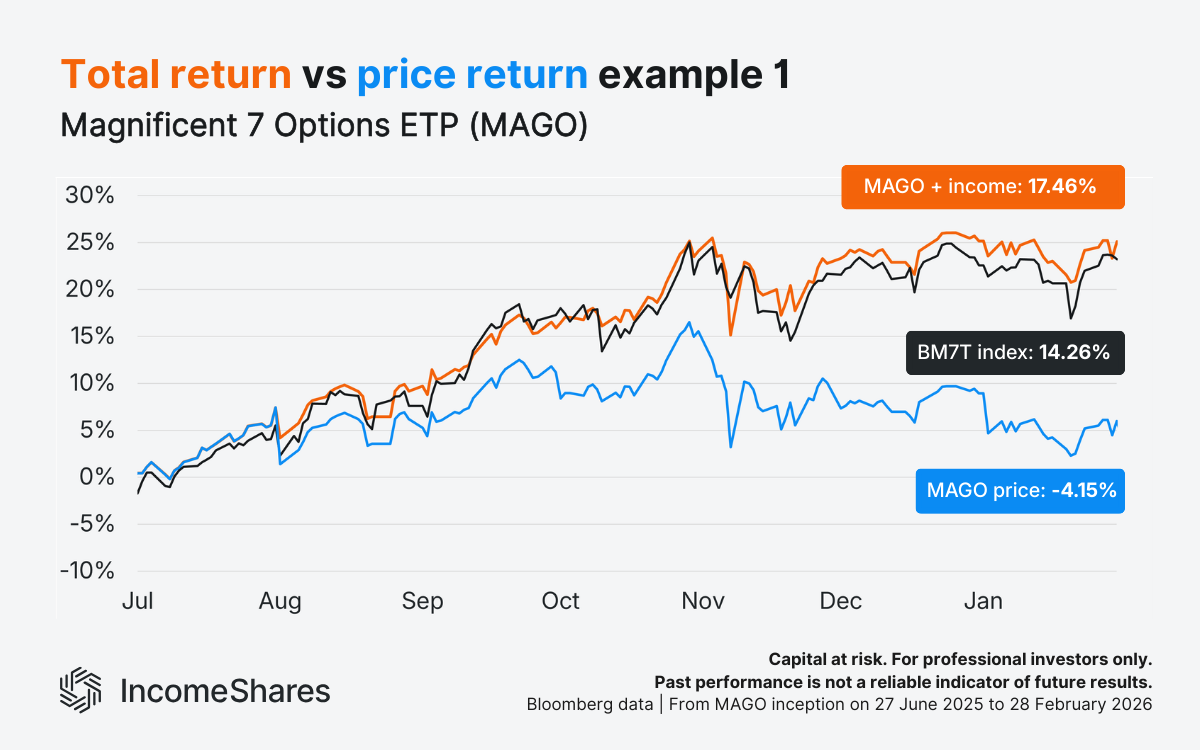
Our IncomeShares Magnificent 7 Options ETP (MAGO) launched on 27 June 2025. It holds a basket of our individual Mag 7 ETPs. Each individual ETP sells put options on its respective Mag 7 stock to generate income.
Using data from Bloomberg, MAGO’s price return was −4.15% from launch until the end of February. But it paid out monthly income distributions throughout. If you reinvested those distributions, the total return to 28 February 2026 was 17.46%. That outperformed the Bloomberg Magnificent 7 Total Return Index (BM7T), with 14.26% over the same time.
MAGO outperformed its benchmark on a total return basis over that period – even though its price return was negative. The income distributions and reinvestment accounted for the difference.
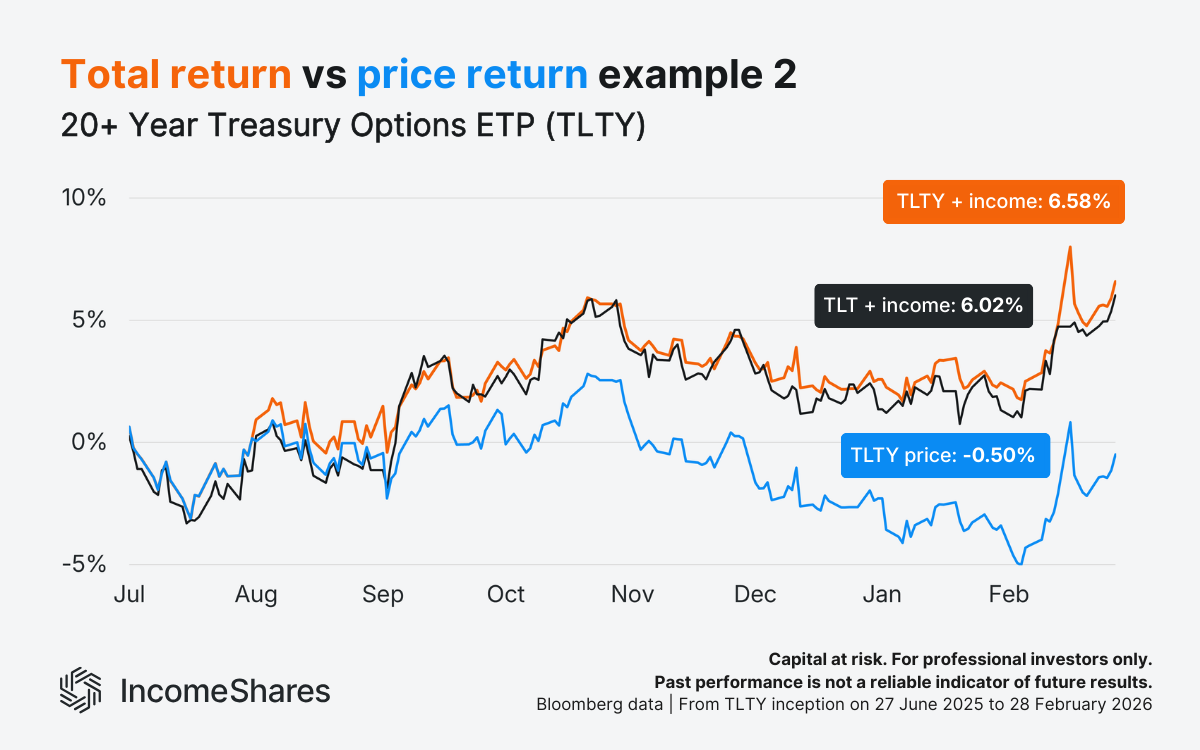
Our IncomeShares 20+ Year Treasury Options ETP (TLTY) sells call options on the iShares 20+ Year Treasury Bond ETF (TLT). Like MAGO, it also launched on 27 June 2025.
TLTY’s price return since launch was −0.50%. But its total return was 6.58% – ahead of the 6.02% total return from TLT. Again, reinvesting income made a difference over that period.
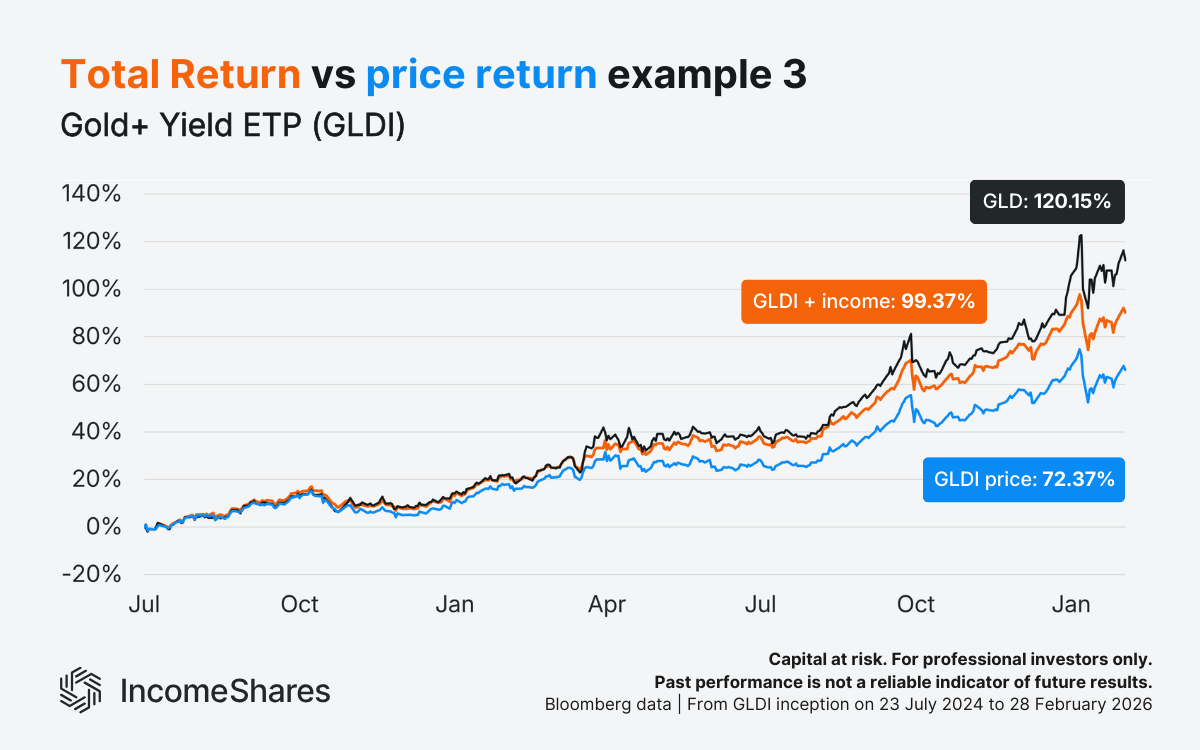
Finally, our Gold+ Yield ETP (GLDI) holds SPDR Gold Shares (GLD) and sells calls on it for income. It launched in July 2024.
GLDI’s price return from launch until the end of February was 72.37% – already a strong result. But its total return was 99.37% when including income reinvested along the way.
GLD's total return over the same period was 120.15%. The covered call strategy caps the upside in strong rallies, so GLDI's total return trailed GLD's here. But the point holds: total return gives a more complete picture of overall investment performance than price return alone.
For more on how GLDI performed during the recent gold sell-off, see our GLDI gold sell-off case study.
Why reinvesting income changes the picture
Reinvesting income may compound returns over time. Each reinvestment would buy more ETP units, which could potentially pay more income.
It’s also why NAV erosion can sometimes seem larger than the total return suggests. The ETP price can fall when it pays out income. Total return accounts for that income – and if reinvested, can put it back to work.
Three things to remember
Price return can fall as ETPs pay out income. For income products, a declining price isn’t always a warning sign.
Total return counts the price move with income reinvested. It provides a more complete picture of investment performance.
Reinvesting income can compound over time. The longer the investment period, the more the total return could differ from the price return.
Su capital está en riesgo si invierte. Podría perder toda su inversión. Por favor, consulte la advertencia de riesgos completa aquí.
Productos Relacionados:

Estrategia
Covered Call
Rendimiento de
Distribución
12.08%

Estrategia
Basket of Income-generating ETPs
Rendimiento de
Distribución
39.59%

Estrategia
Covered Call
Rendimiento de
Distribución
12.58%