
Auteur
Jonathan Hobbs, CFA
Date
06 Oct 2025
Catégorie
Investor update
IncomeShares Monthly Investor Update – September 2025
Votre capital est exposé à un risque si vous investissez. Vous pouvez perdre la totalité de votre investissement. Veuillez consulter l’avertissement complet sur les risques ici
IncomeShares continued to grow in September. Assets under management climbed to more than $74 million, cumulativefund flows topped $78 million, and turnover across London and Xetra listings reached $26 million. Coinbase led the distribution yields with an annualised 70.31%.
This update covers fund flows, turnover, assets under management, and distribution yields for September 2025.
Cumulative fund flows
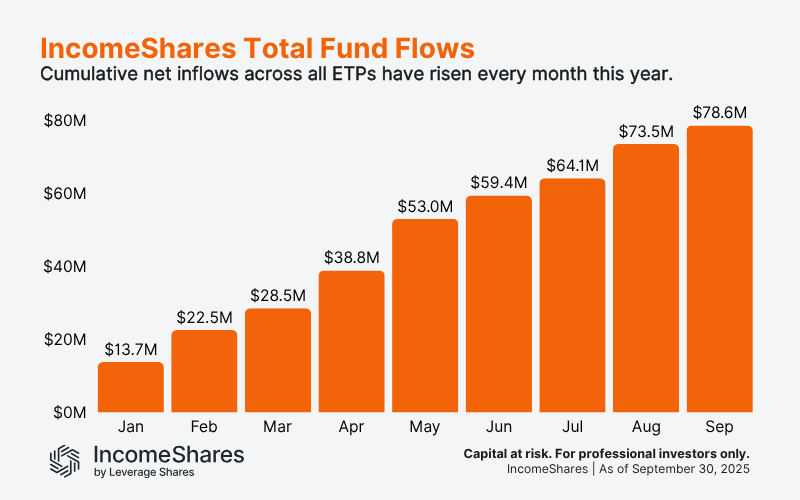
Cumulative fund flows track how much money investors put into or take out of IncomeShares ETPs. Positive flows mean more money coming in than going out – a sign of demand for the products.
Cumulative flows have increased every month this year. In January, they were just $13.7 million. By the end of September, they reached $78.6 million. That’s $5.1 million of new money in September, slightly down from August’s $9.4 million, but still a solid addition.
Trading turnover
Turnover is the total dollar value of IncomeShares ETPs bought and sold on the exchanges. Higher turnover means more activity and liquidity for investors.
Turnover came in at $26.4 million in September, just below August’s record $27.7 million. London listings (USD and GBP combined) made up $14.2 million, with Xetra close behind at $12.2 million. Both exchanges have shown steady growth through 2025, highlighting rising interest in income options strategies.
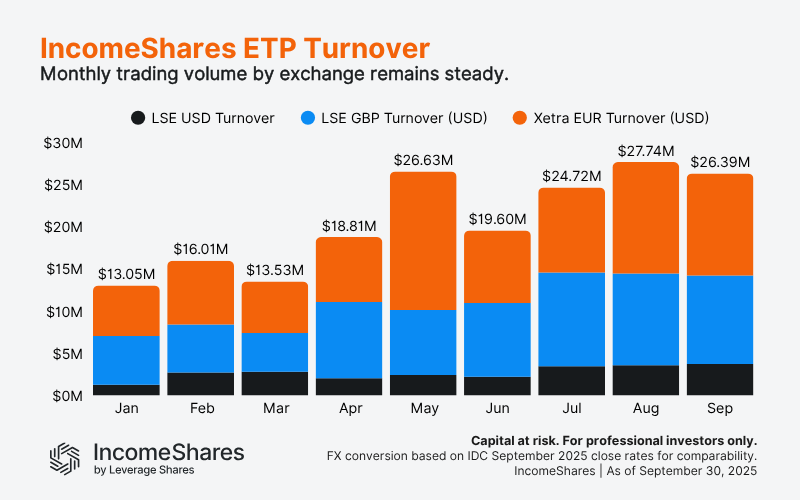
Note: Figures use IDC FX rates as of the September month-end to convert GBP and EUR into USD. We apply the same September rates to all prior months to compare turnover on a like-for-like basis.
Assets under management (AUM)
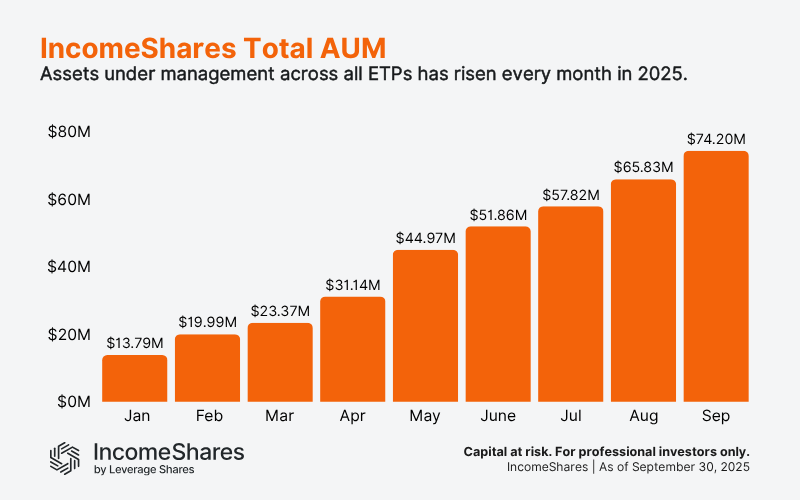
AUM is the total value of assets held across all IncomeShares ETPs. It grows when new investors buy in, or when the underlying assets rise in value.
AUM reached $74.2 million in September, up from $65.8 million in August.
Distribution yields
Distribution yields represent the annualised income paid to investors as a percentage of an ETP’s net asset value, based on the latest month’s yield. IncomeShares ETPs aim to generate this income from selling options. Yields change each month depending on strategy performance and market volatility.
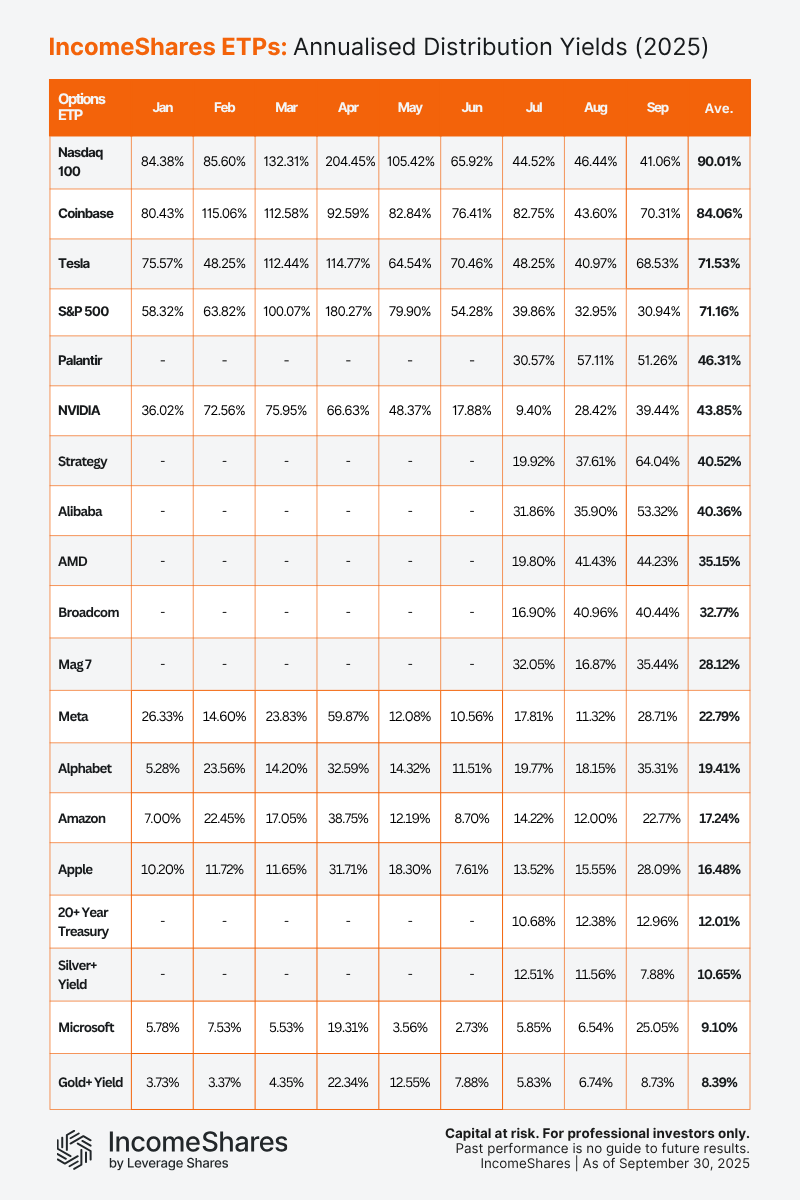
September annualised distribution yields ranked from highest to lowest:
Coinbase Options ETP (COIY): 70.31%
Tesla Options ETP (TSLI): 68.53%
MicroStrategy Options ETP (MSTY): 64.04%
Palantir Options ETP (PLTY): 51.26%
Alibaba Options ETP (BABY): 53.32%
AMD Options ETP (AMDY): 44.23%
Nasdaq 100 Options ETP (QQQY): 41.06%
Broadcom Options ETP (AVGY): 40.44%
NVIDIA Options ETP (NVDI): 39.44%
Alphabet Options ETP (GOOI): 35.31%
Magnificent 7 Options ETP (MAGO): 35.44%
Microsoft Options ETP (MSFY): 25.05%
Apple Options ETP (AAPY): 28.09%
Meta Options ETP (METY): 28.71%
S&P 500 Options ETP (SPYY): 30.94%
Amazon Options ETP (AMZI): 22.77%
20+ Year Treasury Options ETP (TLTY): 12.96%
Gold+ Yield Options ETP (GLDI): 8.73%
Silver+ Yield Options ETP (SLVY): 7.88%
Coinbase topped the list in September with a yield of 70.31%, up strongly from 43.60% in August. Tesla also surged to 68.53% as volatility lifted option premiums. At the other end, Gold+ Yield and Silver+ Yield remained under 9%, reflecting their typically more conservative yield-generation strategies.
Key takeaways
Fund flows: Inflows rose $5.1m in September, lifting cumulative flows to $78.6m.
Turnover: Monthly turnover was $26.4m, slightly below August’s record $27.7m.
AUM: Assets reached $74.2m, up from $65.8m in August.
Yields: Coinbase led with 70.31%, followed by Tesla at 68.53%, and MicroStrategy at 64.04%.
Votre capital est exposé à un risque si vous investissez. Vous pouvez perdre la totalité de votre investissement. Veuillez consulter l’avertissement complet sur les risques ici
Produits associé:

Stratégie
Option de vente couverte par liquidités (cash) + actions
Rendement des
distributions
47.37%

Stratégie
Option de vente couverte par liquidités + actions
Rendement des
distributions
52.98%

Stratégie
Covered call
Rendement des
distributions
11.83%

Stratégie
Covered Call
Rendement des
distributions
11.50%

Stratégie
Option de vente couverte par liquidités + actions
Rendement des
distributions
90.84%