
Auteur
Jonathan Hobbs, CFA
Date
14 Oct 2025
Catégorie
Market Insights
Incomeshares Gold Plus Yield ETP: Income From Gold’s Rally
Votre capital est exposé à un risque si vous investissez. Vous pouvez perdre la totalité de votre investissement. Veuillez consulter l’avertissement complet sur les risques ici
The gold price has more than doubled since early 2024 – climbing from around $2,000 to over $4,000 an ounce. But gold doesn’t pay any income: investors who held it earned nothing beyond price gains. The IncomeShares Gold+ Yield ETP aims to track gold's general price direction, while paying monthly income from selling call options on gold.
This article compares our Gold+ Yield ETP with regular gold ETFs – and how income strategies on gold may be worth exploring in today’s market.
How does the Gold Plus Yield ETP differ from a typical gold ETF?
Gold ETFs are exchange-traded funds that hold physical gold on behalf of investors – such as the SPDR® Gold Shares (GLD).
These ETFs:
Trade on the stock market like a regular share.
Aim to track the market price of physical gold (after fees).
Do not pay investors any income.
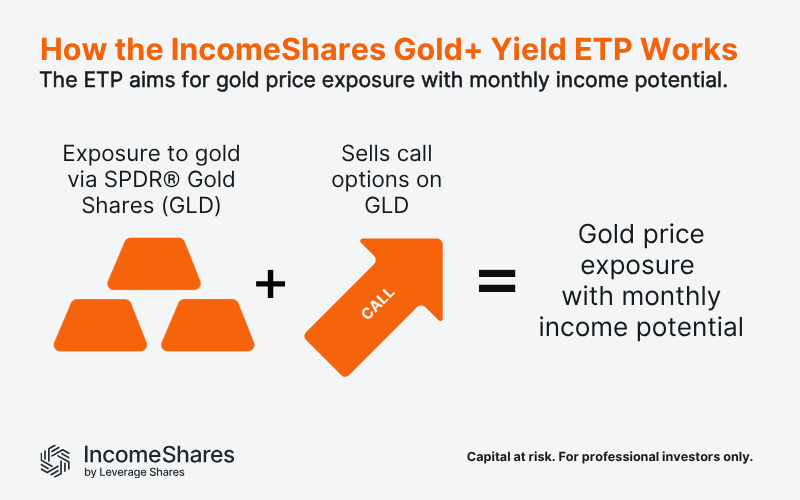
The IncomeShares Gold+ Yield ETP is an exchange-traded product that holds gold price exposure via SPDR® Gold Shares (GLD).
The Gold+ Yield ETP:
Trades on the stock market like a regular share.
Aims to track gold’s general price direction (after fees).
Aims to pay monthly income from selling call options on GLD.
From January to September 2025, Gold+ Yield has generated an average annualised distribution yield of 8.39% from selling call options on gold. These distributions have been paid out monthly to investors as ETP dividends.
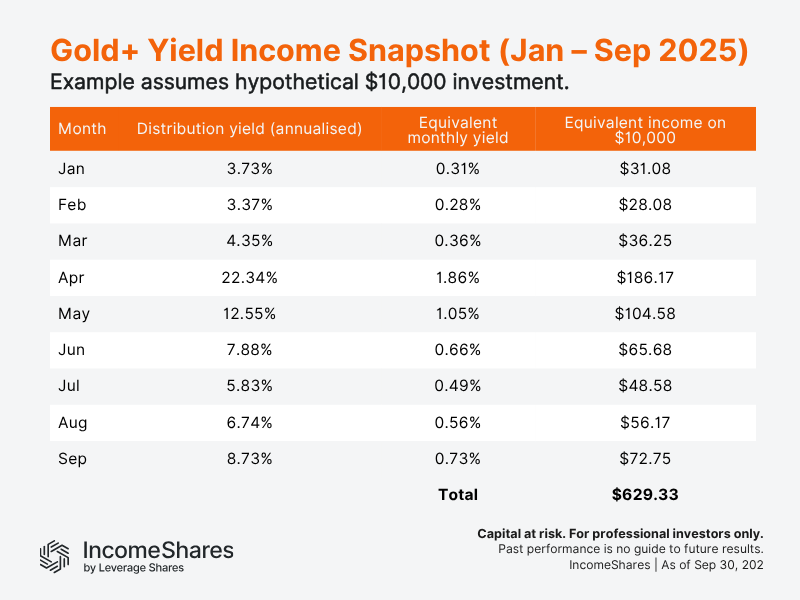
Note: we update distribution yields each month for our ETPs on our website, including distribution yields for Gold+ Yield.
How has Gold Plus Yield performed vs regular gold?
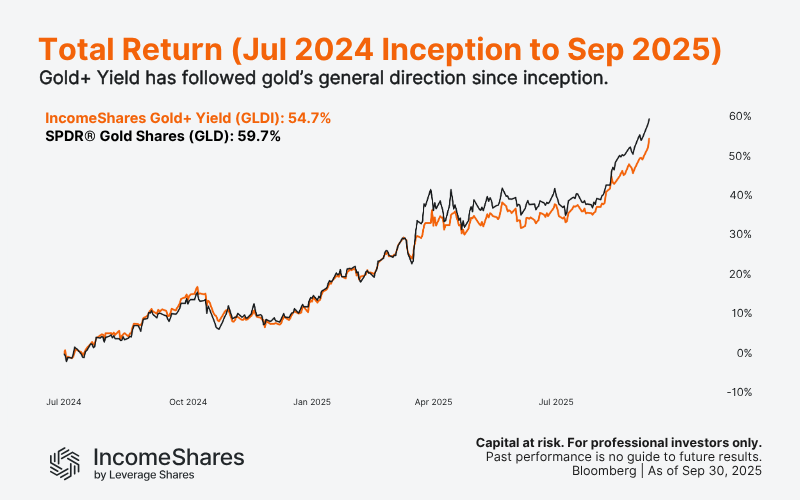
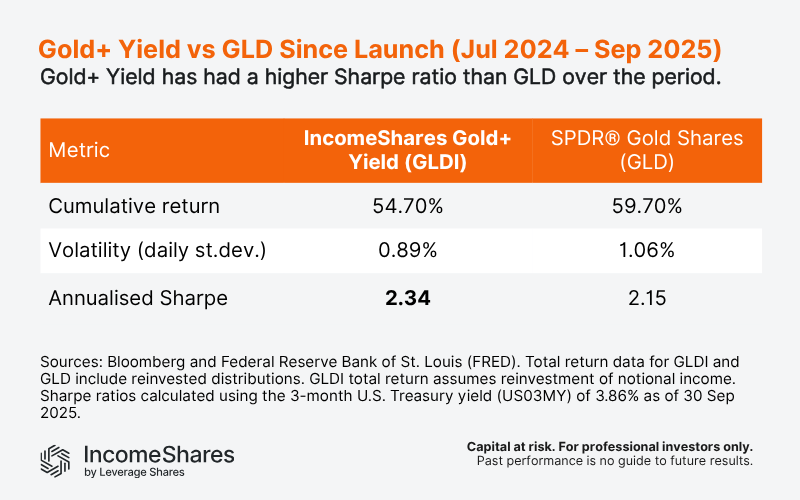
Gold+ Yield has moved closely with SPDR® Gold Shares (GLD) since inception on 23 July 2024. The chart below shows total returns (price changes plus option income reinvested) to highlight the directional tracking between the two.
While GLD has delivered stronger raw returns over the period, Gold+ Yield has followed gold’s path while paying monthly income. But that’s the potential trade-off with the strategy. One the one-hand, the ETP has capped upside during strong gold rallies (from selling call options to earn income). On the other, it can have smoother returns from income when gold consolidates or trades sideways.
We can use the Sharpe ratio to compare the risk-adjusted returns of Gold+ Yield with GLD. The Sharpe ratio measures an investment’s excess yearly return (above a “risk-free” rate) per unit of risk (volatility). From launch through September 2025, Gold+ Yield has delivered a higher Sharpe ratio than GLD. This suggests a better return per unit of risk over the period – but past performance is no guide to future results.
Is now the time to be more cautious on gold?
Gold has rallied for almost two years straight. The move has given gold bugs strong returns and made gold ETFs like GLD popular again. And although there’s no telling where gold “tops”, there are technical signs that the rally could be over-extended.
For example, gold’s monthly relative strength index (RSI) is currently above its January 1980 reading. Put simply, gold’s high RSI reading suggests buyers now have extreme “relative strength” compared to sellers, according to the indicator.
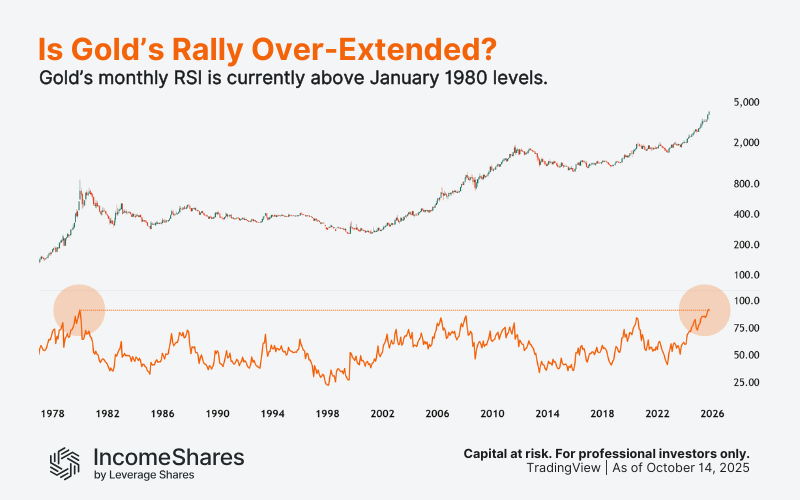
Gold’s relative buyer strength may continue further from here. But historically speaking, it’s likely to cool off at some point.
That could result in gold trading lower or consolidating in a sideways trading range. And in that case, option income may help smooth future returns.
Key takeaways
Gold has approximately doubled since 2024 but does not pay income.
The IncomeShares Gold+ Yield ETP has followed gold’s general direction since inception, while paying monthly income and keeping volatility lower.
If gold cools off or trades sideways, option income may help smooth future returns for gold investors.
Votre capital est exposé à un risque si vous investissez. Vous pouvez perdre la totalité de votre investissement. Veuillez consulter l’avertissement complet sur les risques ici
Produits associé:

Stratégie
Covered call
Rendement des
distributions
12.22%

Stratégie
Covered Call
Rendement des
distributions
12.44%

Stratégie
Covered Call
Rendement des
distributions
12.62%