

Autor
Jonathan Hobbs, CFA
Fecha
30 Sep 2026
Categoría
Education
Income Without Selling Shares: Sequence of Returns Risk
Su capital está en riesgo si invierte. Podría perder toda su inversión. Por favor, consulte la advertencia de riesgos completa aquí.
Sequence of returns risk is the reason two retirees can earn the same average return and end up with very different amounts. The order the returns arrive in makes no difference while you leave the money invested. But it can change the result once you start drawing an income. That’s because each withdrawal comes out of a pot that has either just fallen or risen.
IncomeShares exchange-traded products (ETPs) sell options and aim to pay a monthly income distribution. That's a cash payment to the investors who hold the ETP. This article explains how the order of returns can change what you're left with. It then tests two ways a hypothetical retiree could draw the same cash from long-dated US Treasury bonds: selling shares in a bond ETF, or taking our ETP's distributions.
How sequence of returns risk changes what you end up with
How the sequence changes the result. Suppose you retire with $500,000 and withdraw $20,000 at the end of each year. Over three years, the market returns -20%, +10%, and +25%, respectively. You'd finish with $477,500 here. But if you put the +25% first and the -20% last, you'd finish with $496,400.
Without any withdrawals, both sequences end the three years at exactly $550,000. So the withdrawals are the whole reason for the $18,900 difference. The table below shows the two paths year by year.
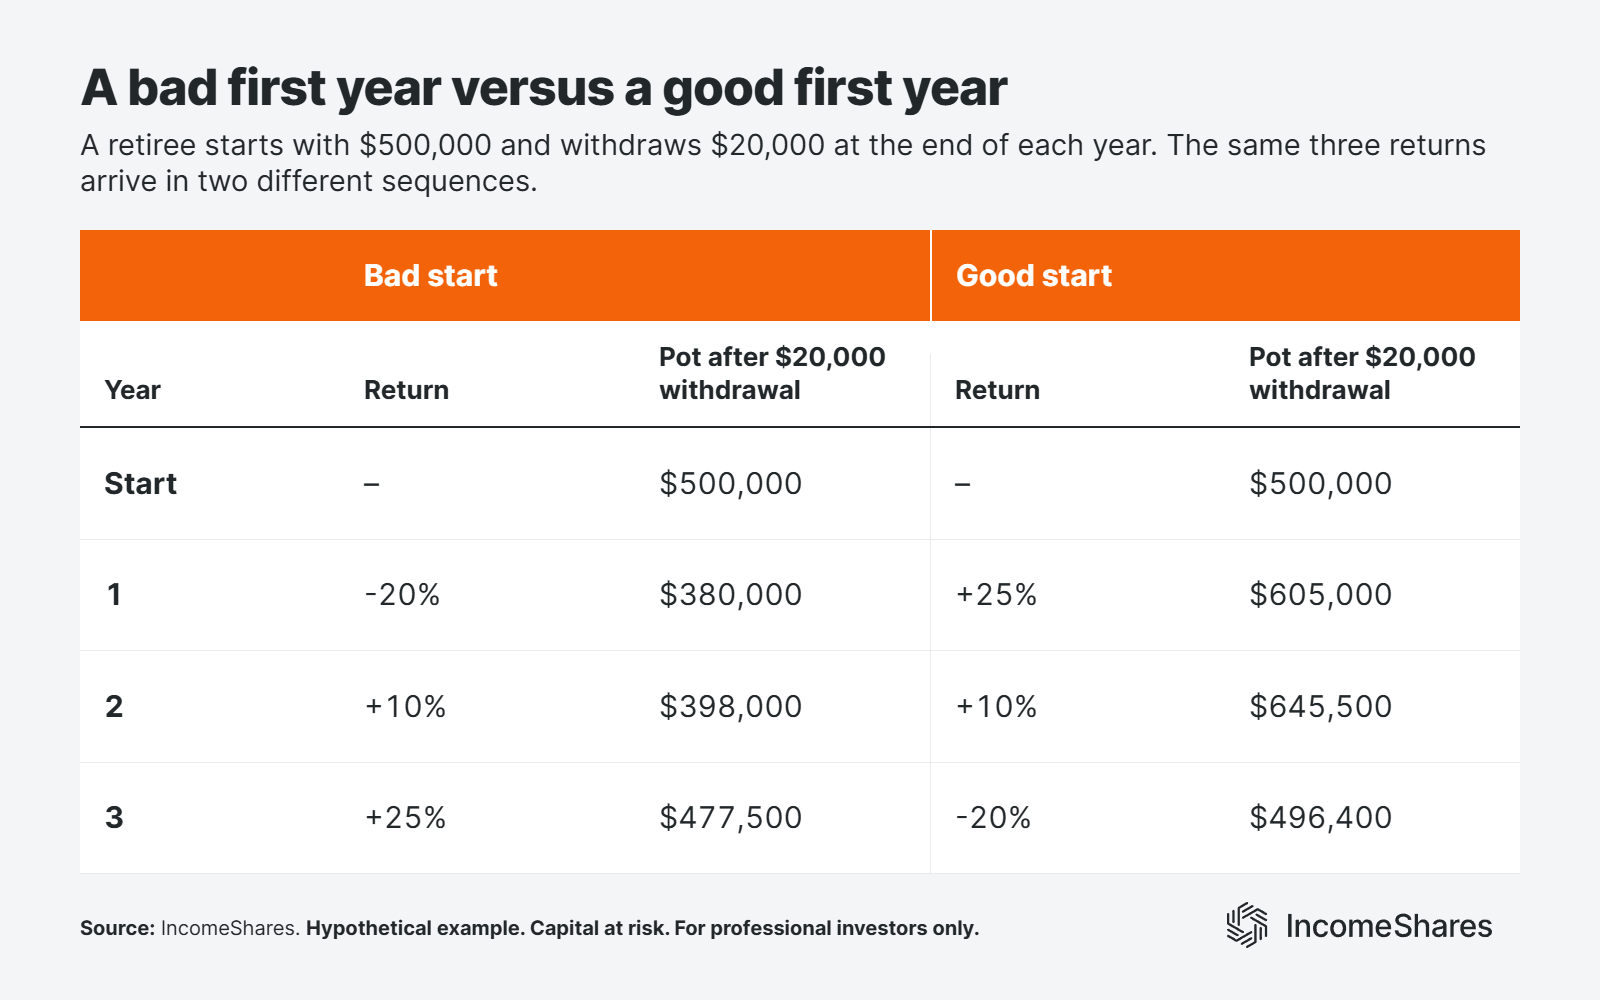
Why a bad start costs more. Each withdrawal after a fall takes a bigger slice of the pot. In the “bad-year first” sequence, the first $20,000 is 5% of $400,000. And in the “good-year first” sequence, that $20,000 withdrawal is 3.2% of $625,000. So the bigger the slice you take after a drop, the less there's left to grow if the market recovers.
What you can control. Nobody can choose the order of returns each year. What you can control is how much of the pot you sell while prices are down. That depends on where your income comes from.
The test: Treasury income in two ways
We ran the test on long-dated US Treasury bonds, because bonds are a common income holding in retirement portfolios. Our 20+ Year Treasury Options ETP (US ticker: TLTY) holds the iShares 20+ Year Treasury Bond ETF (TLT). It then sells call options on those TLT shares. The option buyers pay a fee up front, called a premium. We pool those premiums, plus the interest TLT pays, and aim to pay a monthly income distribution of around 1% of the ETP's net asset value (NAV).
The data runs since launch, from our ETP's first day of trading on 30 June 2025. It ends at the August month end (28 August 2026). Prices and NAVs are daily, from Bloomberg, in US dollars.
What each investor bought. Both investors put in $10,000 on 30 June 2025. The TLT holder buys 113.3 shares at $88.25. Meanwhile, the ETP holder buys 249.2 shares of our ETP at $40.13.
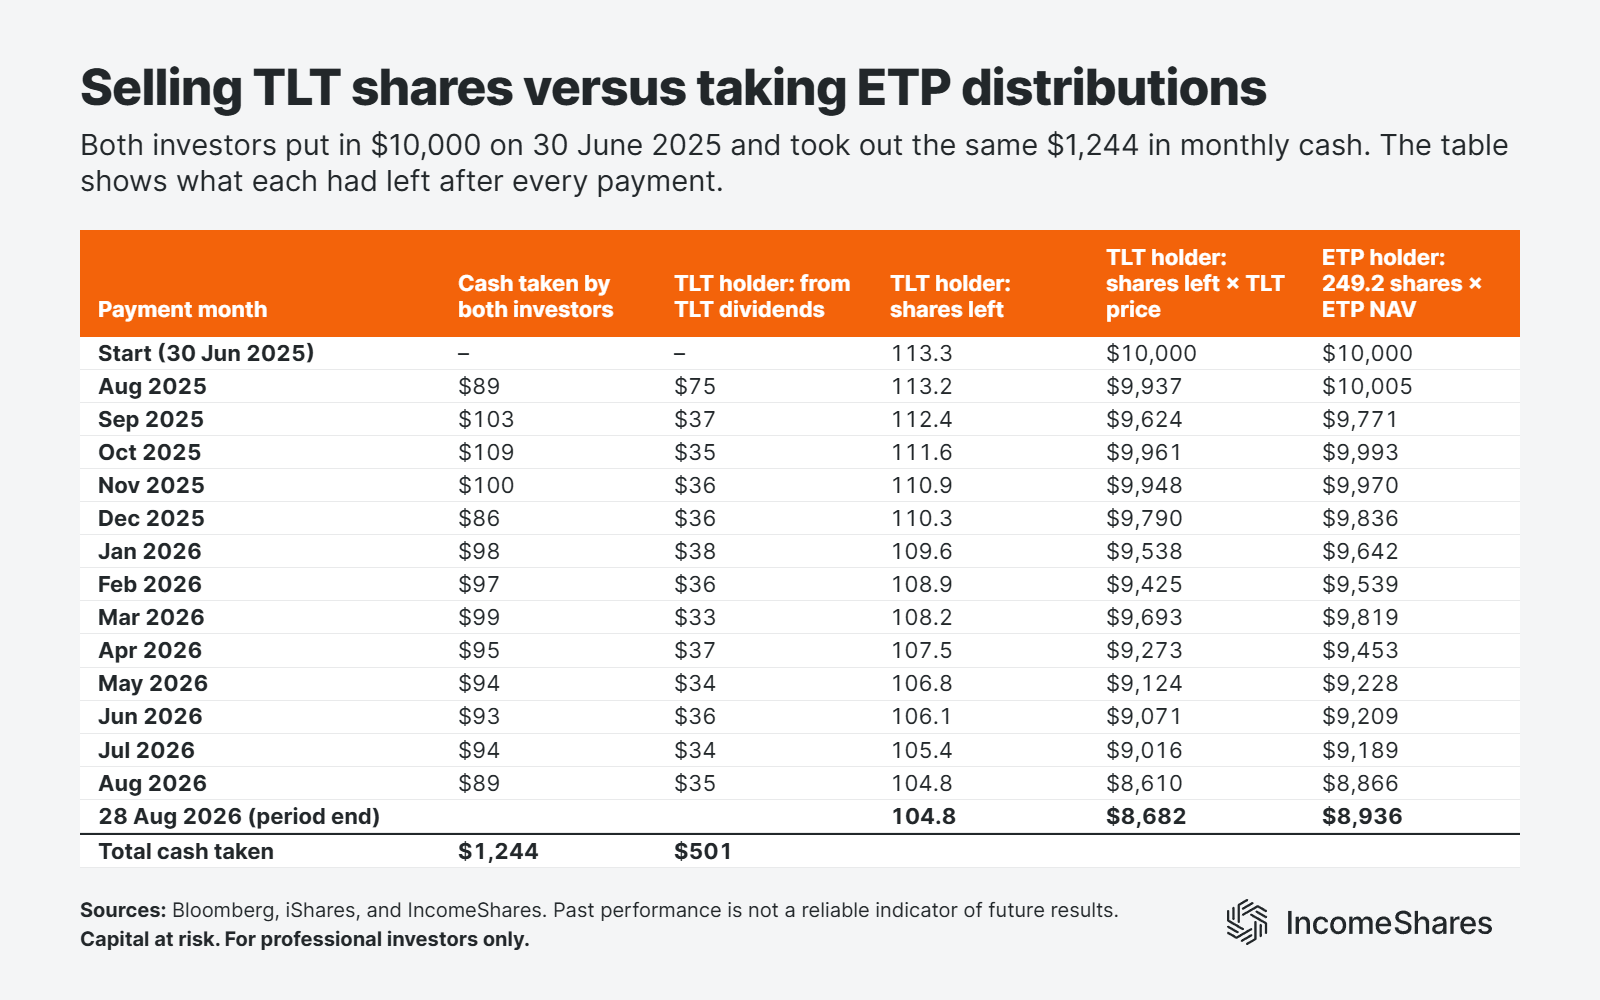
The ETP holder takes each monthly distribution as cash and never sells an ETP share. That came to thirteen payments of between $86 and $109 – or $1,244 in total.
The TLT holder takes out exactly the same cash on those distribution days. TLT's own monthly dividend covers about $37 of it, and they sell TLT shares for the rest. The first withdrawal had two TLT dividends behind it, since TLT paid on 1 July before our ETP's first distribution.
The table below shows the cash each investor took out each month, and what their holding was worth after it.
How the ETP holder finished ahead in this example
The ETP holder kept every share. On 28 August 2026 the ETP holder still had all 249.2 shares, worth $8,936. The TLT holder had sold 8.6 of their 113.3 shares, and the rest were worth $8,682. That's $253 in favour of the ETP holder – after both had taken exactly $1,244 in cash. The chart below shows the two holdings over the whole period.
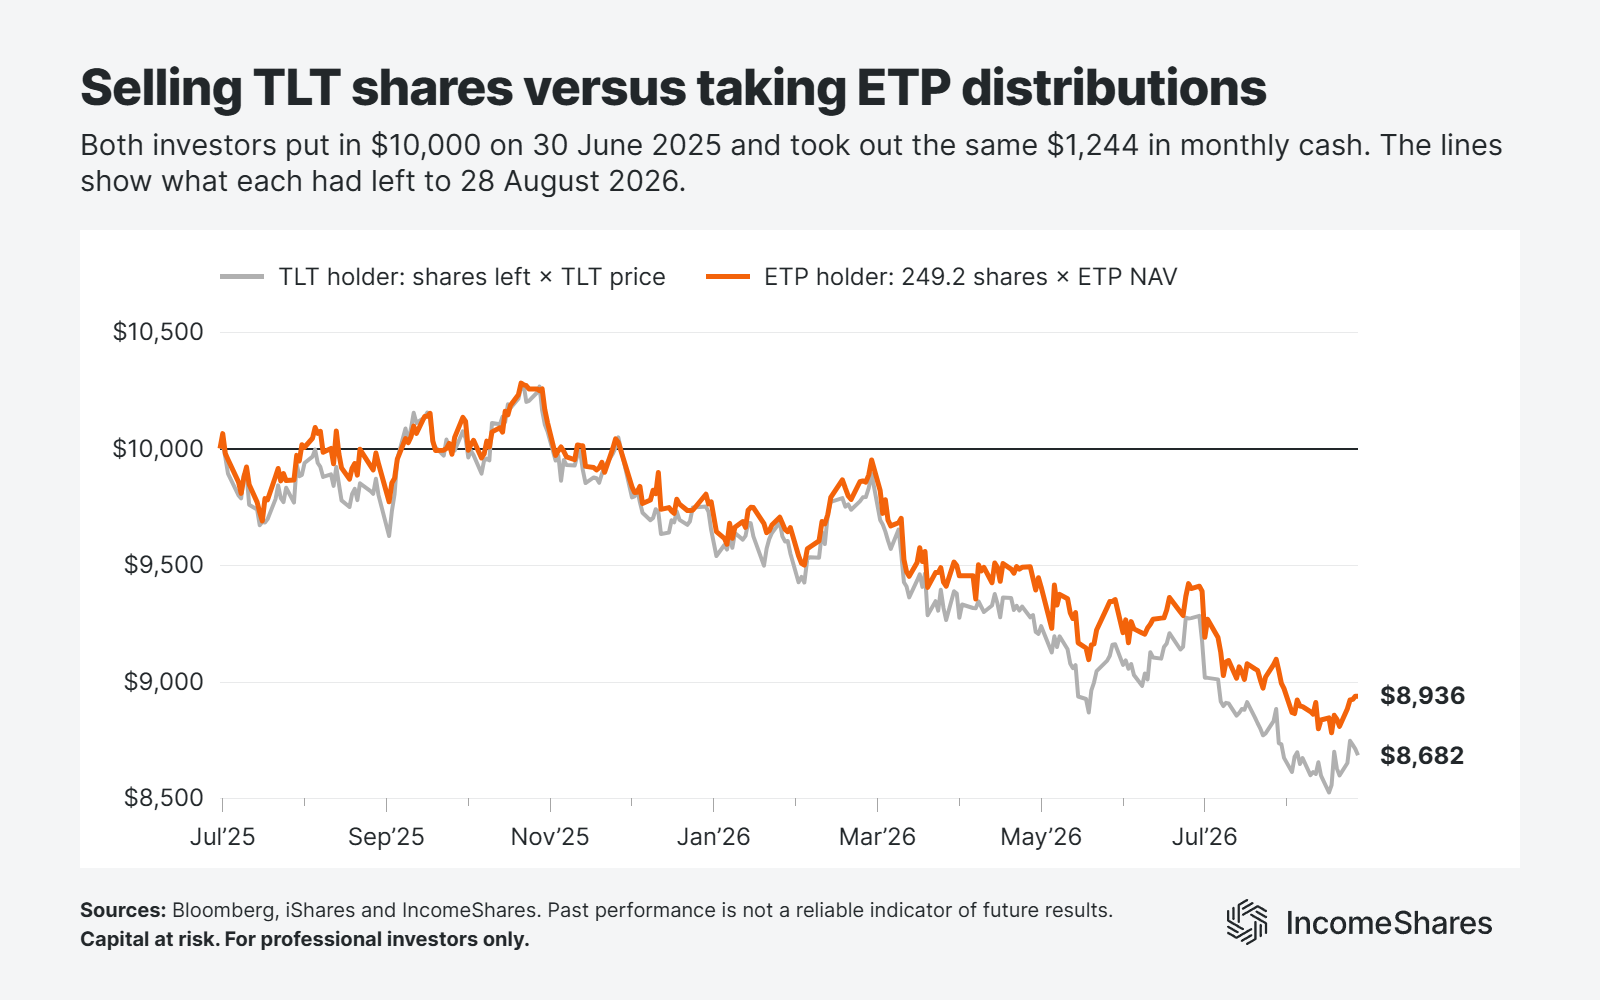
Both holdings lost money. Long-dated Treasuries fell over the period. TLT's price dropped 6.1%, and our ETP's NAV dropped 10.6%. Total return adds back every dividend or distribution as if reinvested. On that basis, TLT returned -1.0% and our ETP +1.7%.
Counting the income, the ETP lost less at the worst point. TLT's largest fall from its peak was 8.4%, against 6.3% for our ETP, both on a total return basis. The ETP holder's relative lead peaked at $320 on 17 August 2026, near TLT's low. A smaller fall while you're taking money out is what reduces sequence of returns risk. The premiums our ETP collected are why it lost less here.
A few caveats to keep in mind
Distributions come out of the pot. Our ETP's NAV fell further than TLT's price because each distribution is paid out of the NAV. So taking income instead of selling shares doesn't protect the pot by itself. The ETP holder came out ahead because the premiums more than covered that difference – not because they avoided selling.
A cap on rallies. By selling call options, our ETP may give up part of any rise in TLT above the strike price. Treasuries didn't rally in this period, so that cost didn't show. It did during gold's rally, when the covered call upside cap cost our Gold+ Yield ETP part of the move.
The income isn't fixed. Our distributions may vary from month to month, so the cash a holder receives can change too.
Key highlights
Sequence of returns risk only changes your result once you're taking money out. A bad start costs more because each withdrawal takes a bigger slice of a smaller pot.
Taking distributions instead of selling shares doesn't protect the pot by itself. Each distribution comes out of the NAV, just as a sale comes out of a holding.
What reduces sequence of returns risk is losing less while you're drawing an income. Option premiums may help with that, but they can also cost you part of a rally.
Su capital está en riesgo si invierte. Podría perder toda su inversión. Por favor, consulte la advertencia de riesgos completa aquí.
Productos Relacionados:

Estrategia
Covered Call
Rendimiento de
Distribución
12.00%