

Author
Jonathan Hobbs, CFA
Date
24 Jul 2026
Category
Education
Covered Call Upside Cap: Two Markets, Two Results
Your capital is at risk if you invest. You could lose all your investment. Please see the full risk warning here.

Gold rallied aggressively from mid-2024 into early 2026, then pulled back from its peak. Meanwhile, long-dated US Treasury bonds have traded sideways. Two of our exchange-traded products run a covered call strategy on those markets: Gold+ Yield (GLDI) and 20+ Year Treasury Options (TLTY). This article explains why the covered call upside cap cost more in a bull market than a range-bound one.
How the covered call upside cap works
Our covered call ETPs hold an underlying asset and sell call options on it. Selling those options creates income potential, which is the point of the strategy. But that income can come with a cost: capped upside in strong rallies.
Each call option gives the buyer the right to any gains above a fixed price, called the strike price. Say the asset trades at $100 and we sell a call option with a strike price of $110. If the asset then rises to $120, we keep only the first $10 worth of gains. We don't get the last $10, because we effectively sell the asset at $110.
That's the upside cap. Everything above the strike price goes to the call option buyer, however far the rally runs.
But in a range-bound market, we typically have less upside to give away. The asset doesn't run above the strike price as often – or as far.
Example 1: covered calls through a gold bull market
We launched the IncomeShares Gold+ Yield ETP (GLDI) on 23 July 2024. It runs a covered call strategy on SPDR® Gold Shares (GLD), the largest gold-backed ETF.
The chart below shows how the two compare, from launch to 30 June 2026.
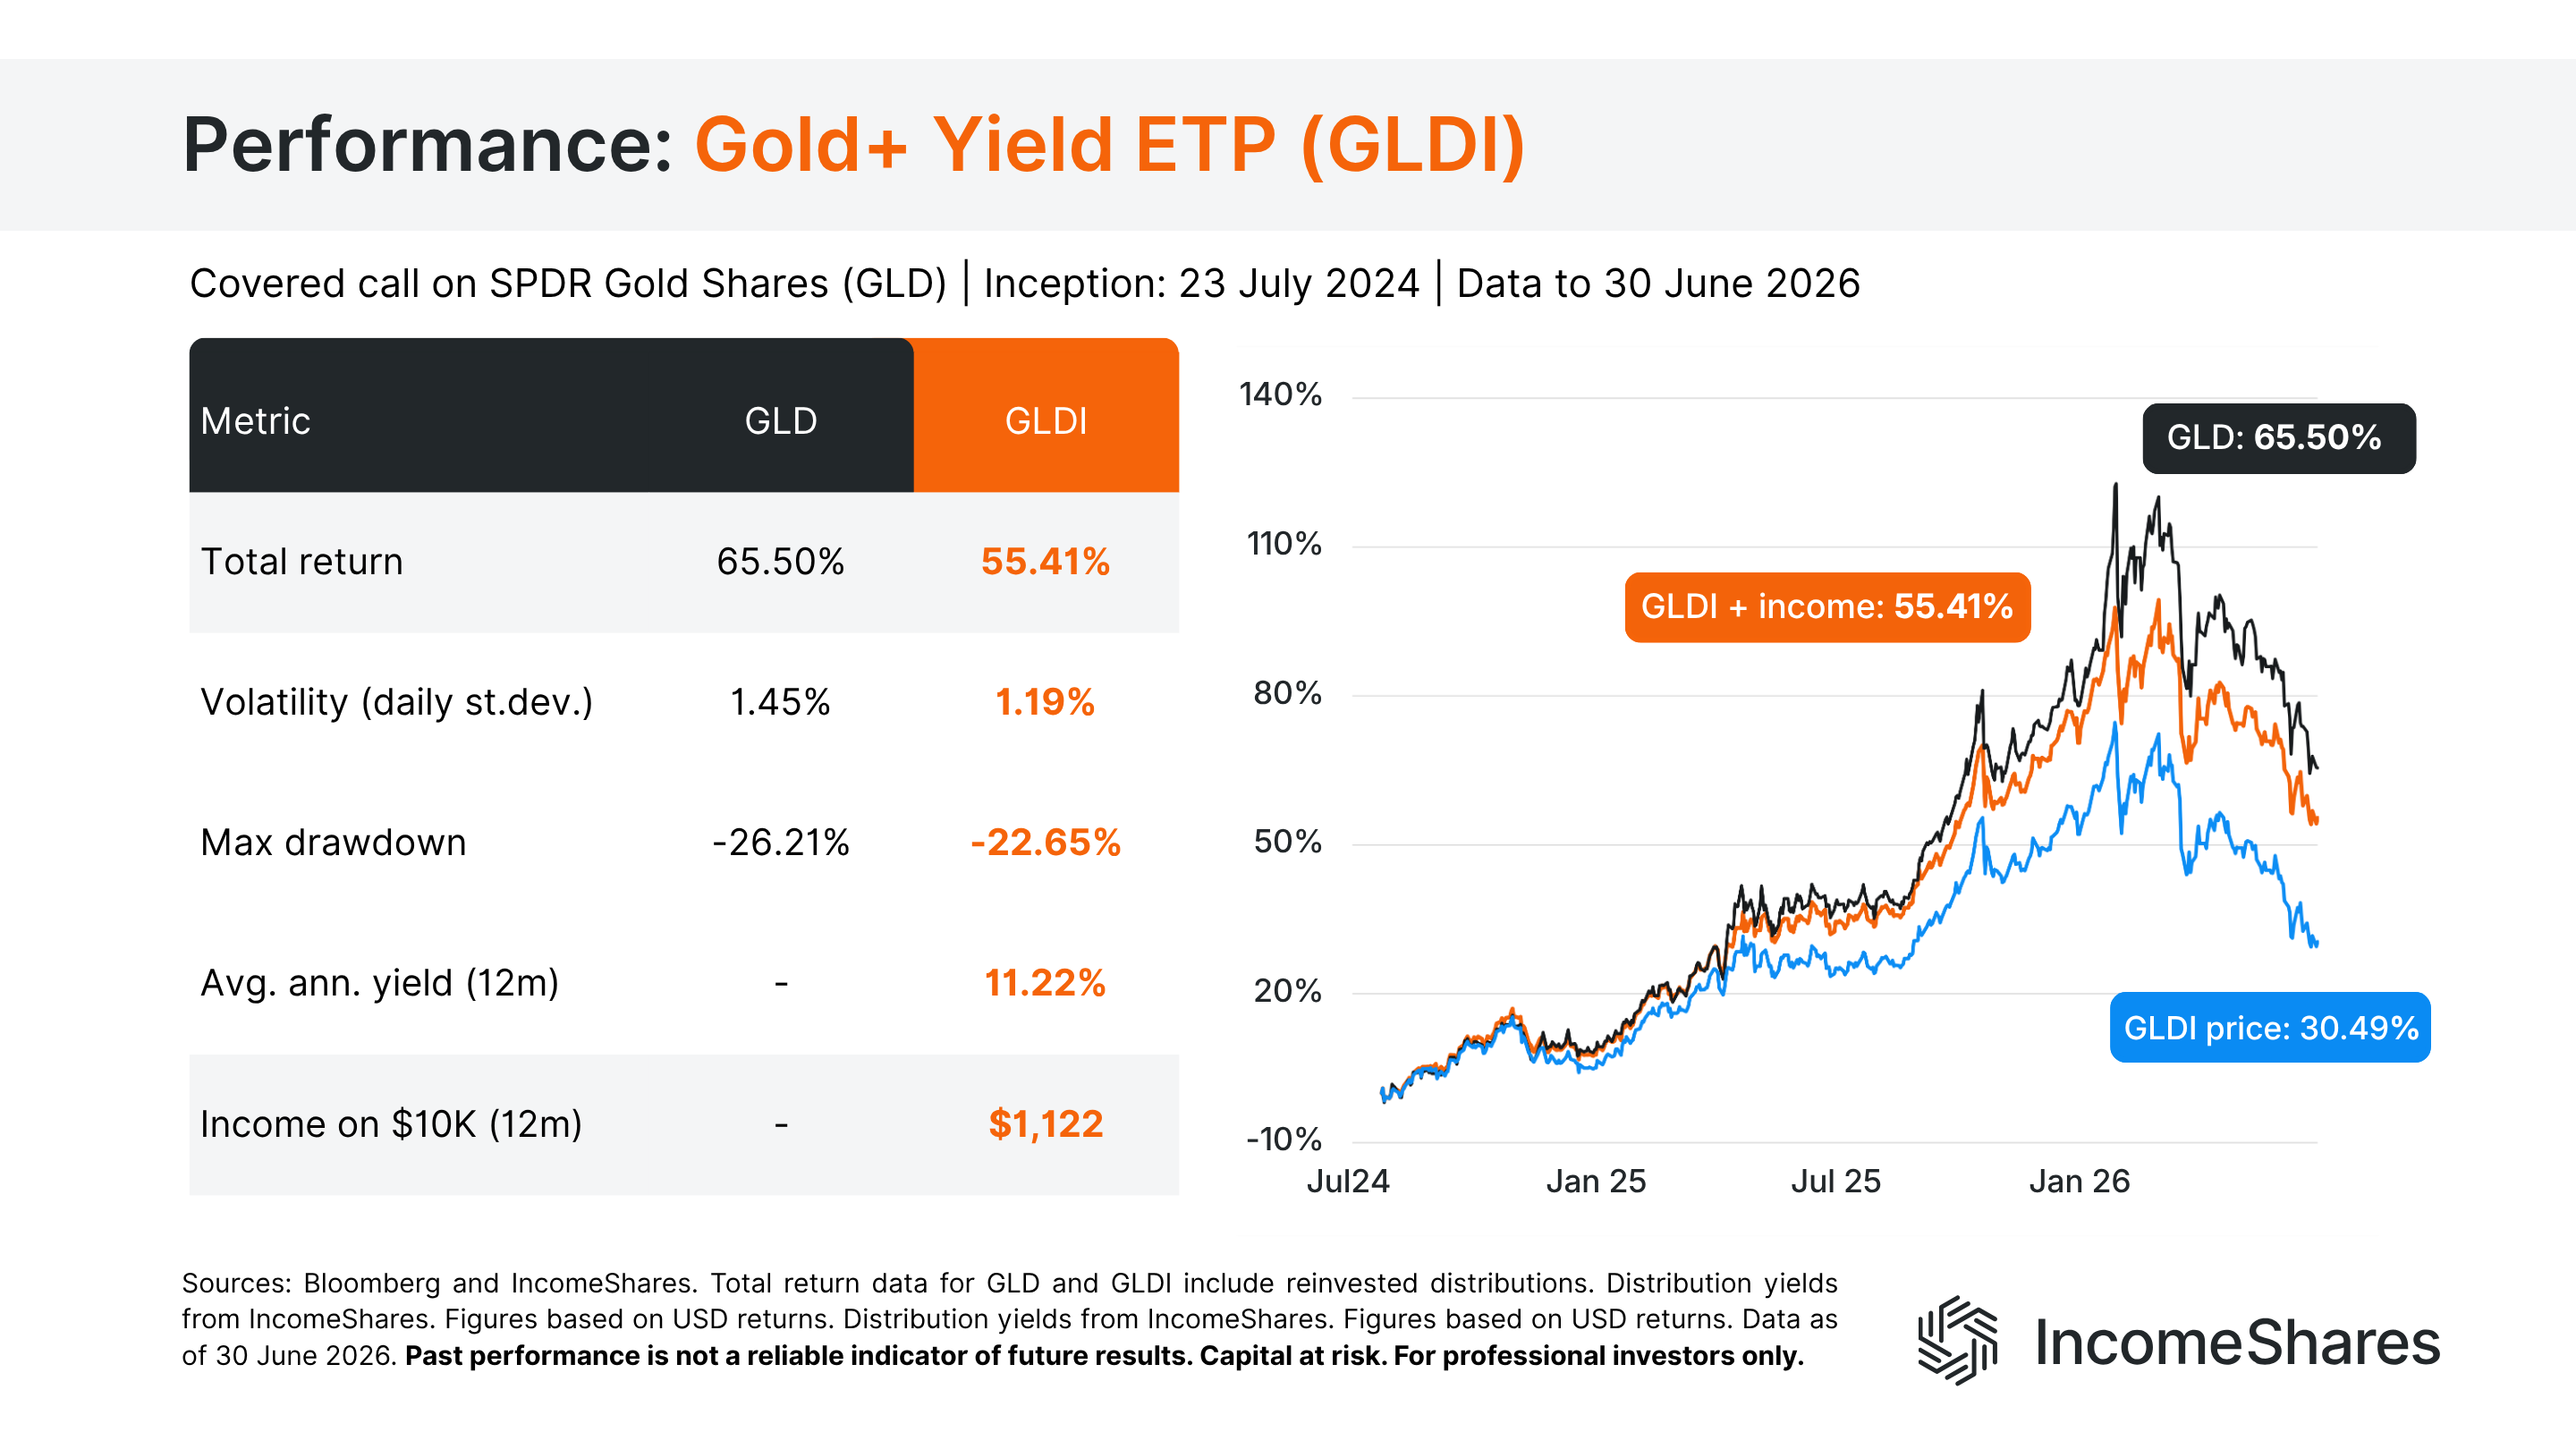
GLD returned 65.50% over that period (black line), while GLDI returned 55.41% with income reinvested (orange line). The blue line shows GLDI's price alone, up 30.49%, which leaves out every distribution we paid. That distance between blue and orange is the difference between price return (without income) and total return (with income reinvested).
So GLDI trailed GLD, which is what the cap does when an asset climbs. It still captured much of the move, with less day-to-day movement than gold itself. Its daily volatility was 1.19% against 1.45%. Over the most recent twelve months it paid an average annualised yield of 11.22%.
The chart also shows when the cap hurt performance the most. The black and orange lines ran furthest apart at the start of 2026, when gold peaked. They’ve moved a bit closer together since then, as gold pulled back and the strategy kept collecting options income.
Example 2: covered calls in a range-bound market
We launched the IncomeShares 20+ Year Treasury Options ETP (TLTY) on 27 June 2025. It runs the same covered call strategy on the iShares 20+ Year Treasury Bond ETF (TLT). TLT holds US Treasury bonds with more than 20 years left to maturity.
Those bonds mostly traded sideways over that year. The next chart shows the same three lines, from launch to 30 June 2026.
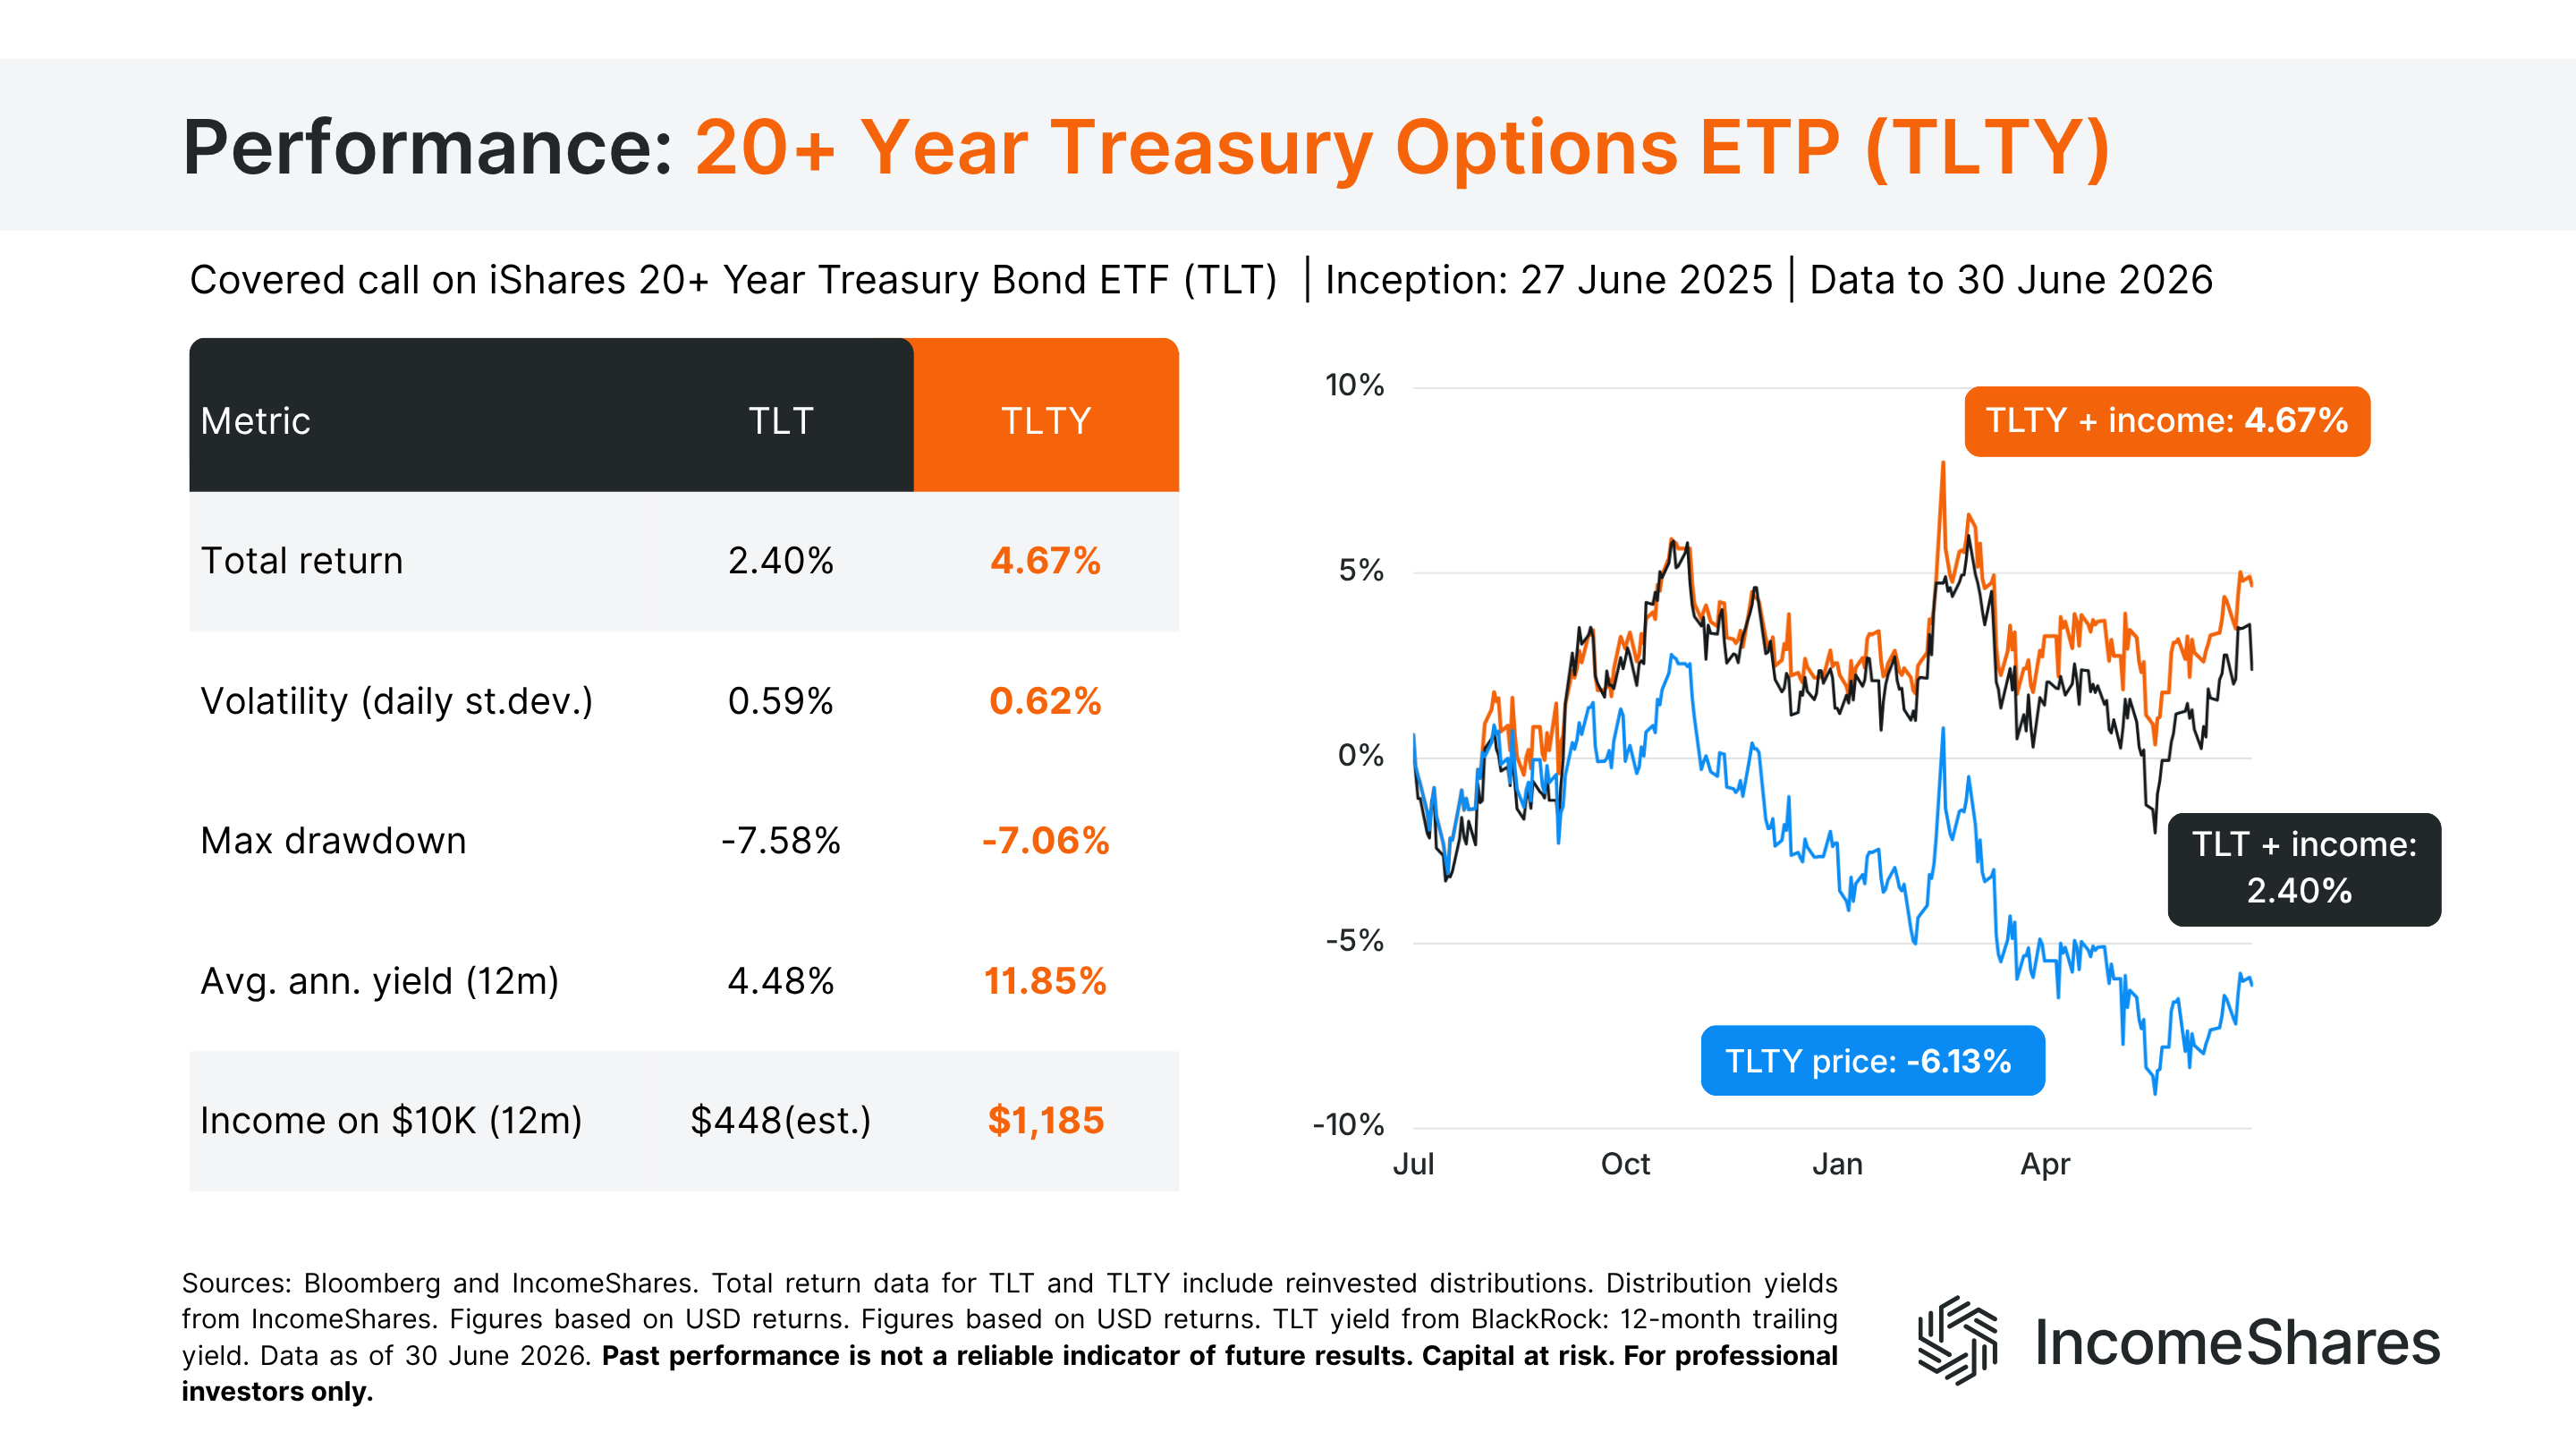
TLT returned 2.40% (black line) with income reinvested. TLTY returned 4.67% with income reinvested (orange line), while the blue line shows its price alone, down 6.13%.
TLTY had a higher total return over the period. In a range-bound market there was very little upside to give away, so the income from selling call options outweighed it. TLTY paid an average annualised yield of 11.85% against 4.48% for TLT.
The risk figures were mixed this time. TLTY's maximum drawdown, the worst fall from a peak to the following low, was shallower at 7.06% against 7.58%. But its daily volatility came in slightly higher, at 0.62% against 0.59%.
What the two show side by side
The premium is payment for the upside we agree to sell. What that upside turns out to be worth depends on the market – and nobody knows that in advance. Through the gold rally it was worth a lot, and GLDI gave up some of the move. In a range-bound Treasury market it wasn’t worth much.
The two ETPs launched at different times and cover different periods, so we measure each one against its own underlying asset. Each set of figures describes the market it ran through, and market conditions may change.
Three things to remember
The covered call upside cap has cost most in a bull market and least in a range-bound one. The strike price is fixed, so the further an asset runs past it, the more of the rally we give away.
Price and total return tell different stories. Both ETPs paid income out along the way, which pulls the price line below the total return line.
Covered calls may reduce drawdowns without reducing day-to-day movement. Both measures are worth checking rather than assuming one follows the other.
Your capital is at risk if you invest. You could lose all your investment. Please see the full risk warning here.
Related Products:

Strategy
Covered Call
Distribution Yield
12.47%

Strategy
Covered Call
Distribution Yield
11.83%

Strategy
Covered Call
Distribution Yield
13.49%