

Auteur
Jonathan Hobbs, CFA
Date
20 Nov 2026
Catégorie
Market Insights
Yield vs NAV: Why a Lower Yield Can Pay More Income
Votre capital est exposé à un risque si vous investissez. Vous pouvez perdre la totalité de votre investissement. Veuillez consulter l’avertissement complet sur les risques ici
The distribution yield on an options income exchange-traded product (ETP) is a percentage of its net asset value (NAV). So mathematically, your income in dollars depends on the NAV as well as the percentage yield. This article uses hypothetical examples to explain yield vs NAV – and how a lower yield could actually lead to more income over time.
Yield vs NAV: what a distribution yield pays in dollars
An options income ETP sells options, and the option buyers pay it a fee up front (premium). That premium goes towards the monthly income distributions (cash payments) the ETP aims to pay its investors. The NAV is the value of the ETP’s investments at a given time. Dividing that NAV by the number of shares gets you the NAV per share.
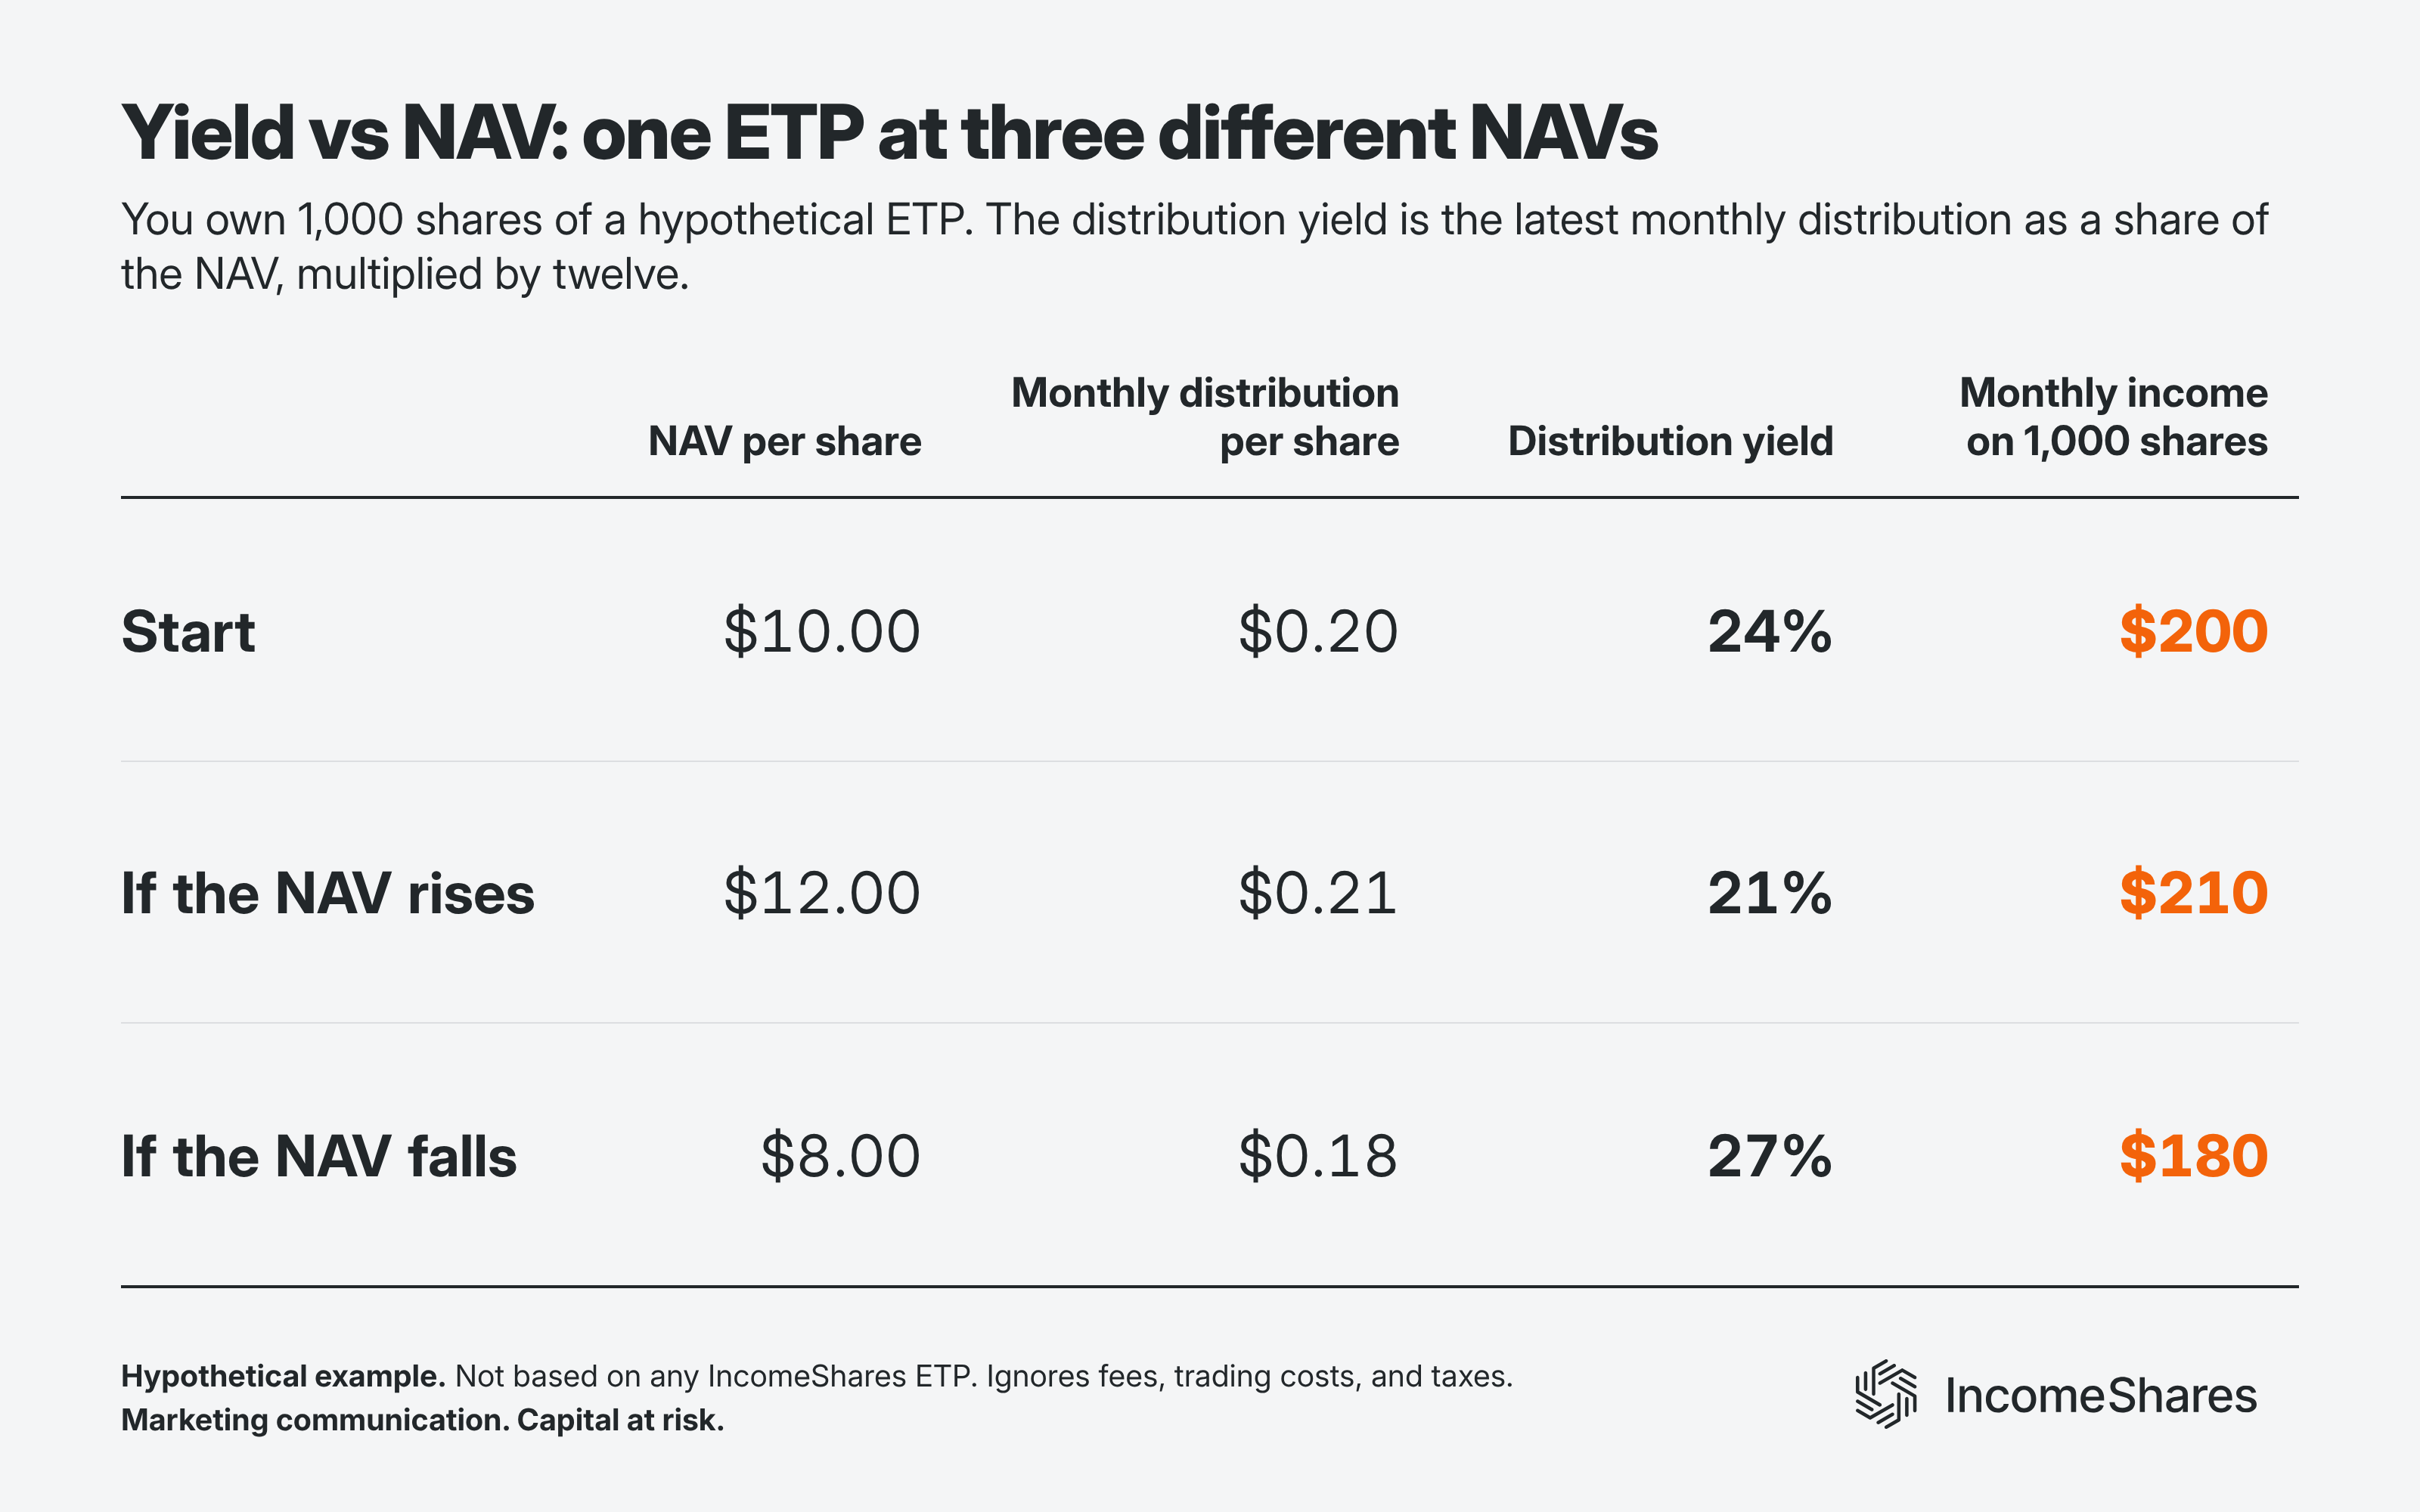
Say you own 1,000 shares of a hypothetical ETP, and its NAV is $10.00 per share. The ETP pays a monthly income distribution of $0.20 per share. That’s 2% of the NAV ($0.20 ÷ $10.00). Multiply that by twelve, and you get a 24% annualised distribution yield.
Your income for that month is then $200 on your initial $10,000 investment. From there, the NAV and monthly distribution could both change:
If the NAV rises to $12.00 and the distribution rises to $0.21: the yield falls to 21%. But your monthly income rises to $210.
If the NAV falls to $8.00 and the distribution falls to $0.18: the yield rises to 27%. But your monthly income falls to $180.
So here, the lowest of the three yields pays the most dollar income – and the highest yield pays the least. The table below shows the three yields side by side.
Example: an 18% yield vs a 12% yield over 10 years
Now suppose you invest $10,000 in each of two hypothetical ETPs, and both pay you income every month. To keep the example simple, each ETP’s yield and yearly NAV change stay the same for ten years. Also assume you take each month’s income as cash without reinvesting it. And the example ignores fees, trading costs, and taxes.
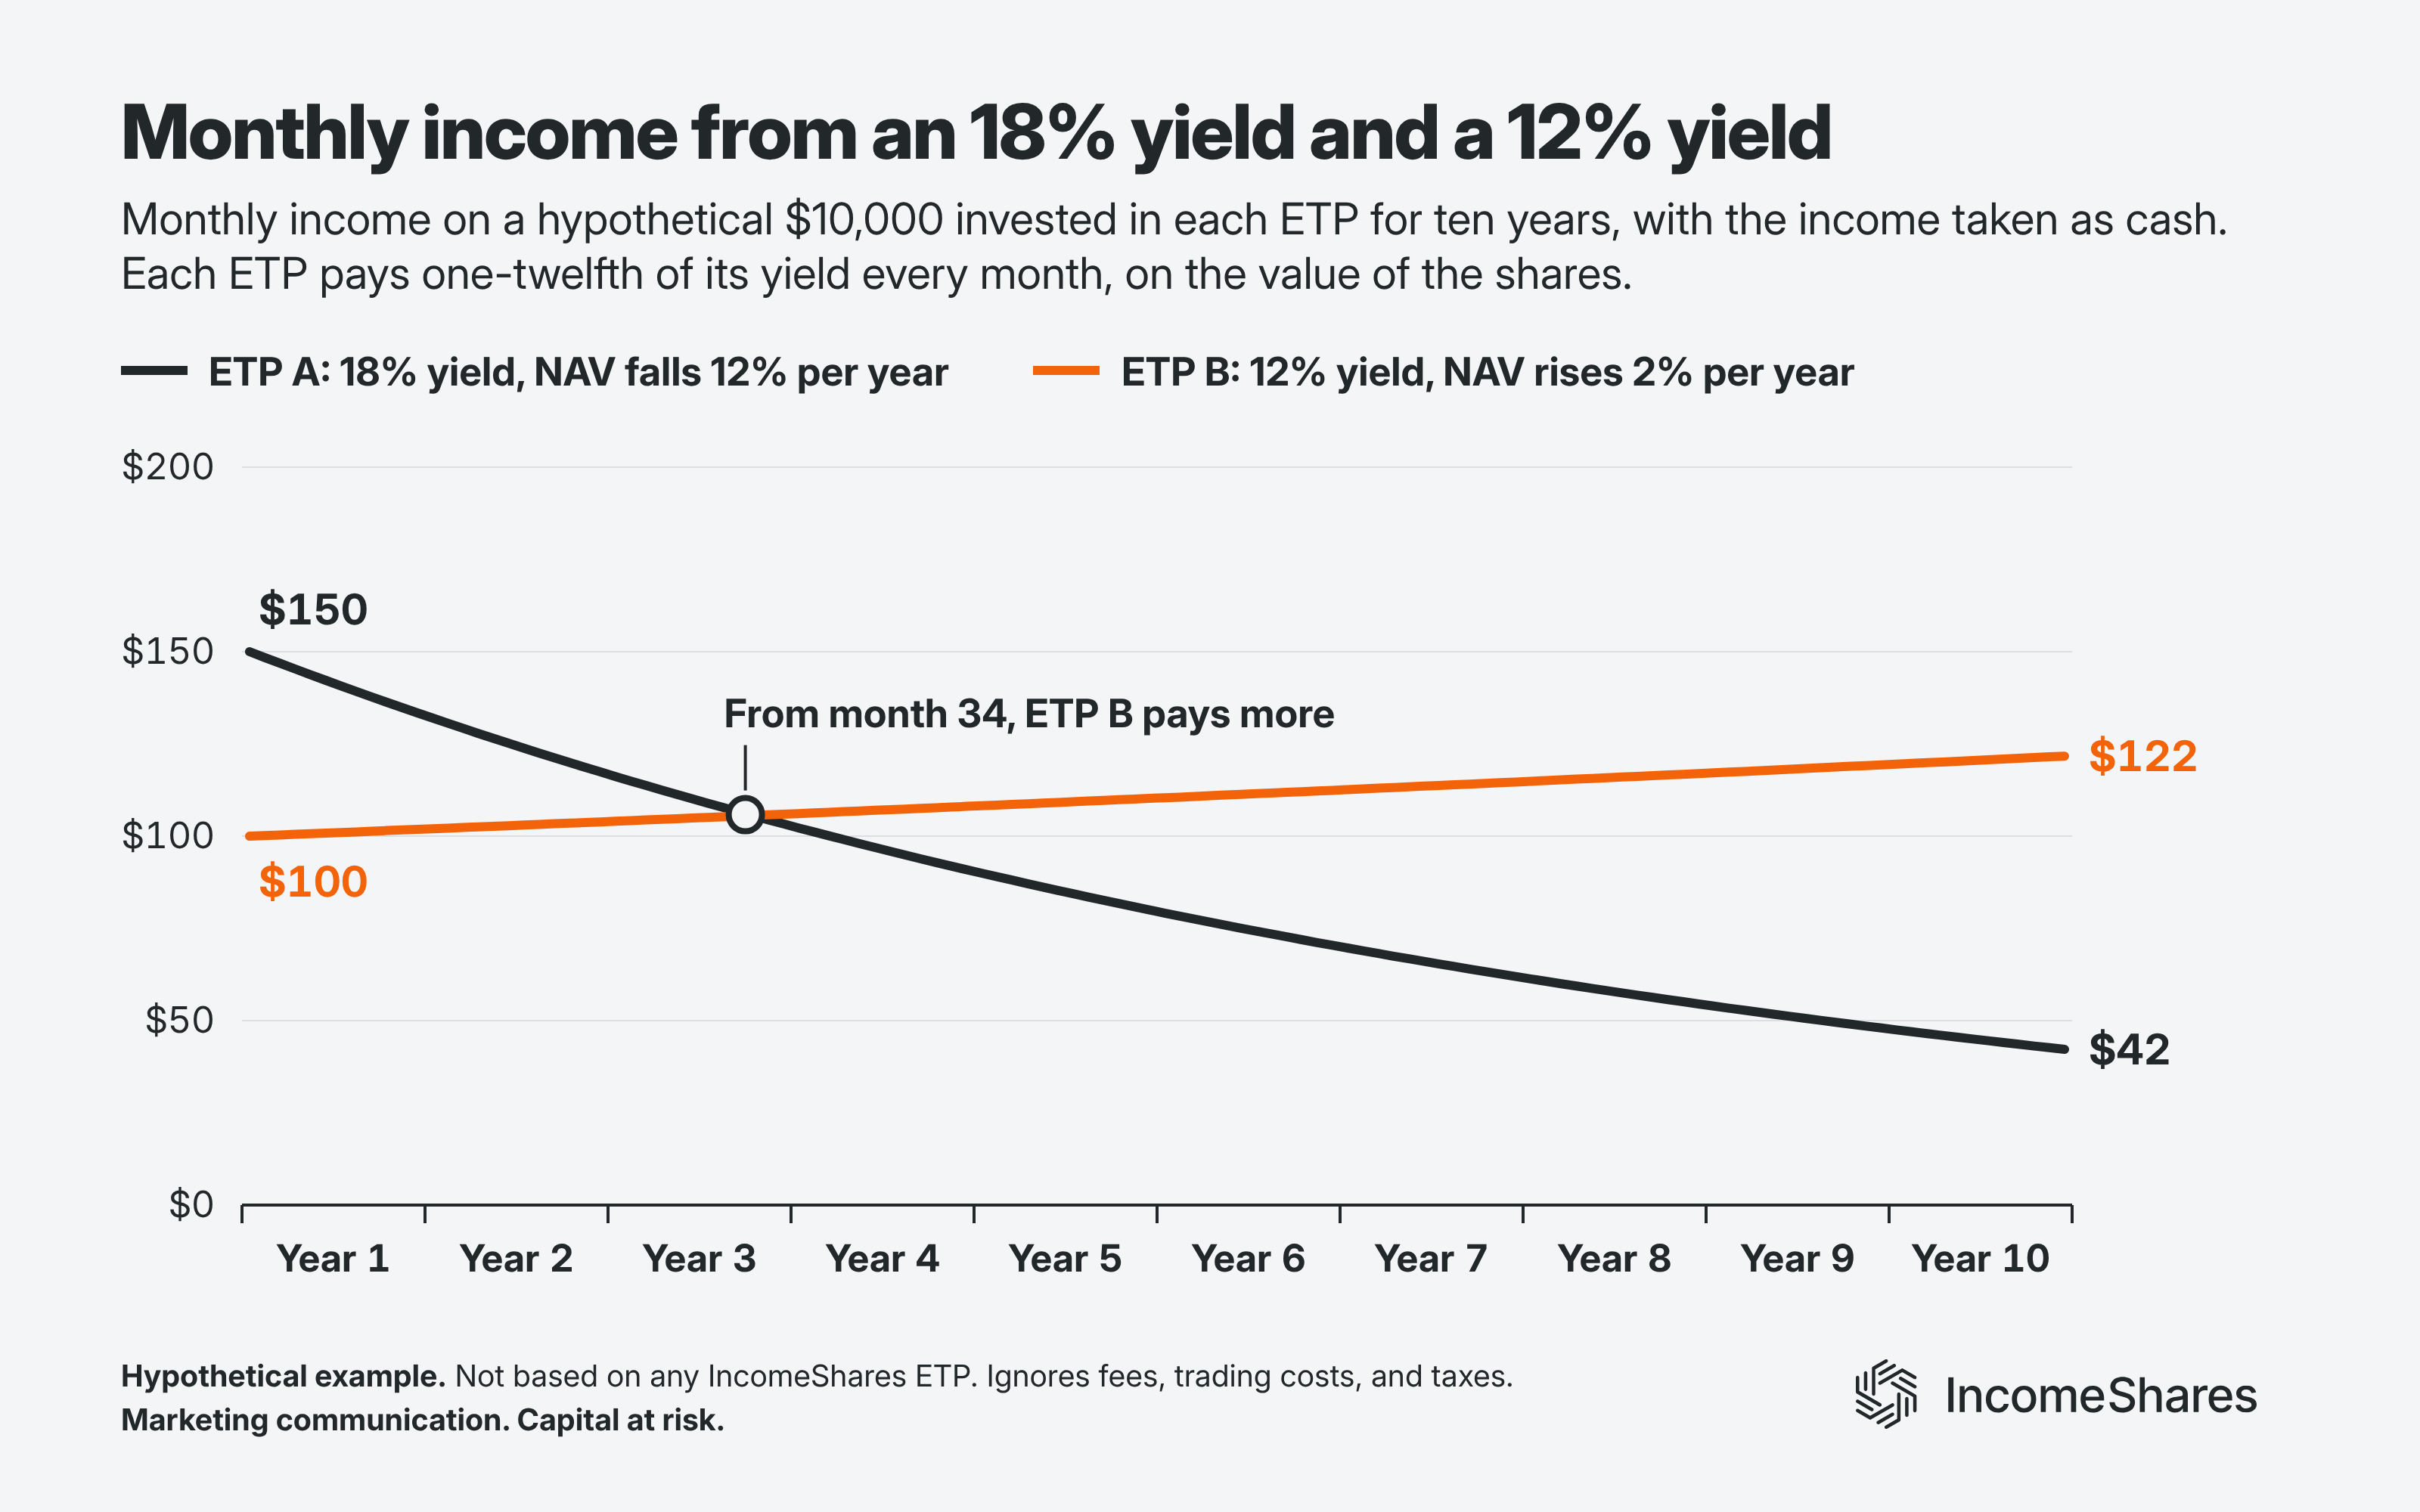
ETP A has an 18% distribution yield, and its NAV falls 12% per year. It pays you $150 in the first month. But its income shrinks with its NAV, to $42 in the last month.
ETP B has a 12% distribution yield, and its NAV rises 2% per year. It pays you $100 in the first month. Its income grows with its NAV, to $122 in the last month.
Partway through year three, ETP B starts to pay you more dollars of income each month than ETP A – even though it has a lower percentage yield. The chart below shows the monthly income from each ETP.
Income plus the value of your shares after 10 years
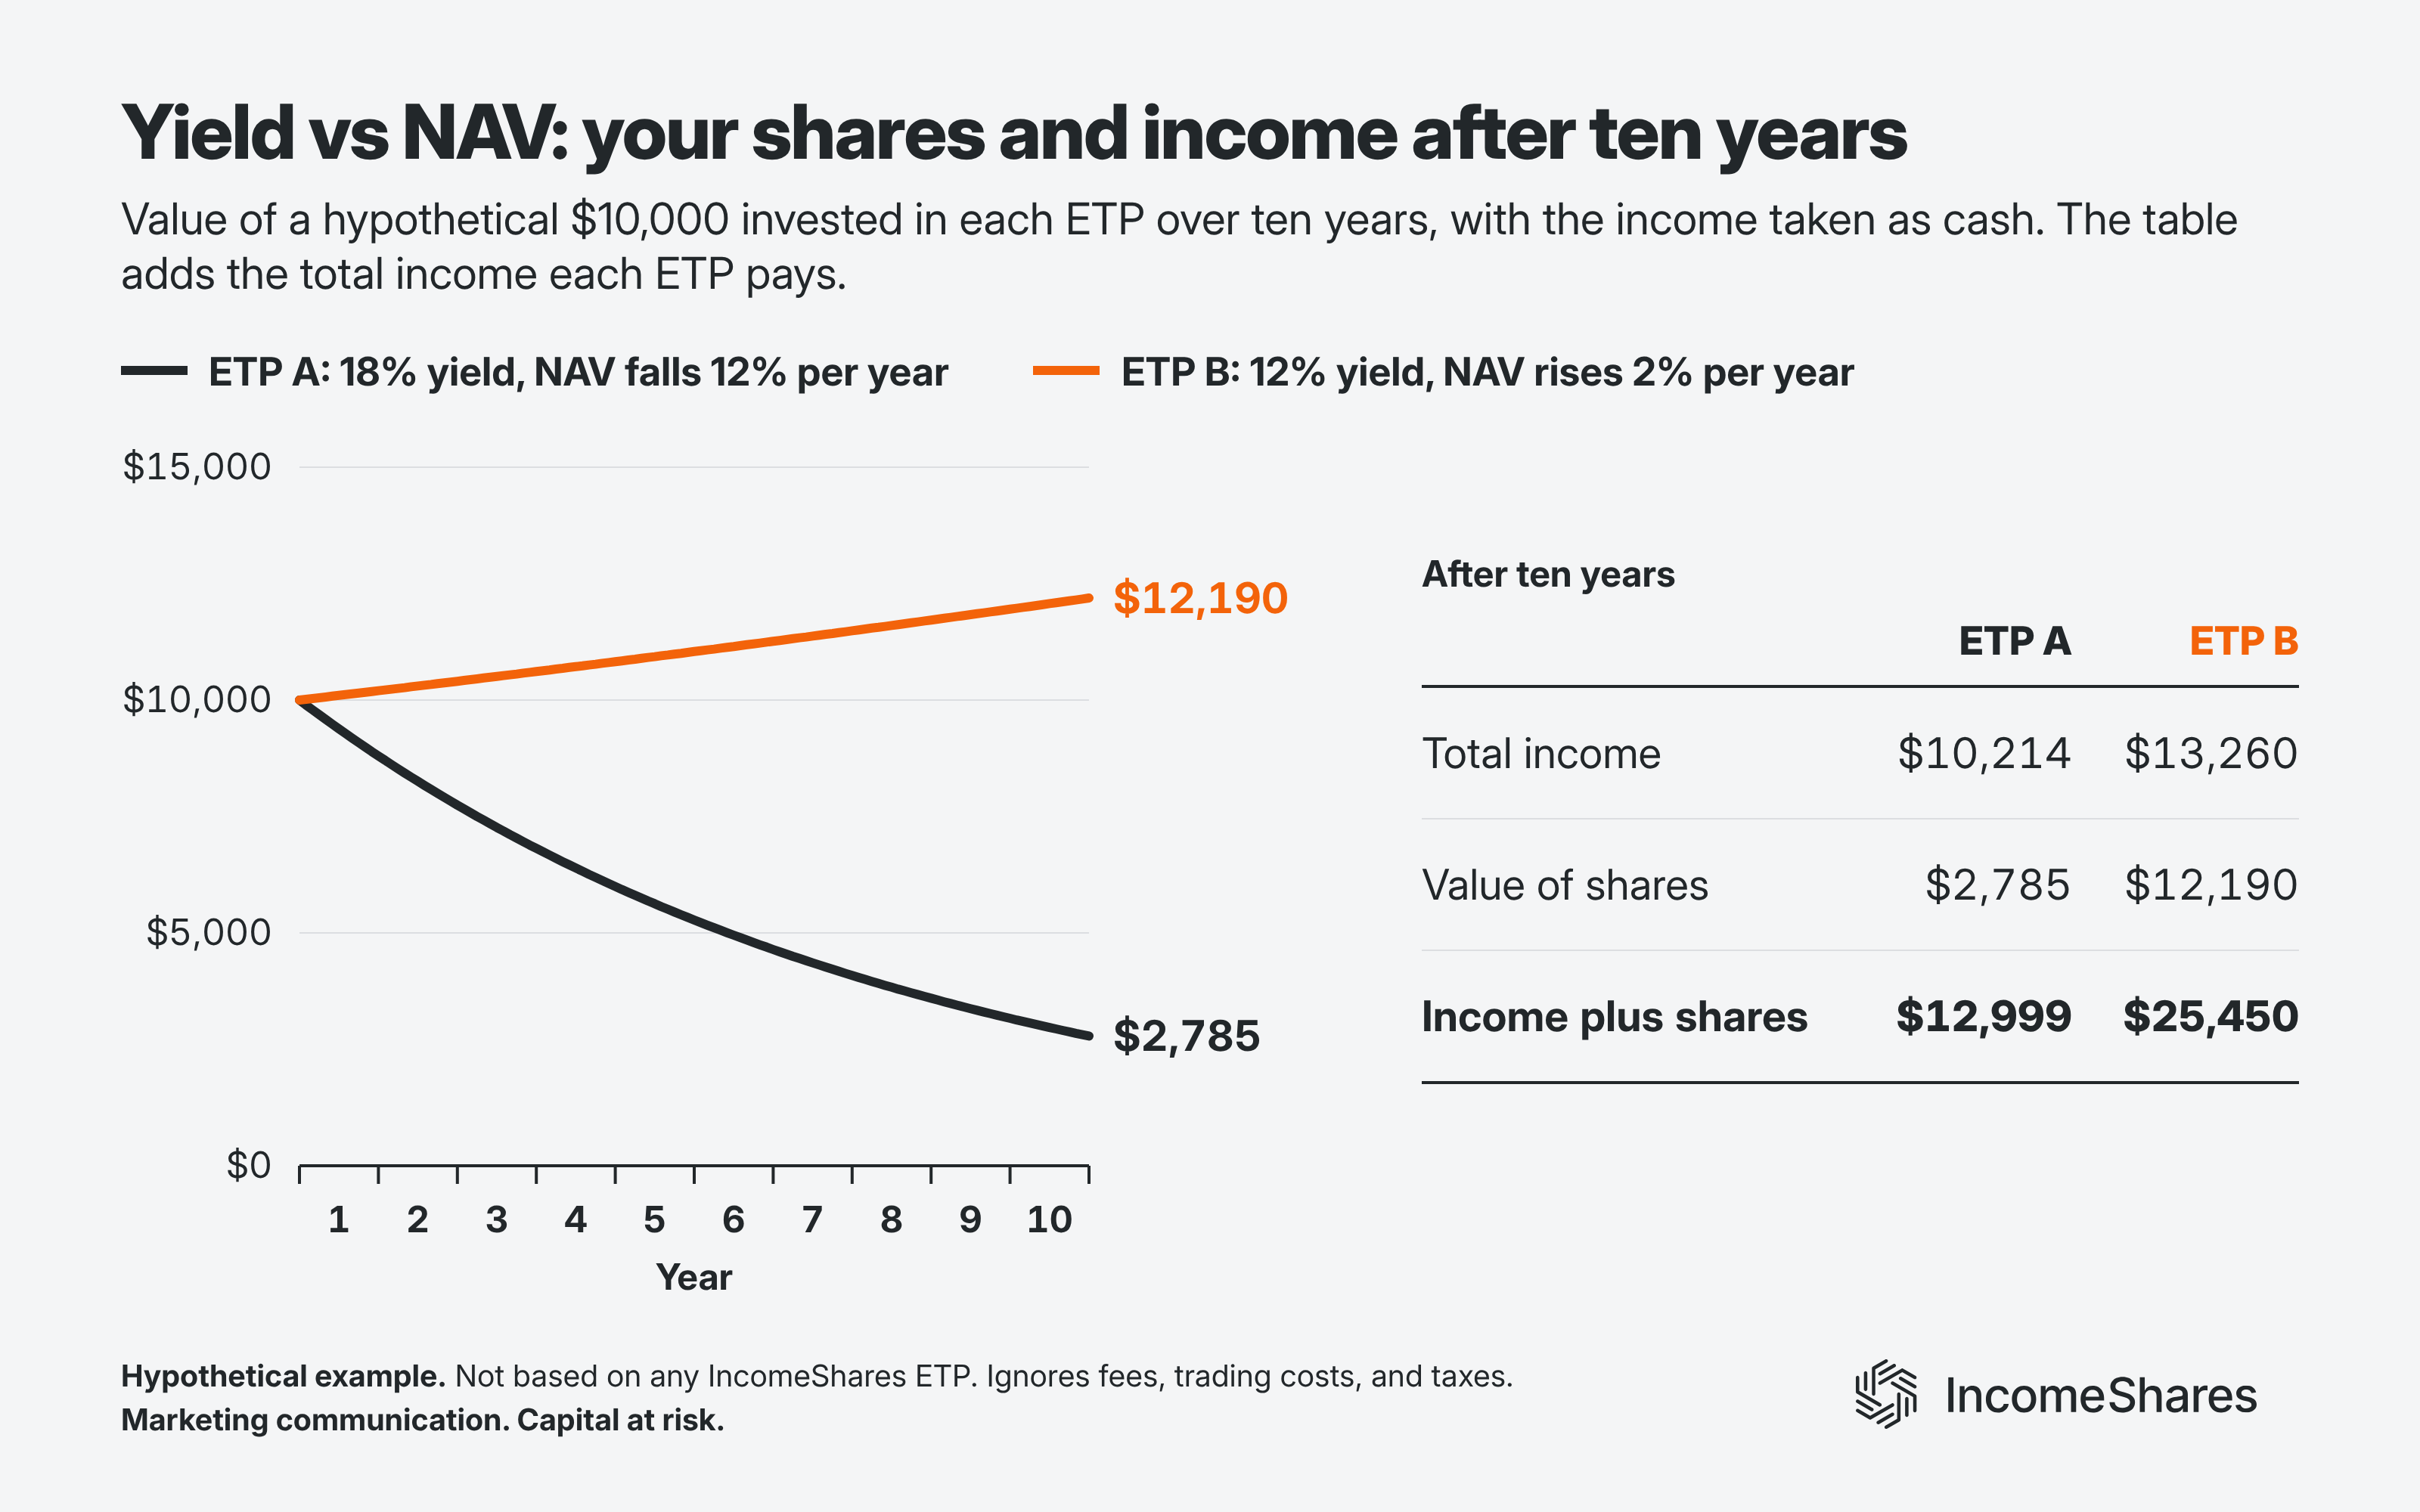
Income is only part of what you end up with – the rest is the value of your shares.
ETP A pays you $10,214 of income over the ten years. But your ETP A shares end up worth only $2,785.
ETP B pays you $13,260 of income over the ten years. And your ETP B shares end up worth $12,190.
Income plus the value of the shares comes to $12,999 with ETP A and $25,450 with ETP B. The chart below shows the value of your shares over the ten years.
The same example with the income reinvested
Now suppose you reinvest every distribution in the same ETP instead. You own more shares over time, so your monthly income grows in both ETPs here. The numbers are still hypothetical, and ignore fees, trading costs, and taxes.
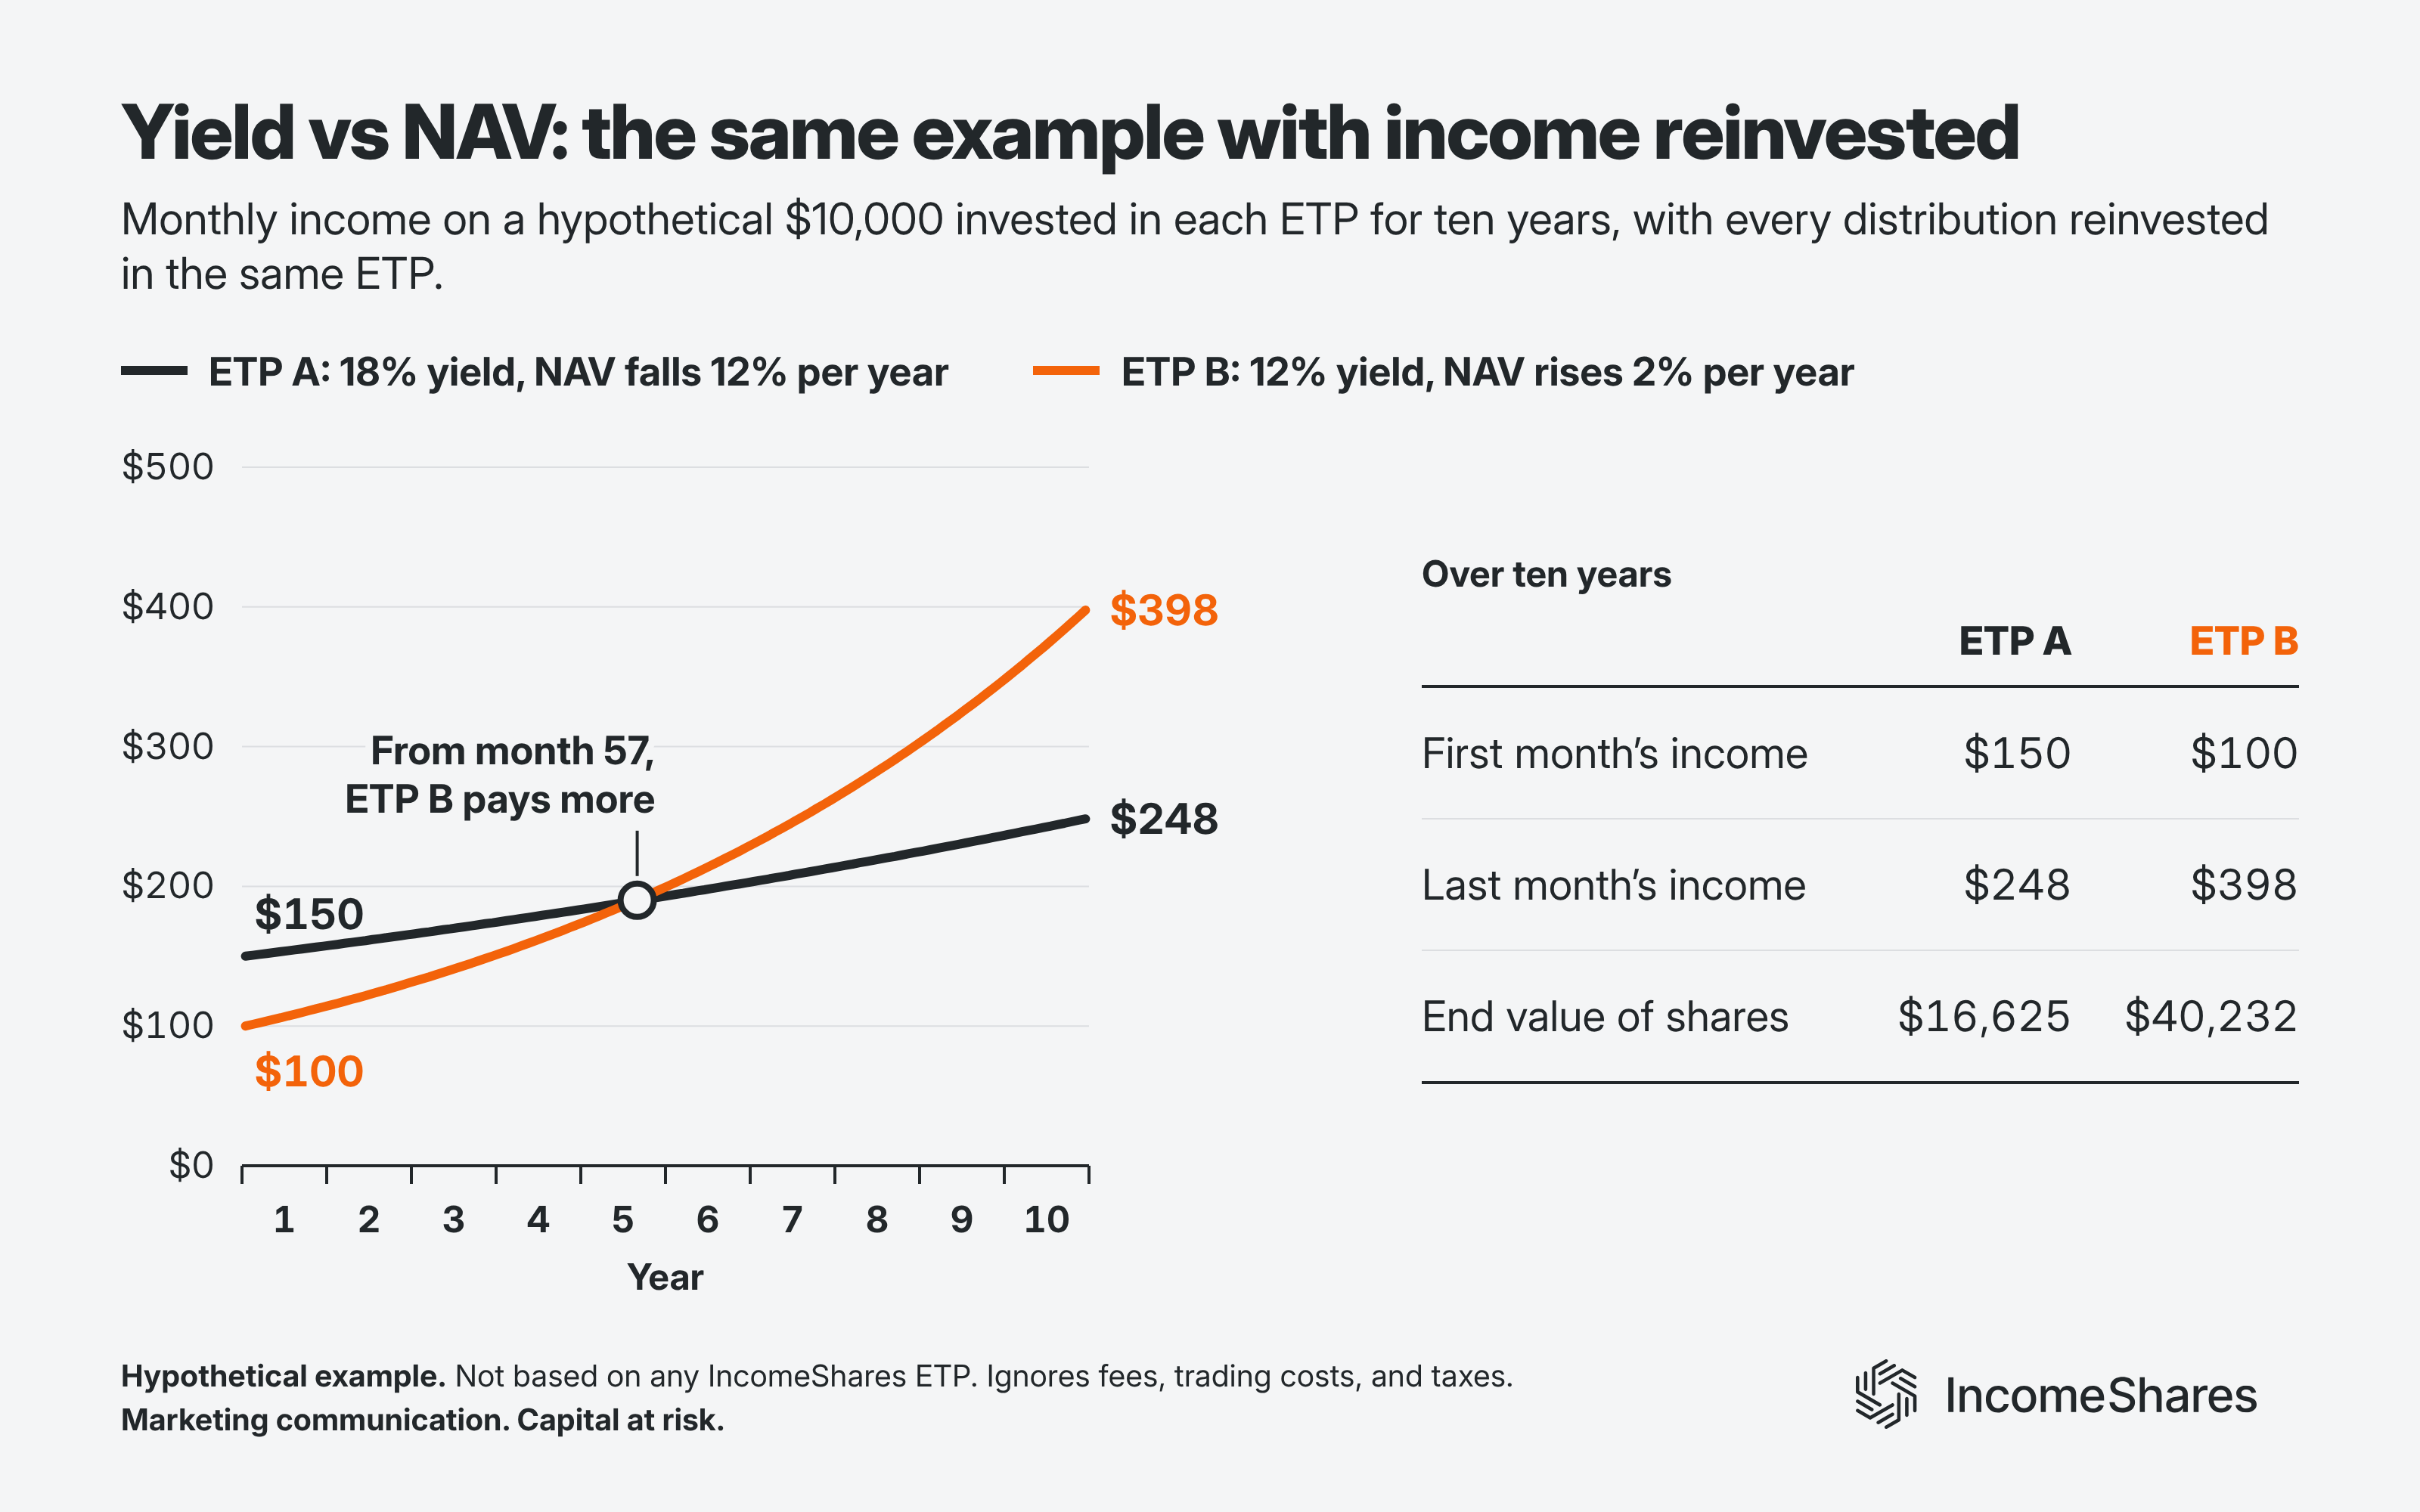
ETP A pays you $150 in the first month, and $248 in the last month. Your ETP A shares end up worth $16,625.
ETP B pays you $100 in the first month, and $398 in the last month. Your ETP B shares end up worth $40,232.
Reinvesting income keeps ETP A’s monthly income ahead for longer. ETP B passes it in year five (with reinvestment), rather than year three (without reinvestment). The chart below shows each ETP’s monthly income and the end value of your shares.
ETP B comes out ahead in both examples because its NAV rises, while ETP A’s falls. Total return counts both – the income an ETP pays, plus the change in its NAV. An ETP that sells options for income can capture less of its underlying asset’s rises than its falls. Over time, that can add to NAV erosion.
Three of our ETPs aim to pay a monthly income distribution of around 1% of their NAV. Those are Gold+ Yield, Silver+ Yield, and 20+ Year Treasury Options. So the distribution per share on those three ETPs can rise or fall with the NAV. We’re also updating how several of our ETPs aim to earn income. The aim is to help those ETPs capture more of their underlying assets’ rise, while still paying monthly income.
Key highlights
Yield vs NAV: a distribution yield is a percentage of an ETP’s NAV, so your income depends on both.
A lower yield on a rising NAV can pay more income than a higher yield on a falling NAV. In our example, the 12% yield pays more income each month by the end of year three. With the income reinvested, it takes until year five.
A yield tells you an ETP’s income as a percentage of its NAV – not what the NAV does next. Total return counts the income and the change in the NAV together.
Votre capital est exposé à un risque si vous investissez. Vous pouvez perdre la totalité de votre investissement. Veuillez consulter l’avertissement complet sur les risques ici
Produits associé:

Stratégie
Covered call
Rendement des
distributions
13.39%

Stratégie
Covered Call
Rendement des
distributions
12.22%

Stratégie
Covered Call
Rendement des
distributions
14.31%