

Auteur
Jonathan Hobbs, CFA
Date
17 Nov 2026
Catégorie
Market Insights
NVIDIA Volatility and a Week Not Seen Since 2018
Votre capital est exposé à un risque si vous investissez. Vous pouvez perdre la totalité de votre investissement. Veuillez consulter l’avertissement complet sur les risques ici
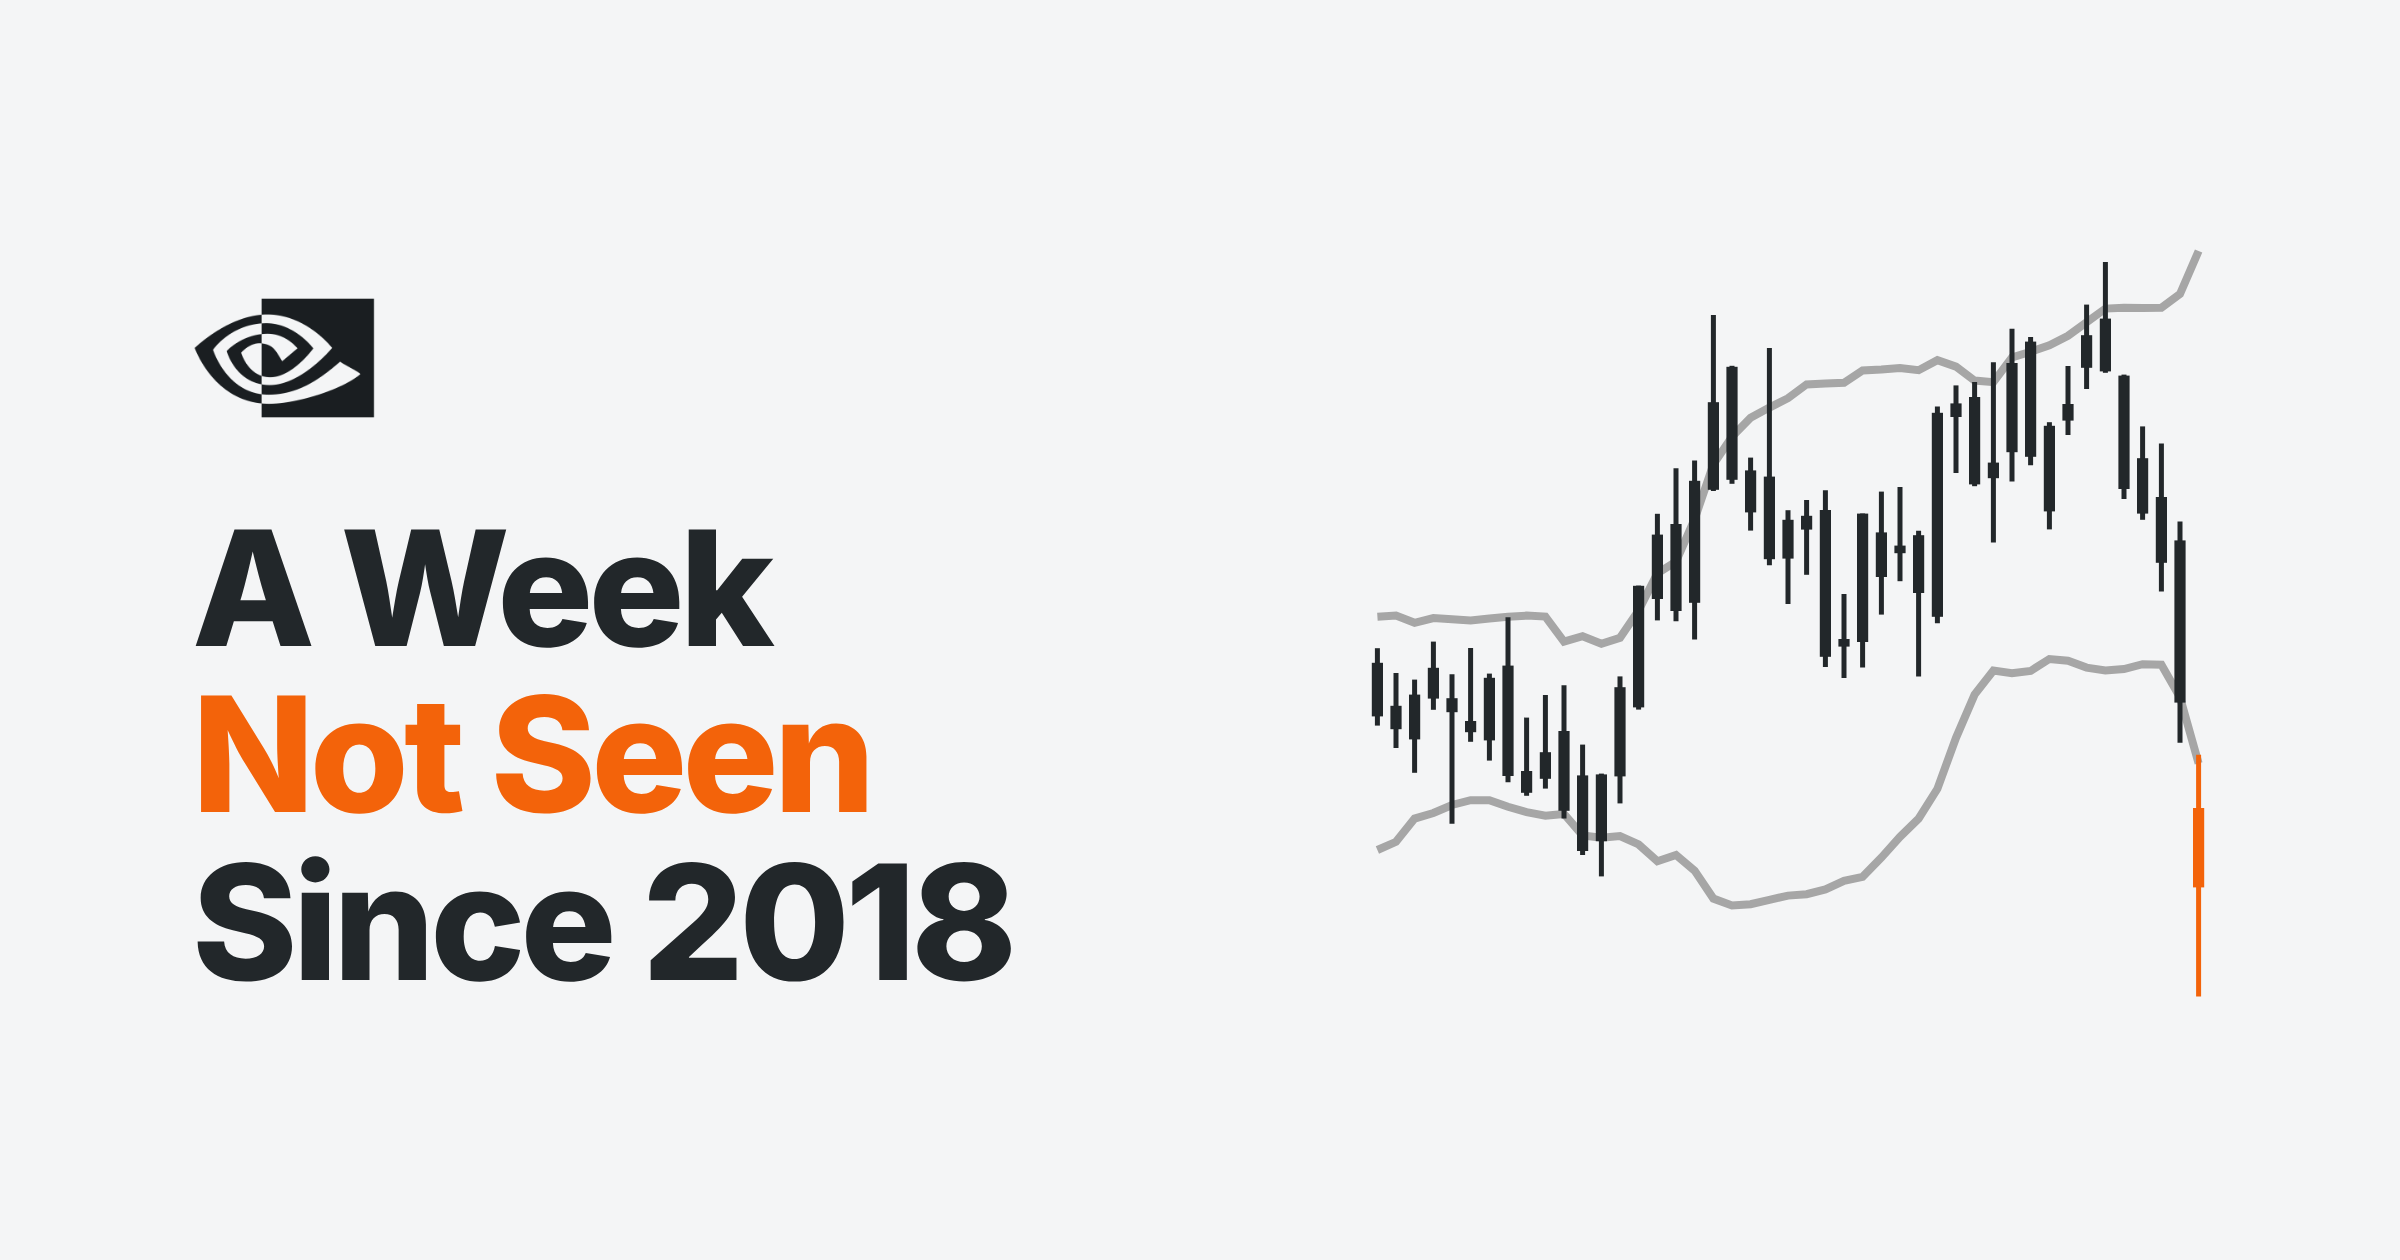
Last week was a rare one for NVIDIA volatility: the stock price opened and closed below the lower weekly Bollinger Band. That’s only happened eight other times since 1999, with the last one in November 2018. So here’s how NVIDIA’s stock price moved after those past eight weeks – and whether it might put NVIDIA closer to a bottom or not.
What NVIDIA’s Bollinger Bands showed last week
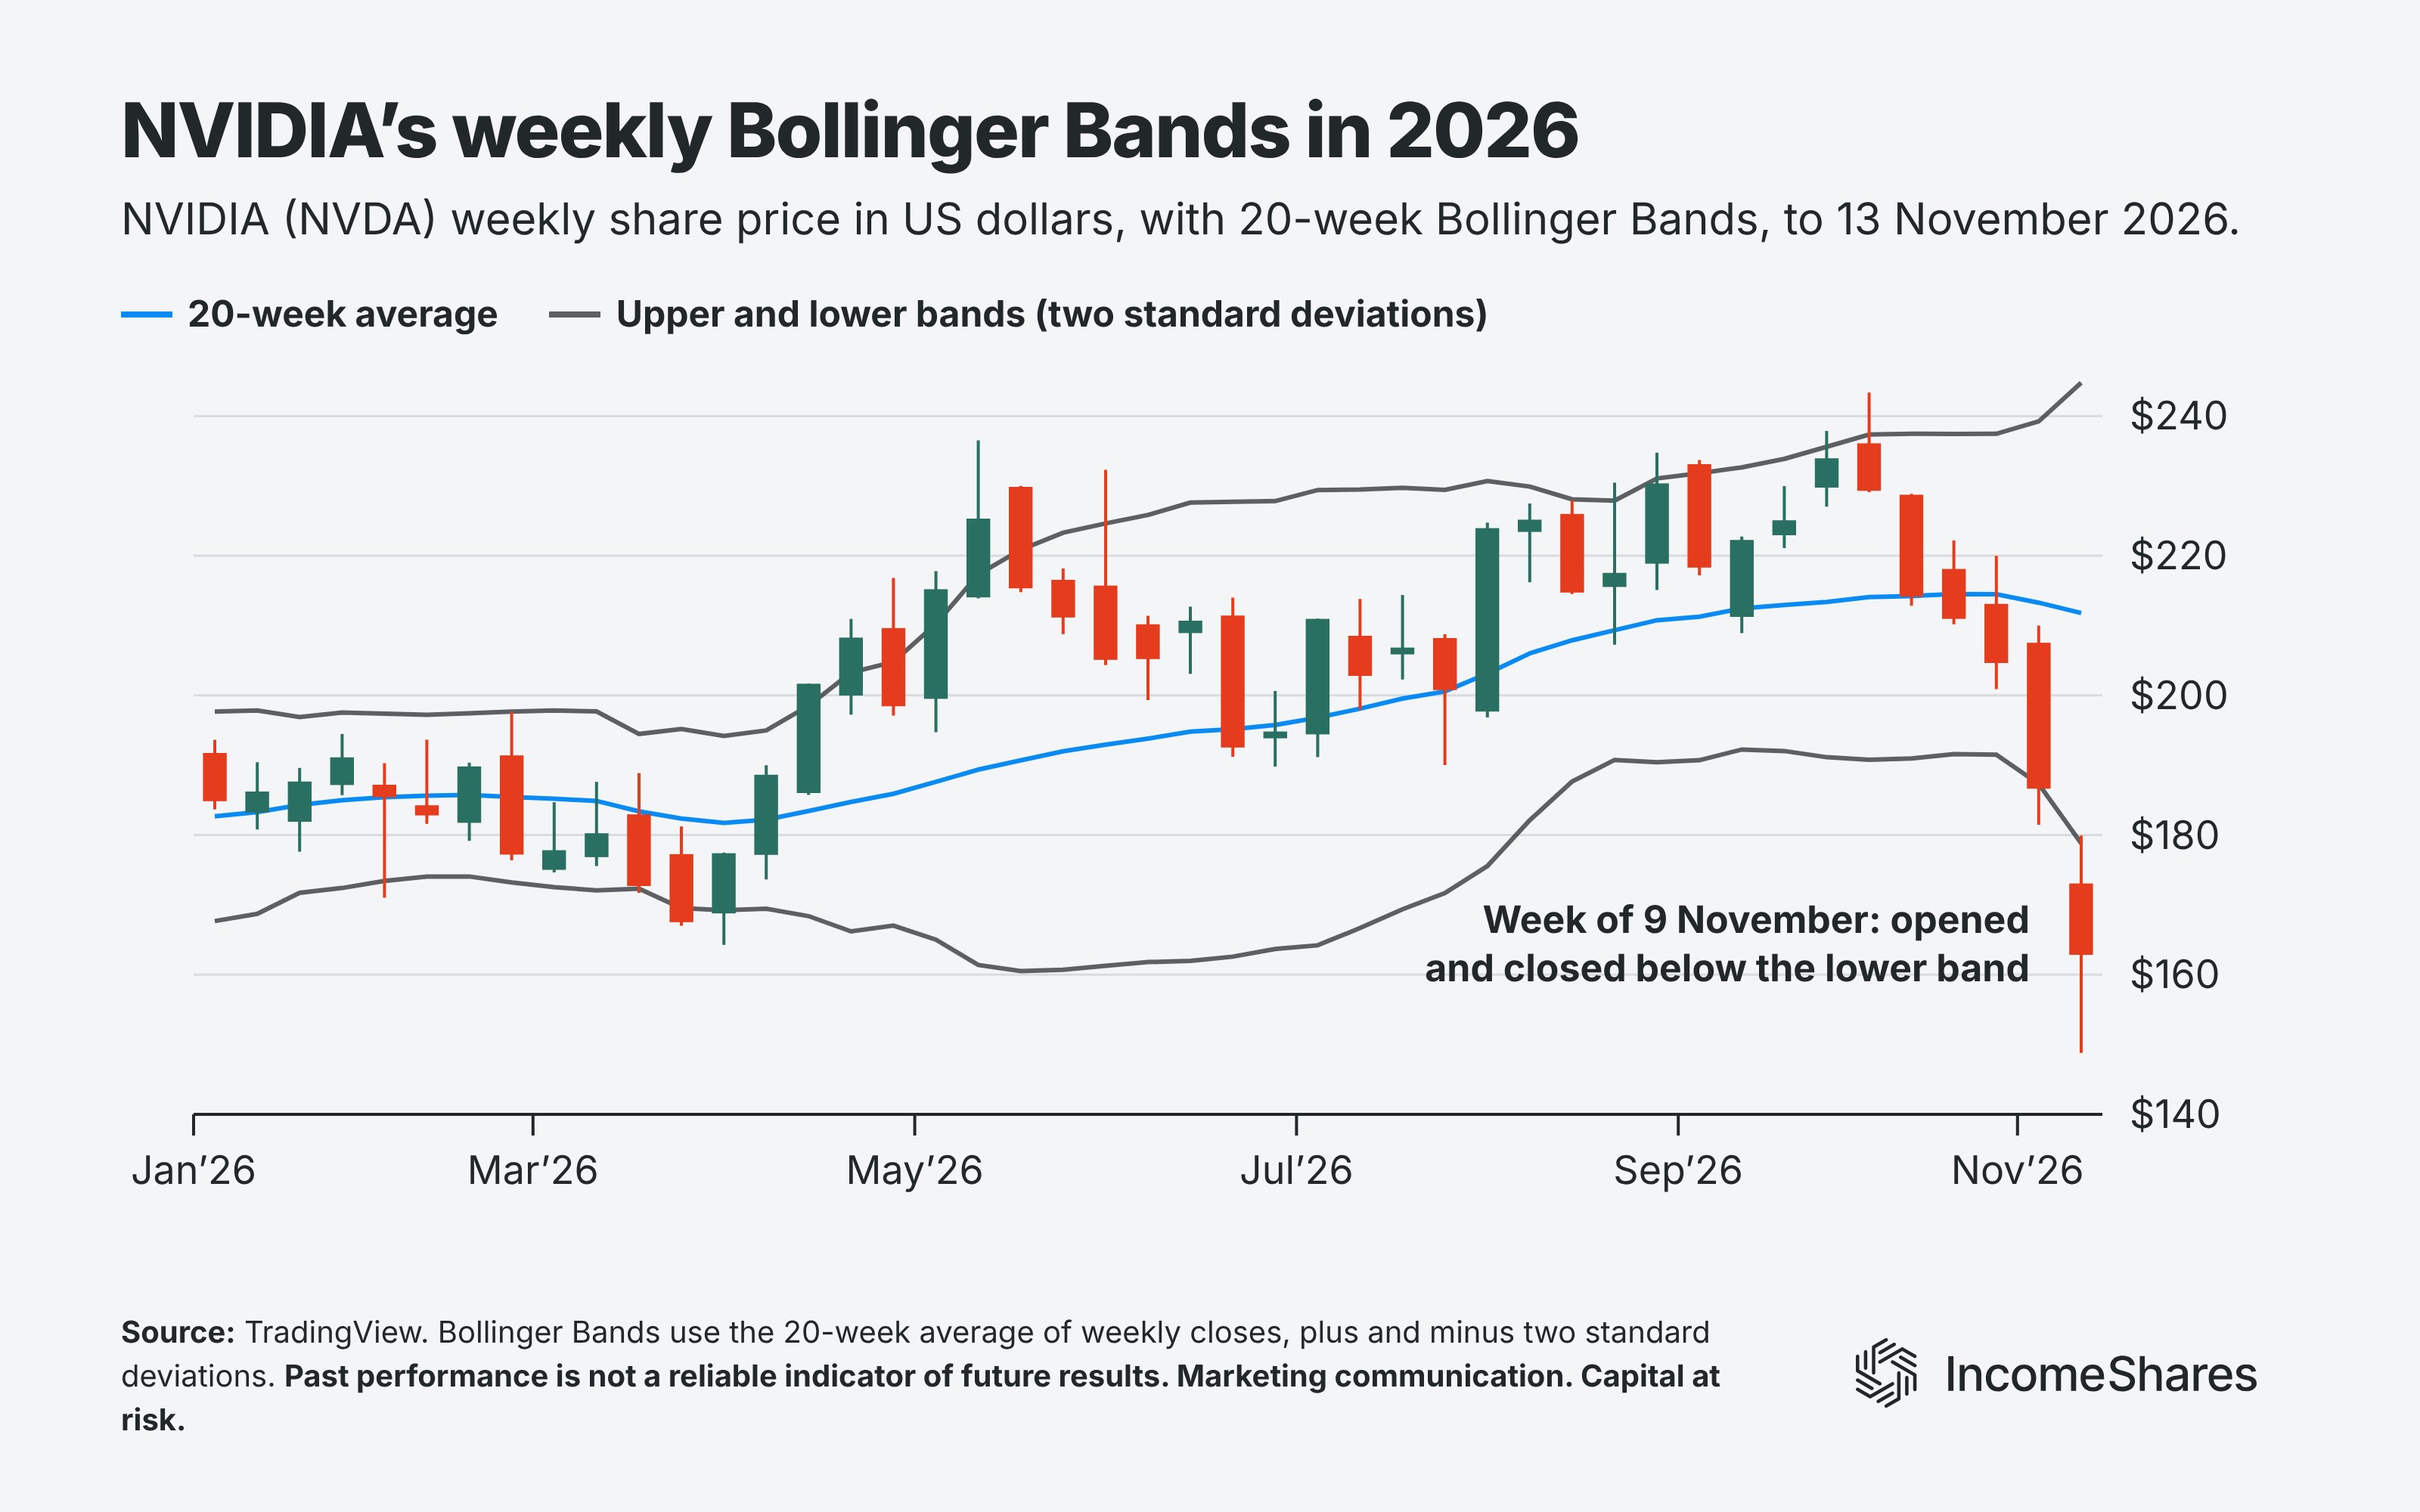
Bollinger Bands measure the volatility of an investment around its 20-period moving average. The wider the bands get, the more volatile the investment (and vice versa). On NVIDIA’s weekly chart below, the middle line (blue) is the 20-week moving average. That’s the average of the last twenty weekly closing prices.
Each red or green candle on the chart shows one week of NVIDIA’s stock price moves. Since 1999, 86% of NVIDIA’s weekly closes have landed between the bands, based on our analysis of TradingView data. But last week, NVIDIA’s shares opened and closed below the lower band – that’s the red candle on the far right. A week like that has only happened nine times since 1999 (including last week) – less than 1% of the weeks.
So by that measure, it was an extreme move. NVIDIA’s shares fell 12.7% over the week, to close at $162.85.
How NVIDIA’s shares moved after the eight other weeks like it
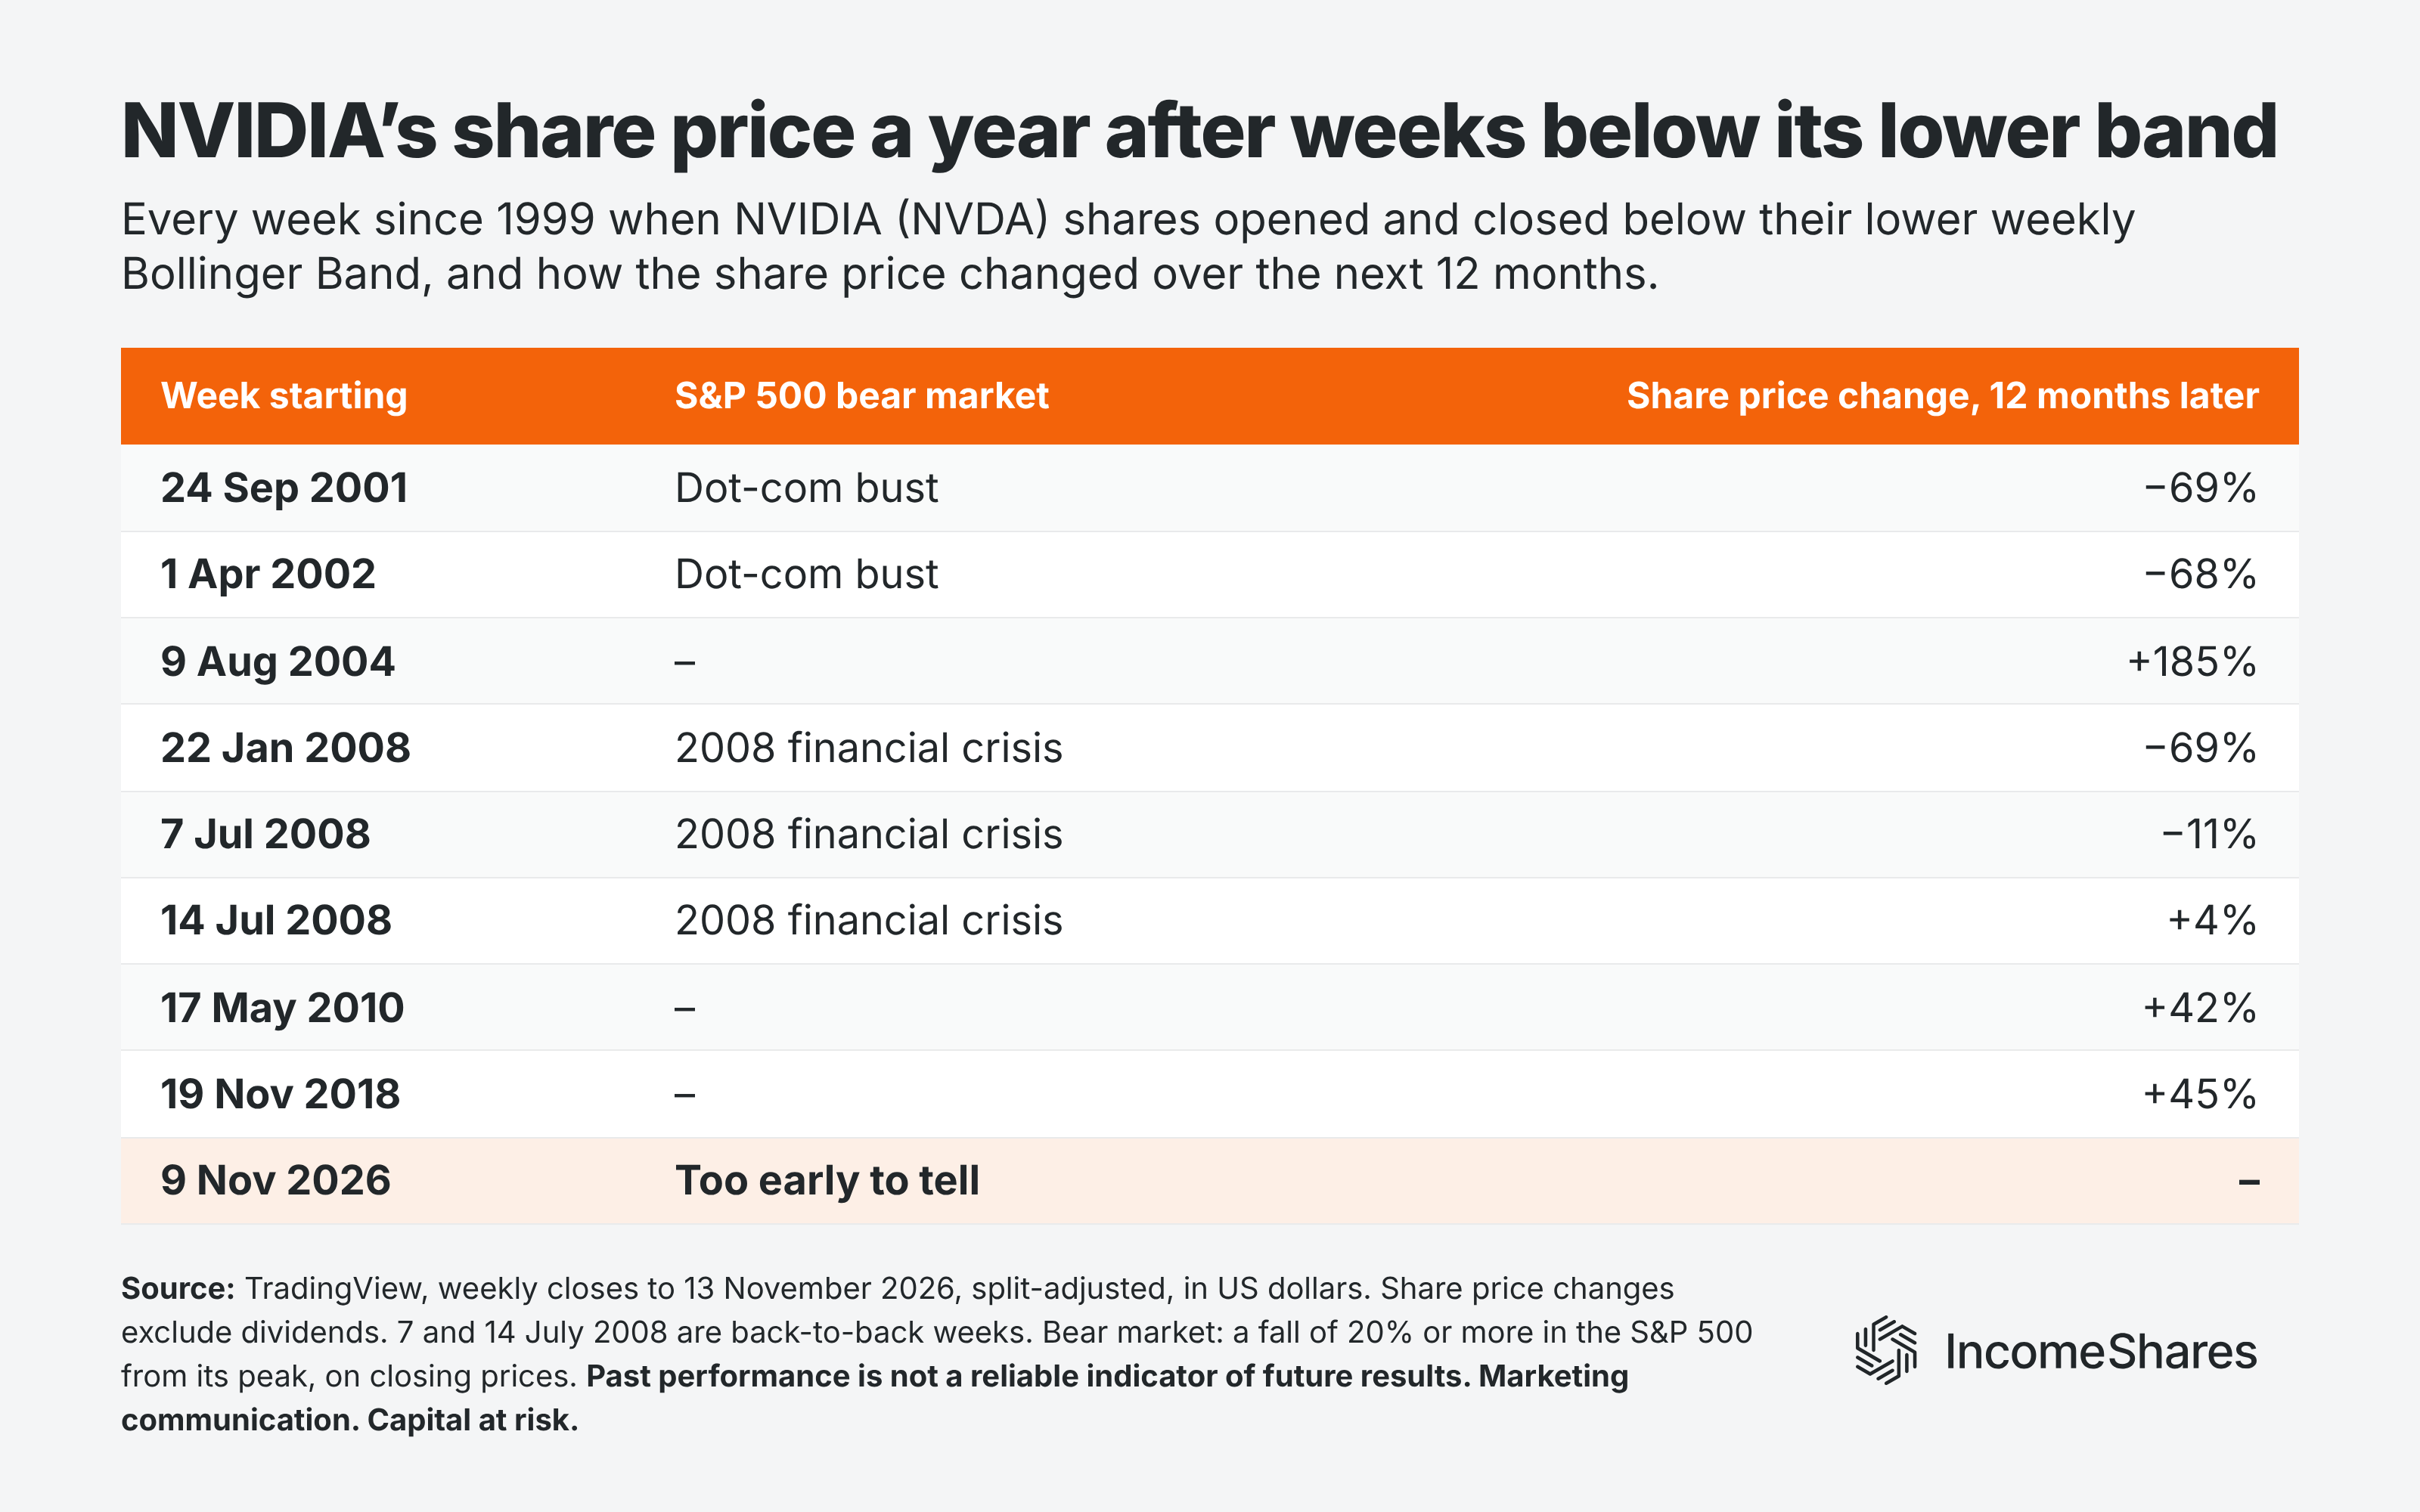
A year after those eight weeks, NVIDIA’s share price was higher in four cases and lower in four. But all four falls came during the dot-com bust or the 2008 financial crisis.
Outside of those two crises, there were three such weeks – in 2004, 2010, and 2018. A year after each one, NVIDIA’s share price was between 42% and 185% higher.
The table below shows all eight, plus last week. Keep in mind it’s a small sample size – and two of those weeks came back to back (in July 2008).
What NVIDIA volatility could mean for investors now
Part of last week’s fall came after bad news: co-founder Jensen Huang resigned as chief executive on 12 November. The shares had already fallen on reports about Huang from 8 November, before he resigned. So this could turn out to be a case of “sell the rumour, buy the news”.
NVIDIA’s shares have also gotten cheaper compared with the company’s expected profits. On 12 November, they traded at about 12 times analysts’ earnings forecasts for the next 12 months, according to Reuters. That was their lowest forward price-to-earnings (P/E) ratio since 2012. So NVIDIA’s shares are cheap by historical standards.
If the wider stock market holds up, history suggests they could be closer to a bottom than a top. And NVIDIA’s earnings results on 17 November will be worth watching, too.
The IncomeShares NVIDIA (NVDA) Options ETP
NVIDIA’s shares could still trade sideways or fall further. That’s where options income could help. Selling options may generate income, even if the shares go nowhere. And the premiums may help cushion a fall in the share price. But selling options can also mean capturing less of a rally in NVIDIA’s shares.
The IncomeShares NVIDIA (NVDA) Options ETP holds NVIDIA shares and sells options, with the aim of generating monthly income. We’re updating how several of our ETPs aim to earn income – here’s what’s changing and why.
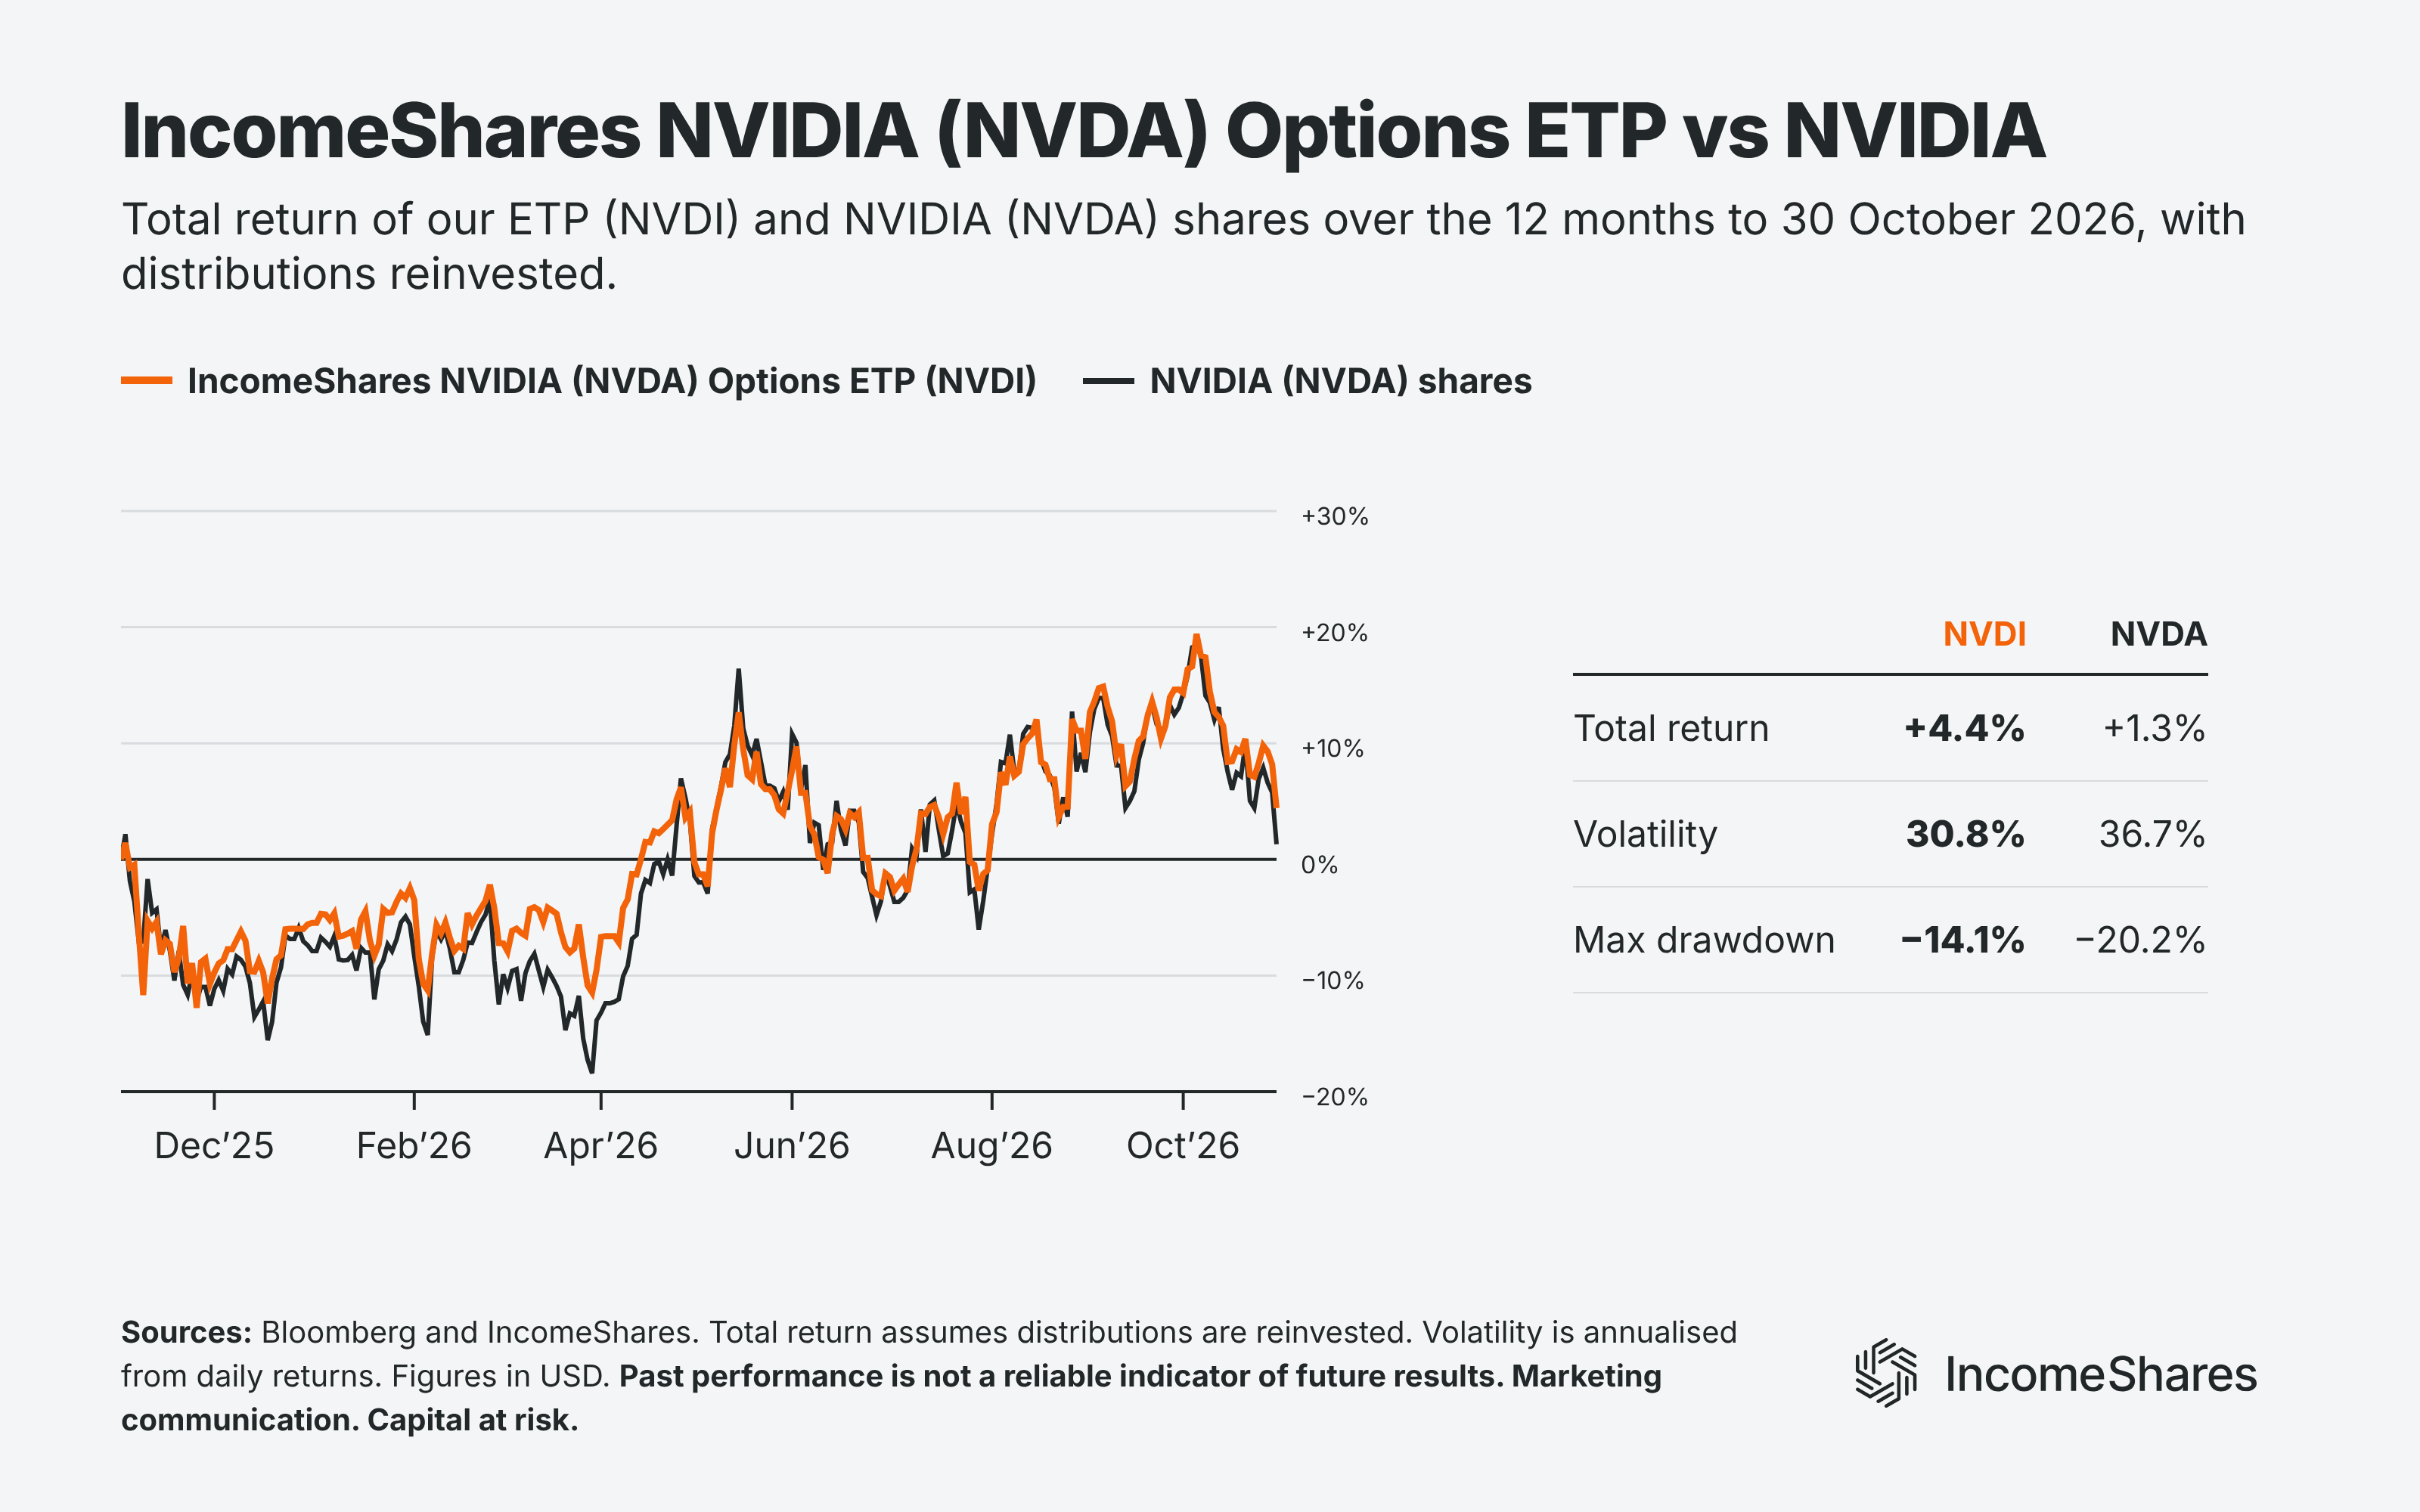
Over the twelve months to 30 October, our ETP (USD ticker: NVDI) had a 4.4% total return, with income distributions reinvested. NVIDIA’s shares had a total return of 1.3%. Our ETP was also less volatile, and its biggest fall from a peak was smaller. Figures are in US dollars, and past performance is not a reliable indicator of future results.
Key highlights
NVIDIA’s shares opened and closed below their lower weekly Bollinger Band for the first time since 2018.
A year after the eight similar weeks, NVIDIA’s share price was higher in four. All four falls came during the dot-com bust or the 2008 financial crisis.
On 12 November, NVIDIA’s forward P/E ratio was its lowest since 2012, according to Reuters.
Over the twelve months to 30 October, our NVIDIA (NVDA) Options ETP had a 4.4% total return, against 1.3% for NVIDIA’s shares (distributions reinvested, in US dollars). Past performance is not a reliable indicator of future results.
Votre capital est exposé à un risque si vous investissez. Vous pouvez perdre la totalité de votre investissement. Veuillez consulter l’avertissement complet sur les risques ici
Produits associé:

Stratégie
Option de vente couverte par liquidités (cash) + actions
Rendement des
distributions
48.23%

Stratégie
Option de vente couverte par liquidités + actions
Rendement des
distributions
52.98%

Stratégie
Basket of Income-generating ETPs
Rendement des
distributions
39.48%