
Auteur
Jonathan Hobbs, CFA
Date
18 Jun 2025
Catégorie
Market Insights
IncomeShares 2025 ETP Growth Snapshot
Votre capital est exposé à un risque si vous investissez. Vous pouvez perdre la totalité de votre investissement. Veuillez consulter l’avertissement complet sur les risques ici
IncomeShares exchange-traded products (ETPs) have seen consistent growth so far in 2025. This article breaks it down across three key metrics: fund flows, trading turnover, and assets under management (AUM) across our 11 ETPs.
1. Cumulative fund flows
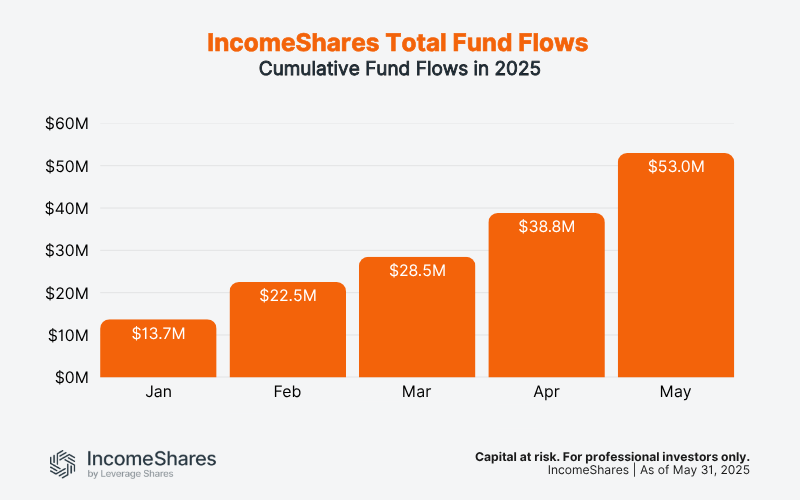
Cumulative fund flows represent the total amount of capital that has entered (or exited) the IncomeShares ETP range over time. Positive cumulative flows mean more money has come in than gone out – a sign of growing investor demand for IncomeShares products.
As shown in the chart below, IncomeShares ETPs have seen consistent monthly inflows throughout 2025. Cumulative fund flows climbed from $13.7 million in January to reach $53 million by the end of May. Each month has built on the last, reflecting growing interest in options-based strategies that aim to generate income.
2. Trading turnover growth
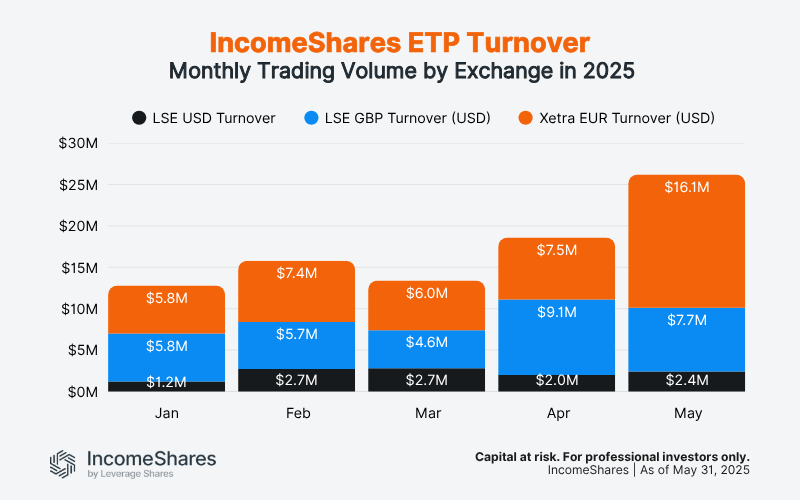
Trading turnover refers to the total dollar value of IncomeShares ETPs bought and sold by investors. A higher turnover means more trading activity.
Combined turnover across IncomeShares ETPs hit a new all-time high in May. Here's the May breakdown by exchange and currency listing:
• Xetra (EUR) turnover: $16.1m
• LSE (GBP) turnover: $7.7m
• LSE (USD) turnover: $2.4m
That’s a big jump from the start of the year – especially on Xetra, where monthly turnover has more than doubled since January. The data shows increasing demand for options-based income strategies across listed venues in Europe and the UK.
3. Assets under management (AUM) growth
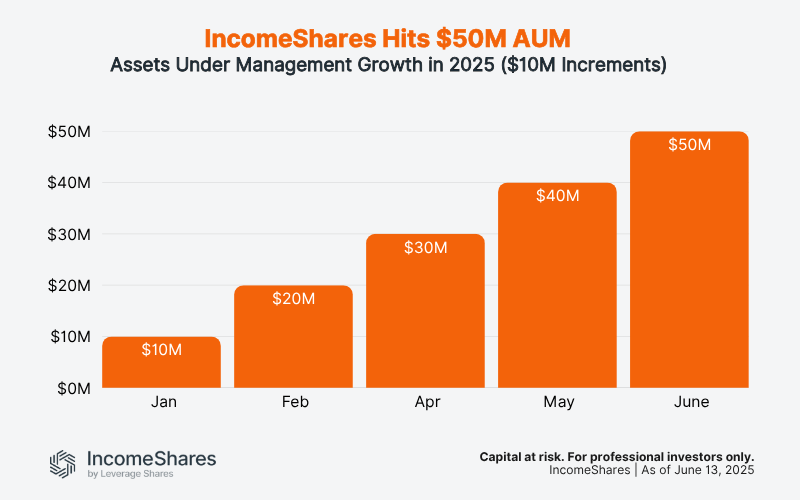
IncomeShares hit a new milestone in June: $50 million in total AUM.
AUM has climbed steadily throughout 2025, from $10 million in January to $50 million in June – even as our ETPs continue to pay out consistent monthly income to investors.
IncomeShares currently offers 11 ETPs that aim to generate monthly income by selling options on single stocks, US stock market indexes, and gold. More ETPs will be launching soon, including products for silver, TLT, and single stocks such as Alibaba and MicroStrategy.
Votre capital est exposé à un risque si vous investissez. Vous pouvez perdre la totalité de votre investissement. Veuillez consulter l’avertissement complet sur les risques ici
Produits associé:

Stratégie
Option de vente couverte par liquidités + actions
Rendement des
distributions
50.75%

Stratégie
Option de vente couverte par liquidités + actions
Rendement des
distributions
28.02%

Stratégie
Covered call
Rendement des
distributions
13.44%