
Auteur
Jonathan Hobbs, CFA
Date
25 Feb 2026
Catégorie
Market Insights
Gold Sell-Off: How Our Covered Call Strategy Performed
Votre capital est exposé à un risque si vous investissez. Vous pouvez perdre la totalité de votre investissement. Veuillez consulter l’avertissement complet sur les risques ici
Gold had a major sell-off in late January and early February 2026. This article shows how our gold covered call strategy performed during that decline. We break down the trades our Gold+ Yield ETP (GLDI) made over the week, the option premiums collected, and how that affected total returns.
How GLDI works
GLDI uses a covered call strategy with two parts:
First, we hold gold exposure through SPDR Gold Shares (GLD). That means the ETP's value can move with the gold price – up and down.
Second, we sell call options on that GLD exposure each week. We collect an upfront fee for doing this, called a premium. We pool those premiums together and aim to pay them to investors as monthly income distributions.
If GLD stays below the strike price when the option expires: the option buyer has no economic reason to use it. For example, buying GLD at a $498 strike price makes no sense if the market price is currently $442. The buyer can simply buy GLD cheaper in the open market. In that case, the option expires unused – or "worthless" to the buyer. That means we don't need to sell our GLD shares, and we keep the full premium as income.
If GLD rises above the strike price: the buyer will exercise the option and buy our GLD shares at the strike price. For example, if GLD rises to $520 but our strike price is $498, we sell at $498 – not $520. We miss out on the gains above $498 (the upside cap). We still keep the premium we collected upfront, but we give up any further gains above the strike price
The overall trade-off is capped upside during strong gold rallies, while the income we collect may help smooth returns if gold trades sideways or moves lower.
What trades did we make during the gold sell-off?
GLD fell around 17% between 29 January and 2 February 2026.
Each week, we sell weekly call options on our GLD exposure to collect option premiums upfront. Those options expire every Friday. The cycle we’re describing ran from Friday 30 January to Friday 6 February.
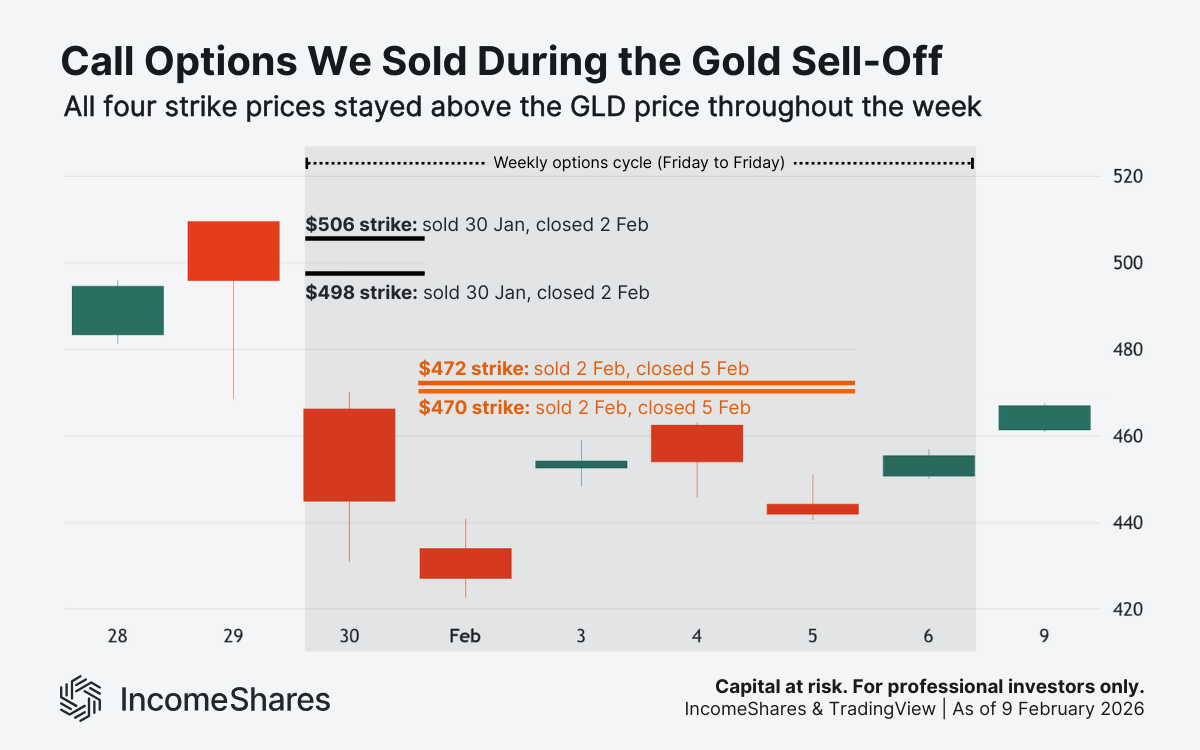
On 30 January, we sold call options at strike prices well above where GLD was trading (i.e. out of the money calls). If GLD stayed below those strikes by 6 February, the options would expire worthless – and we would keep the premiums as income.
The chart below shows the GLD price and our call option strike prices over the period. The GLD price stayed below every strike throughout the week.
How did each trade perform?
The table below shows the option trades over the period and the result of each one. Here are some definitions before you read the table:
Strike price – the fixed price at which the option buyer has the right to buy GLD.
Premium – the fee we collect upfront for selling that right.
Result – the difference between what we collected and what we paid to close the position.
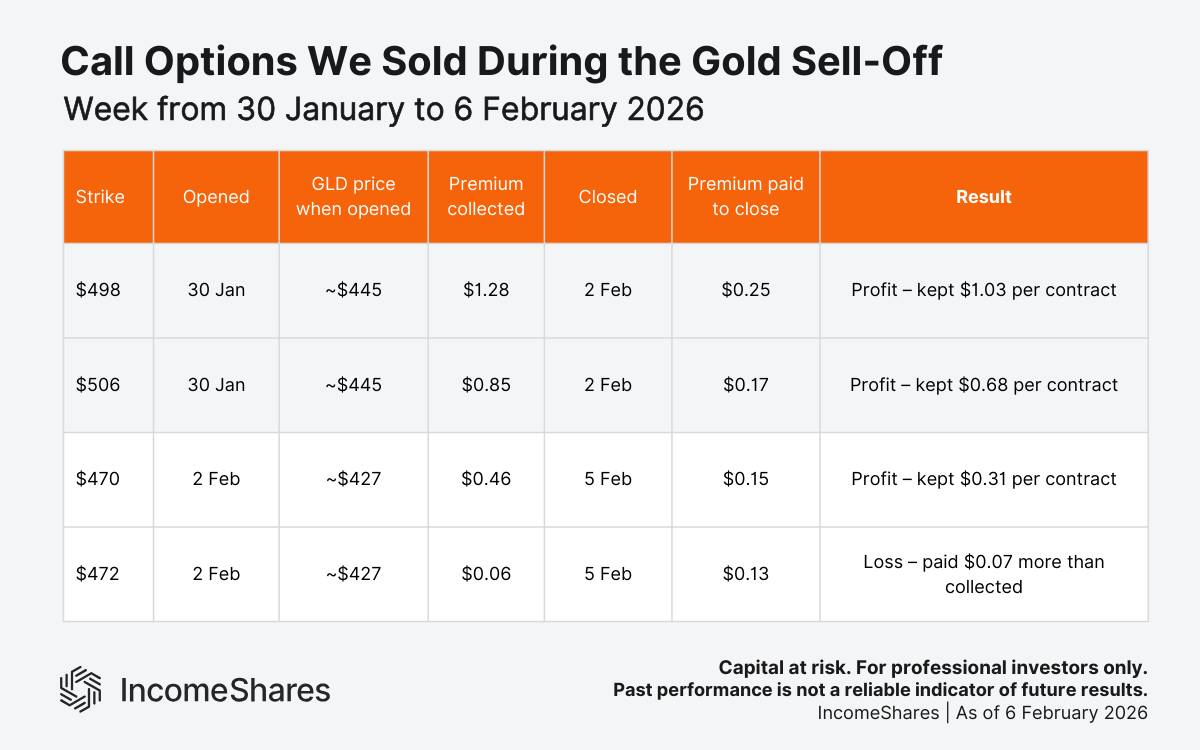
30 January – GLD at ~$445: We sold call options at $498 and $506 – both well above where GLD was trading. We collected $1.28 per contract at the $498 strike and $0.85 per contract at the $506 strike.
2 February – GLD at ~$427: Gold reached the low point of the sell-off. GLD was now well below the $498 and $506 strikes we sold on 30 January, so the options had lost most of their value. We bought both positions back early – at $0.25 and $0.17 per contract, respectively. That was around 80% less than we originally collected. We also sold new call options at $470 and $472, reflecting the lower gold price. We collected $0.46 per contract at the $470 strike and $0.06 per contract at the $472 strike.
5 February – GLD at ~$442: GLD had recovered slightly, but it was still below all four strike prices. We bought back both remaining positions ahead of Friday's expiry. The $470 calls cost around 67% less to close than we collected. But the $472 calls made a small loss – we collected $0.06 but paid $0.13 to close them.
Keep in mind that not every position works out. The strategy aims to generate net income across all positions over time – not on every individual trade.
On the same day, we opened the next weekly cycle – selling new calls at $478 and $483 strikes, expiring 13 February. The strategy rolls from one weekly cycle to the next, continuously.
How did GLDI perform versus GLD during the sell-off?
Because we hold GLD shares, GLDI's value fell when gold dropped. That’s expected – and it’s important to clarify. GLDI is not a hedge against falling gold prices. It holds gold exposure, after all.
But GLDI did fall by less than GLD over the period. The chart below compares the total returns of both from 29 January to 6 February 2026. Total return figures are from Bloomberg and assume reinvestment of all income distributions.
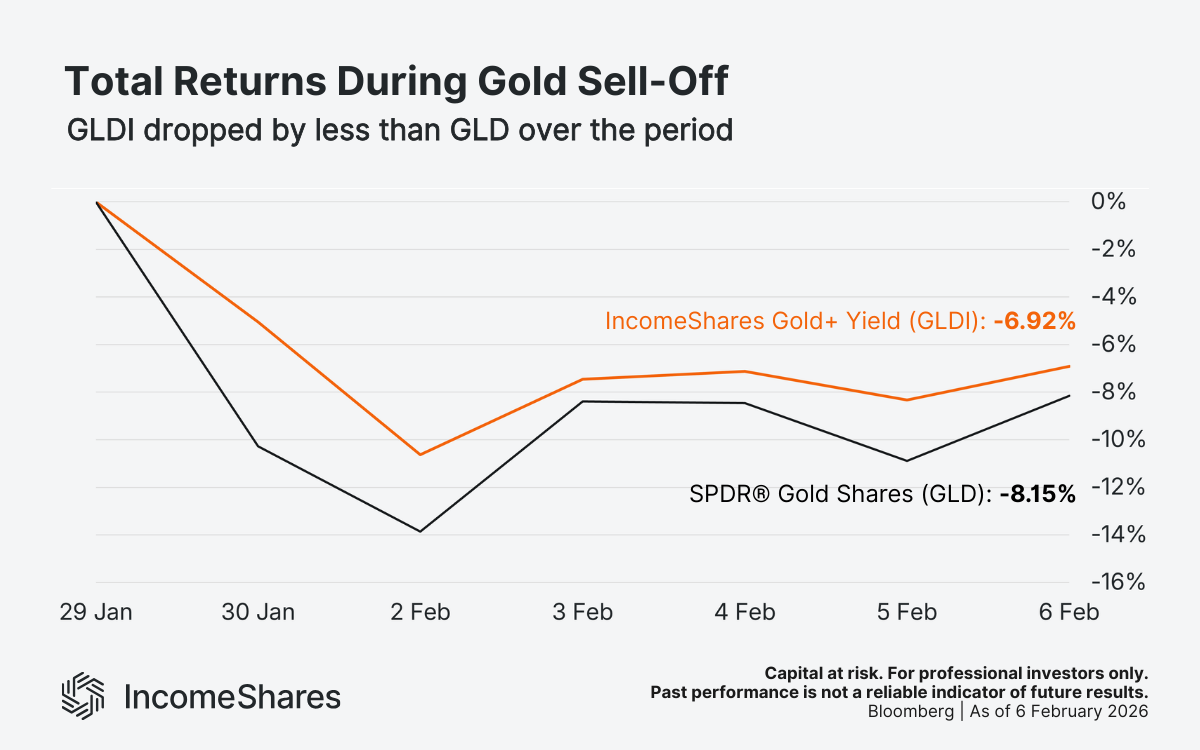
At the low point on 2 February, GLD was down 13.87%, while GLDI was down 10.63%. By the end of the cycle on 6 February, GLD was down 8.15% and GLDI was down 6.92%. The premium income collected from selling call options helped offset some of the downside. That’s consistent with what the strategy aims to do in falling markets
The trade-off to understand
That week showed how the covered call strategy can behave in falling markets. Gold fell, our strikes stayed well above the GLD price, and we kept most of the premium we collected. Over the period, GLDI dropped by less than GLD.
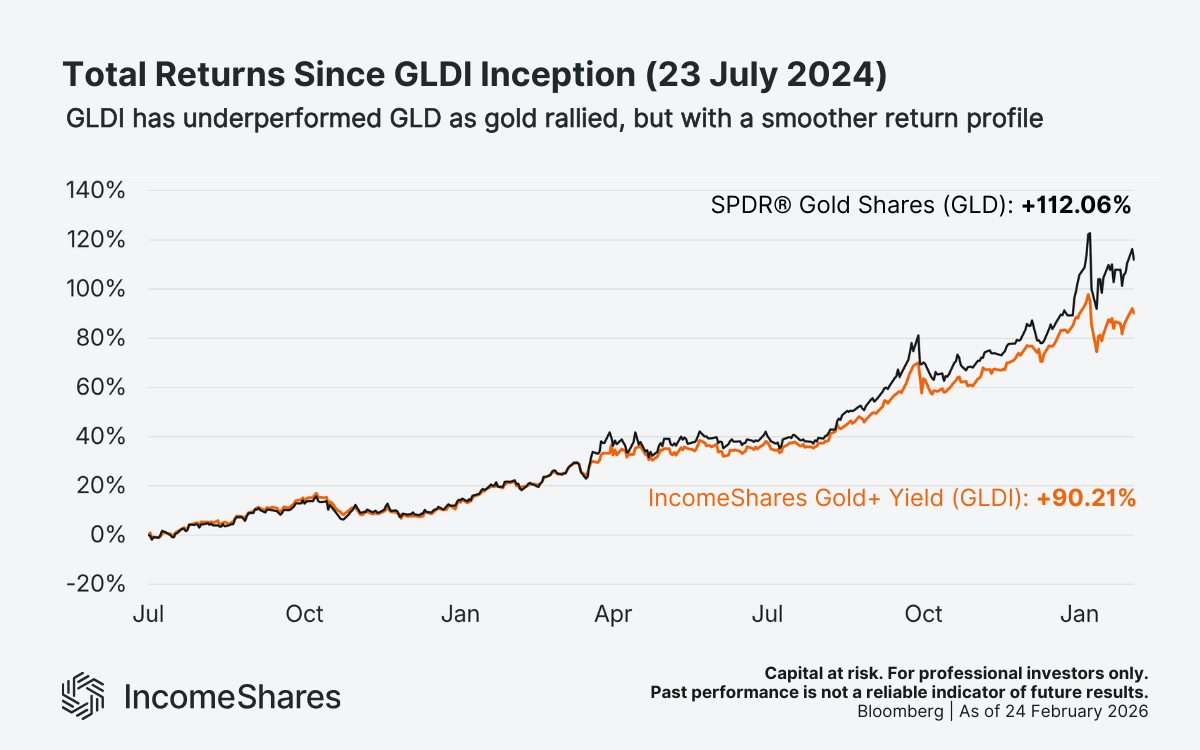
But the strategy won't always outperform GLD. When gold rallies strongly, GLDI may lag. That's because our strike prices cap how much we can benefit from GLD rising above them. Essentially, we give up some of the upside potential in exchange for the income we collect each week.
The chart below shows this since GLDI launched in July 2024. Over that period, GLD has outperformed GLDI on raw total returns as gold has generally rallied. But GLDI has tracked gold's general direction – while generating monthly income and with a smoother return profile along the way.
Key takeaways
GLDI holds GLD for gold price exposure and sells weekly call options to aim for income from option premiums.
GLD fell around 17% between 29 January and 2 February 2026.
Our call option strike prices stayed well above the GLD price throughout the sell-off.
Three of the four trades made a profit. One trade – the $472 strike – made a small loss.
At the low point on 2 February, GLD was down 13.87% from 29 January. GLDI was down 10.63%.
By 6 February, GLD was down 8.15% from 29 January. GLDI was down 6.92%.
In strong gold rallies, GLDI may underperform GLD. That is the trade-off of the covered call strategy.
Votre capital est exposé à un risque si vous investissez. Vous pouvez perdre la totalité de votre investissement. Veuillez consulter l’avertissement complet sur les risques ici
Produits associé:

Stratégie
Covered call
Rendement des
distributions
12.33%

Stratégie
Covered Call
Rendement des
distributions
12.47%

Stratégie
Covered Call
Rendement des
distributions
12.71%