
Autor
Jonathan Hobbs, CFA
Fecha
05 Dec 2024
Categoría
Market Insights
Understanding Implied Volatility Skew in Options Trading
Su capital está en riesgo si invierte. Podría perder toda su inversión. Por favor, consulte la advertencia de riesgos completa aquí.
Implied volatility (IV) measures the market’s expectations of future price movements for an underlying asset. But it doesn’t stay the same for all option strike prices. This unevenness is called the implied volatility skew, and understanding it is crucial for anyone trading options.
What Is Implied Volatility Skew?
Implied volatility skew shows how IV changes for options with different strike prices. Instead of being flat, IV often varies between out-of-the-money (OTM), at-the-money (ATM), and in-the-money (ITM) options. This creates a curve (or “skew”) when we plot IV against strike prices.
Here’s how the skew typically works:
OTM puts (strike prices below the current price) often have higher IV than ATM puts. That’s because typically traders buy OTM puts to protect against potential sharp price drops. High demand tends to increase their price (premium) and raise their implied volatility.
OTM calls (strike prices above the current price) tend to have lower IV than ATM calls. Fewer traders typically buy OTM calls, as they tend to focus more on protecting against losses than betting on large gains.
Note: The link between demand for options and implied volatility comes from options pricing models like Black-Scholes. When demand drives up an option’s price, the model assumes higher IV to explain the premium. To learn more about how this works, see our Black-Scholes Model Guide.
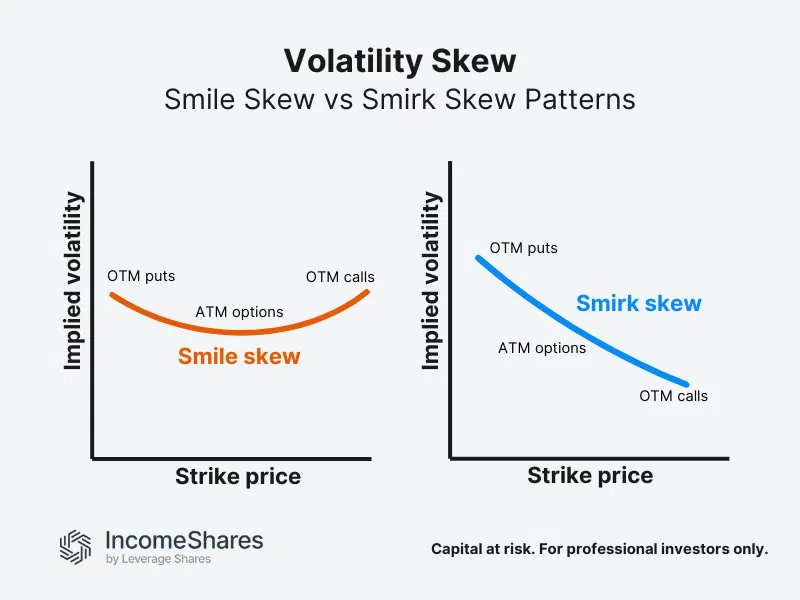
Volatility smile vs volatility smirk
There are two common types of skew. The chart below shows the difference between a typical volatility smile (U-shaped curve) and a volatility smirk (asymmetrical). In a smile, both OTM puts and calls have higher IV due to demand for protection against extreme price moves. In a smirk, OTM puts have much higher IV than OTM calls, showing greater demand for downside protection.
Why does implied volatility skew matter in options trading?
Implied volatility skew can reveal a few key insights about market sentiment and option pricing:
- Market risk: A steep IV skew in OTM puts might mean that investors are concerned about potential price drops. So, they could have increased demand for downside protection.
- Option pricing: High IV in OTM options leads to higher premiums. This explains why OTM options are often more expensive than ATM or ITM options.
- Strategy considerations: Certain options strategies, like credit spreads or iron condors, rely on understanding where IV is highest to assess potential risks and returns.
Example: Implied volatility skew in the Nasdaq 100
Suppose the Nasdaq 100 index is trading at 20,000:
- An ATM option has an IV of 20%.
- An OTM put with a strike price of 19,000 has an IV of 25%. This reflects increased demand for protection against significant price drops.
- An OTM call with a strike price of 21,000 has an IV of 18%.
This shows a typical volatility smirk, where OTM puts have higher IV because of demand for downside protection.
Key takeaways
- Implied volatility skew shows how IV changes across strike prices.
- OTM puts usually have higher IV due to hedging demand, while OTM calls tend to have lower IV.
- Understanding skew can help explain market sentiment and option pricing dynamics.
Su capital está en riesgo si invierte. Podría perder toda su inversión. Por favor, consulte la advertencia de riesgos completa aquí.
Productos Relacionados:

Estrategia
Put garantizado con efectivo + Acciones
Rendimiento de
Distribución
78.83%

Estrategia
Put garantizado con efectivo + Acciones
Rendimiento de
Distribución
69.95%

Estrategia
Put garantizado con efectivo + Acciones
Rendimiento de
Distribución
47.28%

Estrategia
Put garantizado con efectivo + Acciones
Rendimiento de
Distribución
50.75%

Estrategia
Covered Call
Rendimiento de
Distribución
13.44%