
Autor
Jonathan Hobbs, CFA
Fecha
18 Dec 2025
Categoría
Market Insights
IncomeShares Gold+ Yield ETP Reaches $25M AUM
Su capital está en riesgo si invierte. Podría perder toda su inversión. Por favor, consulte la advertencia de riesgos completa aquí.
The IncomeShares Gold+ Yield ETP has reached $25 million in assets under management. The product gives investors exposure to gold while also aiming to generate monthly income through a covered call strategy.
This article explains how that strategy works, and how the ETP has performed on the way to its $25 million AUM milestone. We’ll also highlight why some investors may see Gold+ Yield as a potential substitute for regular gold exposure.
How the Gold+ Yield ETP works
The IncomeShares Gold+ Yield ETP is an exchange-traded product that trades in Europe and the UK. It uses a covered call strategy on the SPDR® Gold Shares (GLD) exchange-traded fund. This strategy has two parts:
The ETP has gold price exposure by owning GLD shares.
It sells call options on that GLD exposure for income potential from option premiums. The ETP aims to distribute these call option premiums monthly to investors as dividends.
Selling call options creates a potential trade-off, depending on market conditions. If the price of gold:
Rallies: some upside on the ETP may be capped. That’s because the ETP needs to sell GLD shares if the market price goes above the call option strike price.
Trades sideways: the ETP may still collect income while gold itself stays flat.
Moves down: option income may partly offset drawdowns.
The overall trade-off is capped upside during strong gold rallies, while the steady income may help smooth returns if gold trades sideways or moves lower.
Performance versus gold since inception
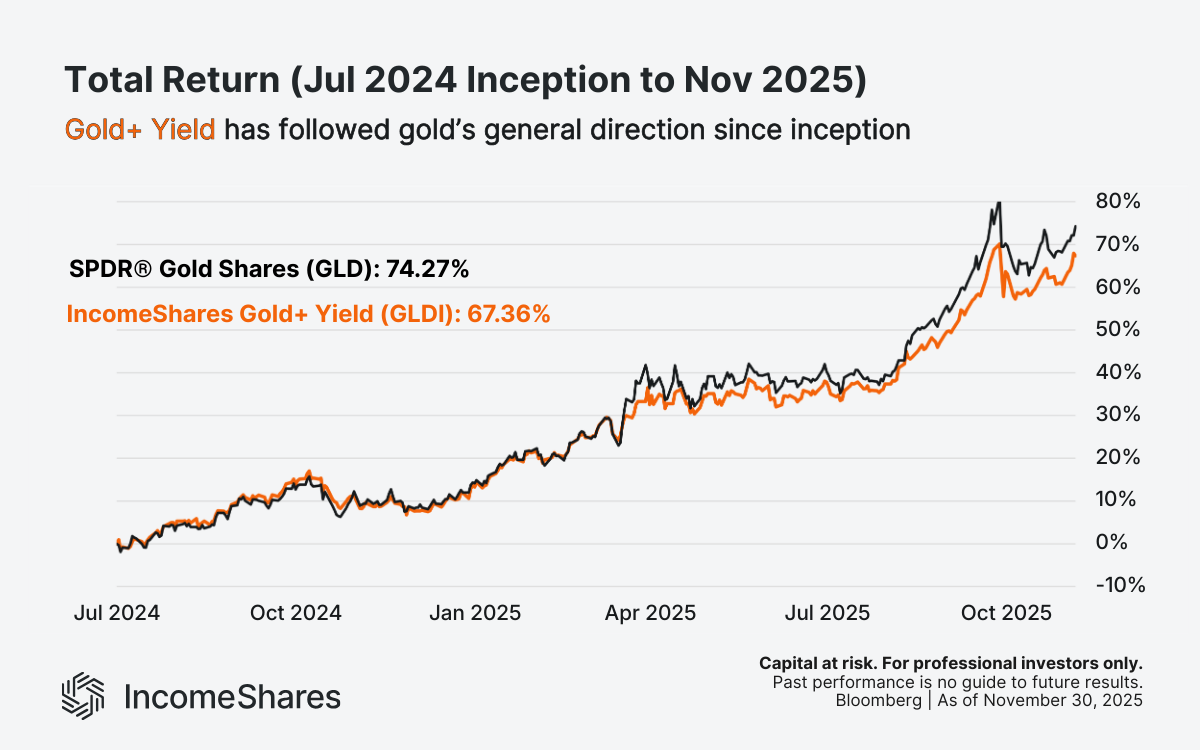
From inception to 30 November 2025, the IncomeShares Gold+ Yield ETP (GLDI) had a total return of 67.36%. That number assumes all dividend income was reinvested back into the ETP. Over the same period, GLD returned 74.27%.
GDLI returned less, but the difference makes sense for the covered call strategy: GLDI had to sell GLD shares as gold rallied. The chart compares the two – notice how GLDI consistently tracked gold’s general direction over the period.
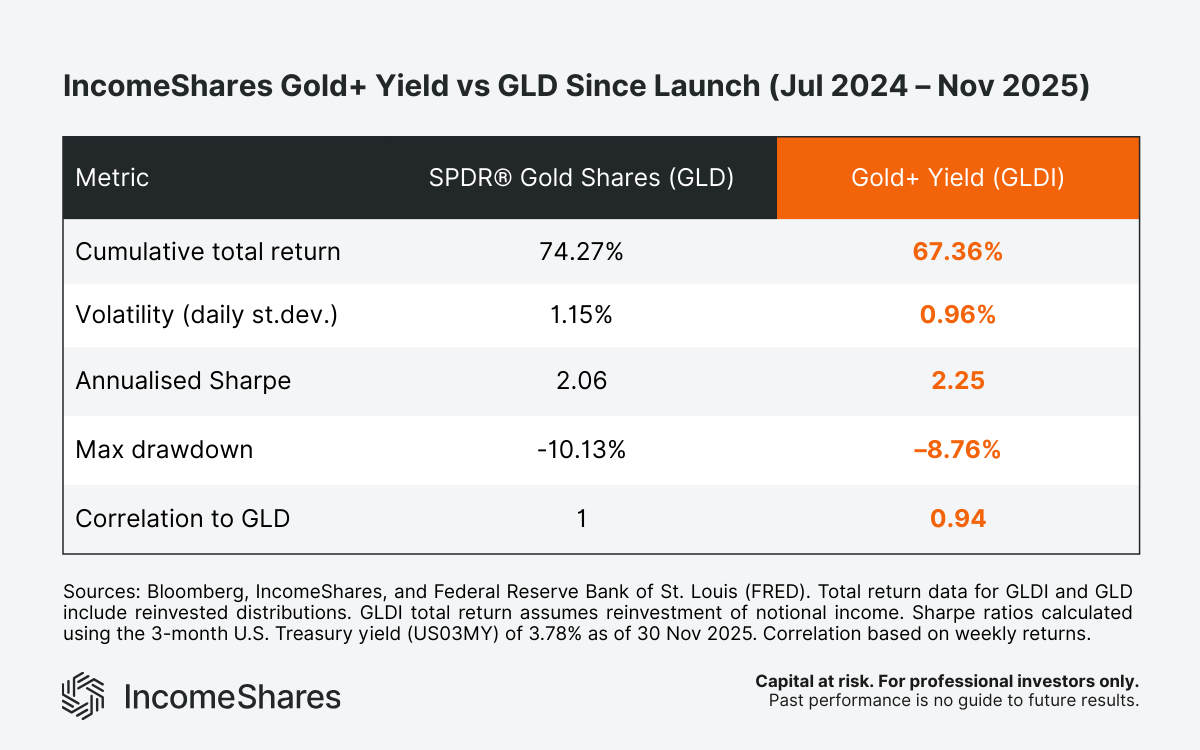
That said, GLDI has seen better risk-adjusted returns than GLD since launching in July of 2024. The Sharpe ratio, which measures return per unit of risk (volatility), was higher for GLDI. And GLDI’s maximum drawdown (worst case loss from top to bottom) was also lower – along with its daily volatility.
The table below shows the numbers for each from inception until the end of November.
Gold+ Yield Income paid out in 2025
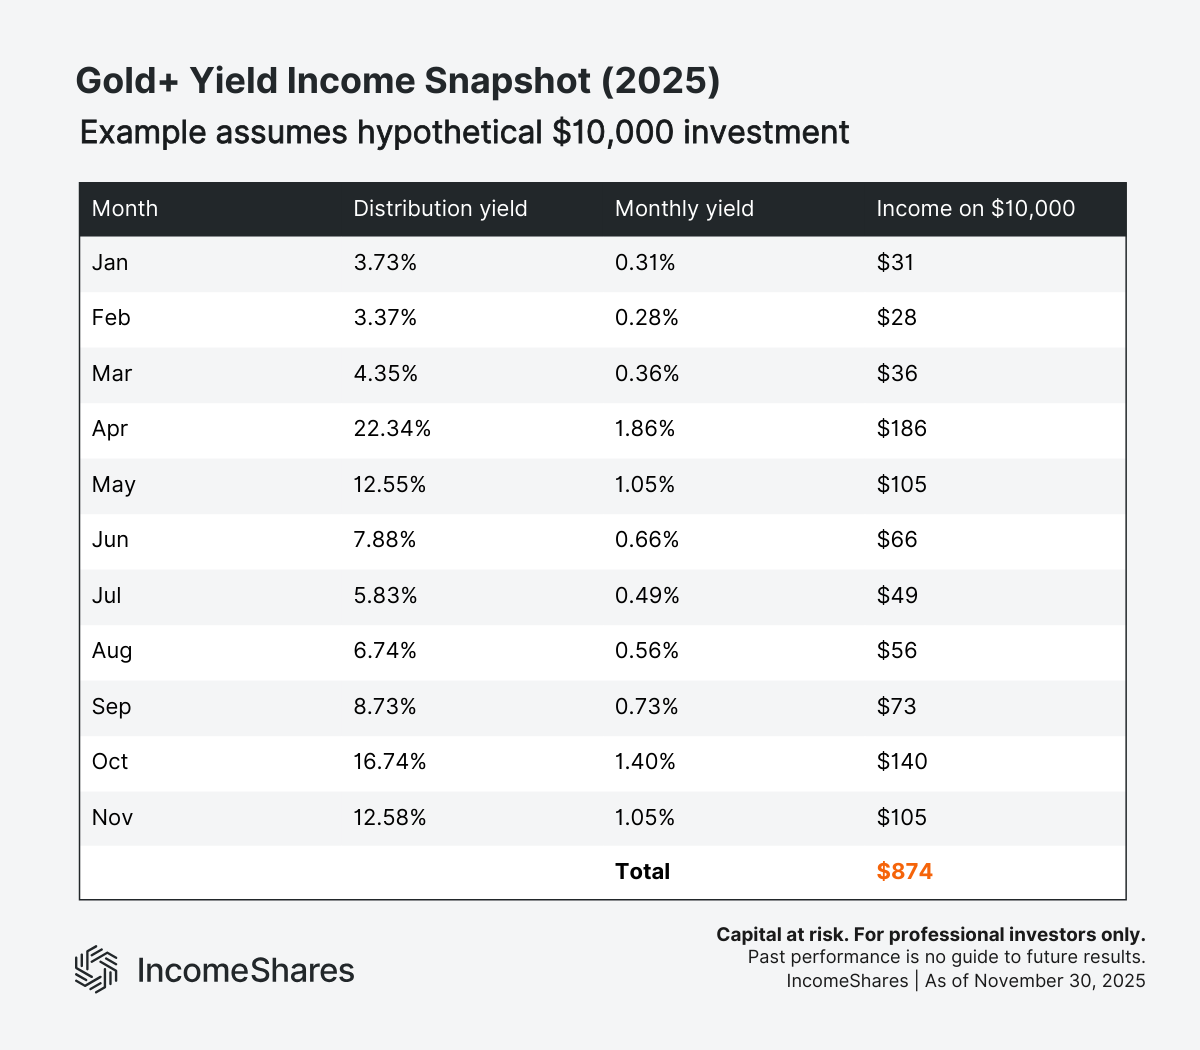
Part of Gold+ Yield’s total return includes the income it paid out to investors each month in the form of ETP dividends. In 2025, GLDI produced an average monthly yield of 9.53% (annualised) from selling call options on gold. These distributions have provided a steady cash flow for investors.
Based on 2025 distribution yields, a $10,000 investment in January would have generated approximately $874 of income through November. Monthly income varied during the year, ranging from 0.28% ($28) to 1.86% ($186) per month. Distributions depend on market conditions and options pricing.
Why some investors may prefer Gold+ Yield to gold
Gold has approximately doubled in value since early 2024. Many investors still want exposure – but rallies rarely continue in straight lines. Rotating from a regular gold into Gold+ Yield may allow investors to keep exposure to gold’s general direction, while potentially earning monthly income.
A common argument against holding gold is that it doesn’t pay a yield. But many investors still see gold as a core asset for diversification and inflation protection. Gold+ Yield might not always outperform gold itself, but it does aim to pay a yield.
Key takeaways
Gold+ Yield offers gold exposure with the potential for monthly income from selling call options.
Since inception, returns have slightly underperformed gold itself. But Gold+ Yield has had smaller drawdowns and lower volatility.
Income in 2025 was meaningful but varied with market conditions.
Su capital está en riesgo si invierte. Podría perder toda su inversión. Por favor, consulte la advertencia de riesgos completa aquí.
Productos Relacionados:

Estrategia
Covered Call
Rendimiento de
Distribución
13.44%

Estrategia
Covered Call
Rendimiento de
Distribución
15.60%