
Autore
Jonathan Hobbs, CFA
Data
20 Mar 2025
Categoria
Market Insights
GLDI vs GLD: How Has GLDI Performed vs Gold?
Il tuo capitale è a rischio se investi. Potresti perdere l’intero investimento. Consulta l’avviso completo sui rischi qui.
Gold has been on an impressive run, after surging past $3,000 per ounce for the first time last week. In this article, we compare the performance of the IncomeShares Gold+ Yield Options ETP (GLDI) with SPDR® Gold Shares (GLD).
What’s driving gold’s rally?
Four factors have contributed to gold’s recent run:
1. Central banks have been steadily increasing their gold reserves – collectively buying more than 1,000 tonnes per year since 2022.
2. Inflation has been high – but not high enough for central banks to raise interest rates further. That means real interest rates (interest rates adjusted for inflation) aren’t too high. Holding gold then becomes more attractive because the opportunity cost of owning a non-yielding asset like gold is reduced. So, if cash and bonds are offering lower real return after inflation, investors may prefer owning gold.
3. Stock market jitters have also supported the gold price. Much of this has to do with geopolitical uncertainty around tariffs and trade wards. On top of that, tech stocks and risk assets have rallied strongly for the past few years. Investors are concerned about a bigger stock market correction, and may be rotating more capital into the gold instead.
4. Strong technicals are also something to consider. Gold started this year with eight up weeks in a row. It then saw a one-week correction in late February, before carrying on higher. The chart below shows how gold’s 20-week moving average (blue line) has sloped upward since late 2023 – a sign of bullish momentum. The moving average tracks gold’s average weekly closing price for the past 20 weeks, and updates each week. Notice how it’s acted as a price floor for gold over the past year.
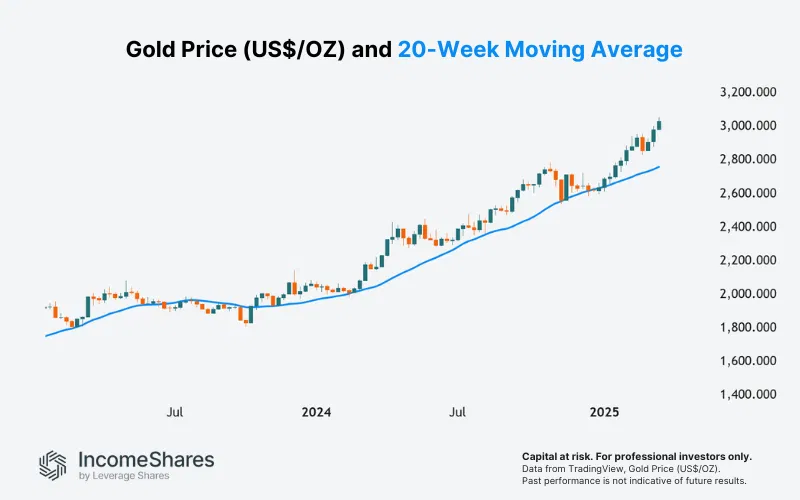
However, it’s worth pointing out that the gold price is now quite high above its 20-week moving average. That may warrant some short-term caution.
GLDI vs. gold: performance since launch
The IncomeShares Gold+ Yield Options ETP (GLDI) launched in July 2024. It holds SPDR® Gold Shares (GLD) and sells out-of-the-money call options to potentially generate monthly income.
The next chart compares the total returns for GLDI vs. GLD from launch until the first trading day of March. For GLDI, total return is the income distribution yield plus any changes in the net asset value (NAV).
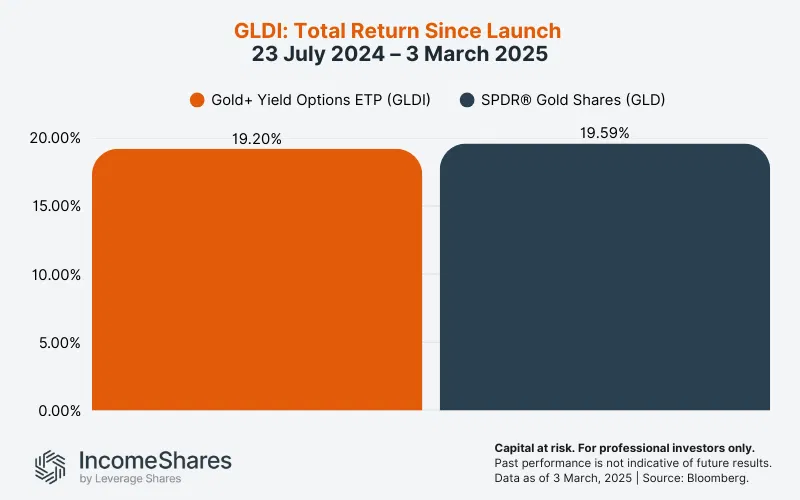
So far, GLDI has slightly underperformed GLD. GLDI has returned 19.2% over the period while GLD has gained 19.59%. However, this makes sense given gold’s rally and the GLDI strategy.
GLDI uses a covered call strategy: it sells “out-of-the money” call options on GLD, while holding GLD itself. This approach has potential trade-offs in strong bull markets:
More income potential: Bull markets can mean more demand for call options as investors take on more bullish bets. This demand may make call options more expensive (higher premiums) for call option buyers. But for call option sellers (like in the GLDI covered call ETP), that may mean more income potential.
Capped growth potential: When the gold price moves above the option’s strike price, GLDI must sell GLD shares at that strike price. This may cap growth beyond the strike price.
Of course, bull runs don’t last forever – GLDI and GLD’s performance varies with market conditions.
Gold has continued rallying in March, up another 5% or so. GLDI’s updated return will be known at month-end, once its latest monthly distribution yield is factored in.
Key takeaways
- Gold has had a strong rally, recently trading above $3,000 per ounce.
- GLDI has delivered returns close to GLD since launching in July 2024, while generating monthly income.
- Covered calls may enhance income but may limit gains in strong bull markets.
Il tuo capitale è a rischio se investi. Potresti perdere l’intero investimento. Consulta l’avviso completo sui rischi qui.
Prodotti correlati:

Strategia
Covered Call
Rendimento da
cedole
13.44%