
Auteur
Jonathan Hobbs, CFA
Date
20 Feb 2025
Catégorie
Market Insights
Gold’s Seven-Week Streak: Momentum or Warning Sign?
Votre capital est exposé à un risque si vous investissez. Vous pouvez perdre la totalité de votre investissement. Veuillez consulter l’avertissement complet sur les risques ici
Gold has been on a tear recently. It’s up around 13% this year, and about 60% since the start of 2023. Last week, gold closed its seventh straight green week – a rare streak that’s only happened eight times in the past 25 years. But historically, these rallies have often been followed by pullbacks of varying sizes. Meanwhile, prices are hugging the upper Bollinger Band on the weekly chart, signaling increased volatility.
What does all this mean for gold? Here’s what the data suggests.
Gold’s rare multi-week rallies
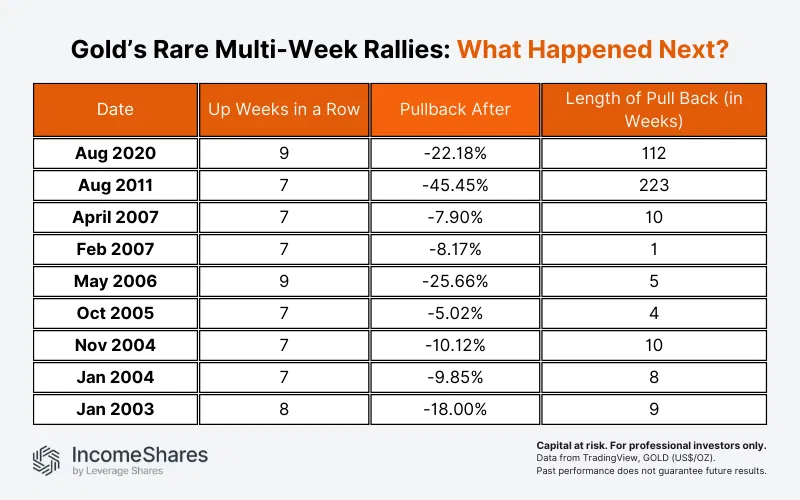
Gold has seen multi-week winning streaks before. Each time, it eventually reversed course, with pullbacks ranging from 5% to 45%.
- August 2020: Gold gained for nine straight weeks, then dropped 22% over the next two years.
- August 2011: After seven weeks up, gold fell 45% over the next four years.
- January 2002: An eight-week run led to an 18% drop in just nine weeks.
The table below shows the times gold saw seven or more weeks of upside in a row, dating back 25 years. Based on the data (TradingView, ticker: GOLD US$/OZ), gold’s average correction was 16.9% over 42 weeks. Of course, there are no guarantees gold will follow the same pattern this time.
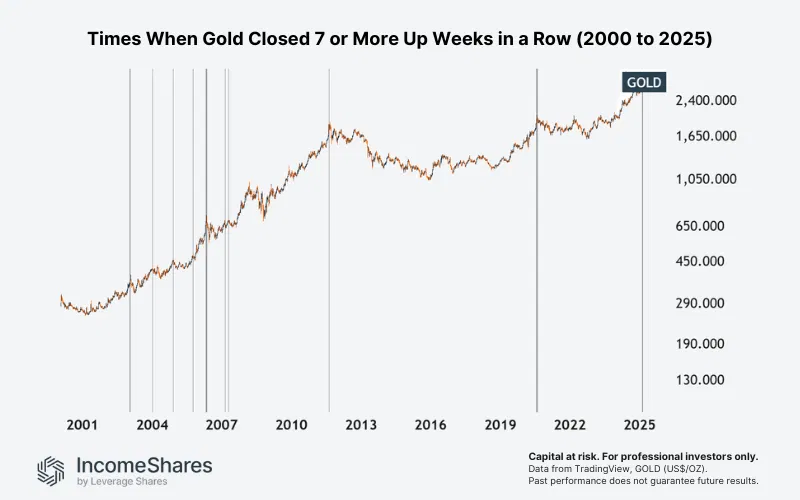
The chart below also shows gold’s seven-week plus rallies (and subsequent pullbacks). Note how most of these happened when gold was in a strong upward trend.
Gold’s volatility is picking up
From a technical perspective, another key factor is rising volatility. Gold is currently hugging the top Bollinger Band on the weekly chart (below). Bollinger Bands measure volatility relative to a 20-week simple moving average (middle band). When the bands expand, it indicates higher volatility.
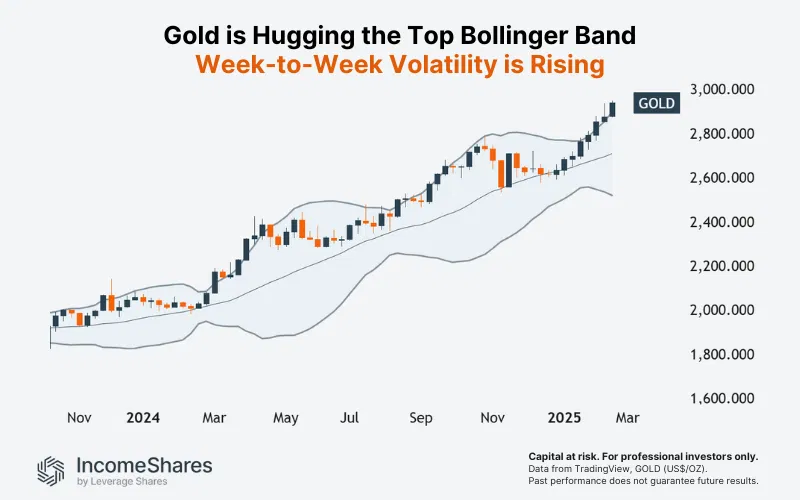
Right now, gold is near the upper band – meaning volatility is rising to the upside. While this can signal strength, it can also lead to short-term swings in price. High volatility isn’t always sustainable.
Why is gold running?
Several macro factors could be driving gold’s rally:
- Central bank demand: China and other central banks have been buying gold aggressively, adding steady demand.
- Inflation concerns: Sticky inflation and policy risks have investors looking for hedges.
- Geopolitical uncertainty: Ongoing global tensions have increased the demand for safe-haven assets like gold.
These factors are keeping gold elevated, but that doesn’t mean there won’t be corrections.
Gold and Income Options ETPs
Options-based income strategies can provide a different way to gain exposure to gold while generating potential yield. The IncomeShares Gold+ Yield ETP seeks to provide partial upside exposure to gold while generating monthly income by selling out-of-the-money call options on the SPDR® Gold Shares ETF.
Key takeaways
- Gold’s seven-week rally is rare. Historically, similar streaks have often been followed by pullbacks.
- Upside volatility is increasing, as gold trades near the upper Bollinger Band.
- Macro factors may support gold, but income-focused strategies can help manage volatility.
Votre capital est exposé à un risque si vous investissez. Vous pouvez perdre la totalité de votre investissement. Veuillez consulter l’avertissement complet sur les risques ici
Produits associé:

Stratégie
Covered call
Rendement des
distributions
12.16%