
Author
Jonathan Hobbs, CFA
Date
27 Apr 2026
Category
Martket Insights
How Our Tesla Options ETP Performed Under Two Strategies
Your capital is at risk if you invest. You could lose all your investment. Please see the full risk warning here.
Tesla just reported earnings. So, now would be a good time to gauge the performance of our IncomeShares Tesla Options ETP (TSLI, which trades in USD). This article compares TSLI under two separate strategies: the covered call and cash-secured put plus equity.
All data is from Bloomberg. Total returns assume reinvested income.
TSLI with a covered call strategy
TSLI launched in July 2024 on the London Stock Exchange with a covered call strategy. This was a natural starting point for launching one of Europe's first single-stock options income ETPs. Covered calls are one of the most established options income approaches, and more "vanilla" than other strategies.
The covered call strategy had two parts: it held Tesla shares, and sold call options on those shares. Each week, TSLI collected fees for selling the calls – known as premiums. TSLI aimed to pay these premiums out to investors as monthly income.
A call option has a strike price – the level at which the buyer has the right to buy Tesla shares. If Tesla stayed below the strike price, the call expired unused, and TSLI kept the premium.
If Tesla rose above the strike, TSLI had to sell shares at the strike price. It still kept the premium, but it gave up any stock gains above the strike. That capped the upside when Tesla rallied hard.
The chart below shows the total returns of TSLI (orange) against Tesla stock (black) under the covered call strategy. That ran from launch (24 July 2024) until 1 August 2025.
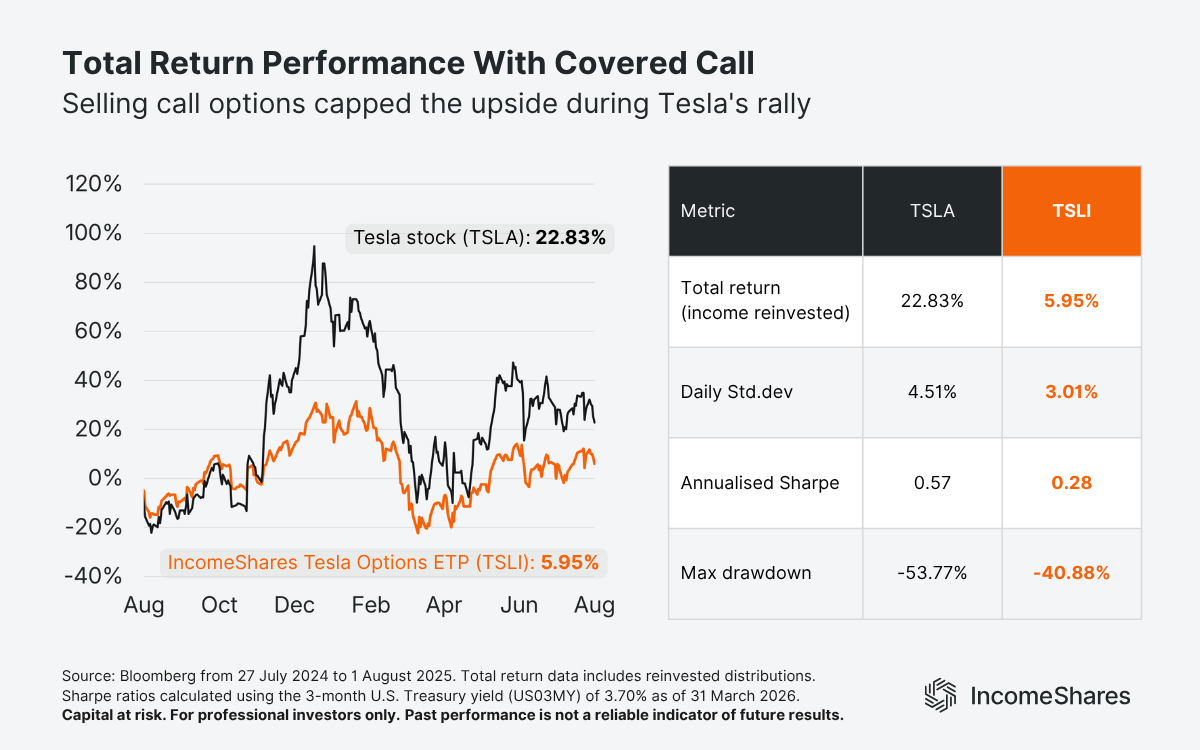
Tesla returned 22.83% over this time, while TSLI returned just 5.95%. Tesla rallied strongly at times, and the upside cap limited how much TSLI could gain.
TSLI was less volatile, though. Its daily standard deviation – a measure of daily price swings – was 3.01%, against 4.51% for Tesla. TSLI's max drawdown – the biggest peak-to-trough loss during the period – was -40.88%, compared to -53.77% for Tesla.
On a risk-adjusted basis, TSLI still lagged Tesla. Its annualised Sharpe ratio – a measure of return relative to risk – was 0.28, against 0.57 for Tesla.
TSLI with cash-secured put plus equity
In August 2025, we switched TSLI to a cash-secured put plus equity strategy. We believe this may suit single stocks better than the original covered call. Single stocks can move a lot on earnings or news – and the new strategy may capture more of that upside potential.
This strategy also has two parts. TSLI holds about 25% of its value in Tesla shares, and sells put options on the rest.
A put option gives the buyer the right to sell Tesla stock at a set strike price. TSLI collects a premium upfront for each put sold.
If Tesla rises, the put options may expire unused and TSLI keeps the premium. The 25% in Tesla shares may also gain value. Unlike a covered call, there's no strike price capping how much those shares can gain.
If Tesla falls, TSLI may need to buy more shares at the strike price. The premium collected upfront can help offset some of that cost.
The chart below shows the total returns of TSLI (orange) against Tesla stock (black) under the new strategy. Our data runs through Friday 1 August 2025 under the old covered call. For the cash-secured put plus equity, it runs from Monday 4 August 2025 to 31 March 2026
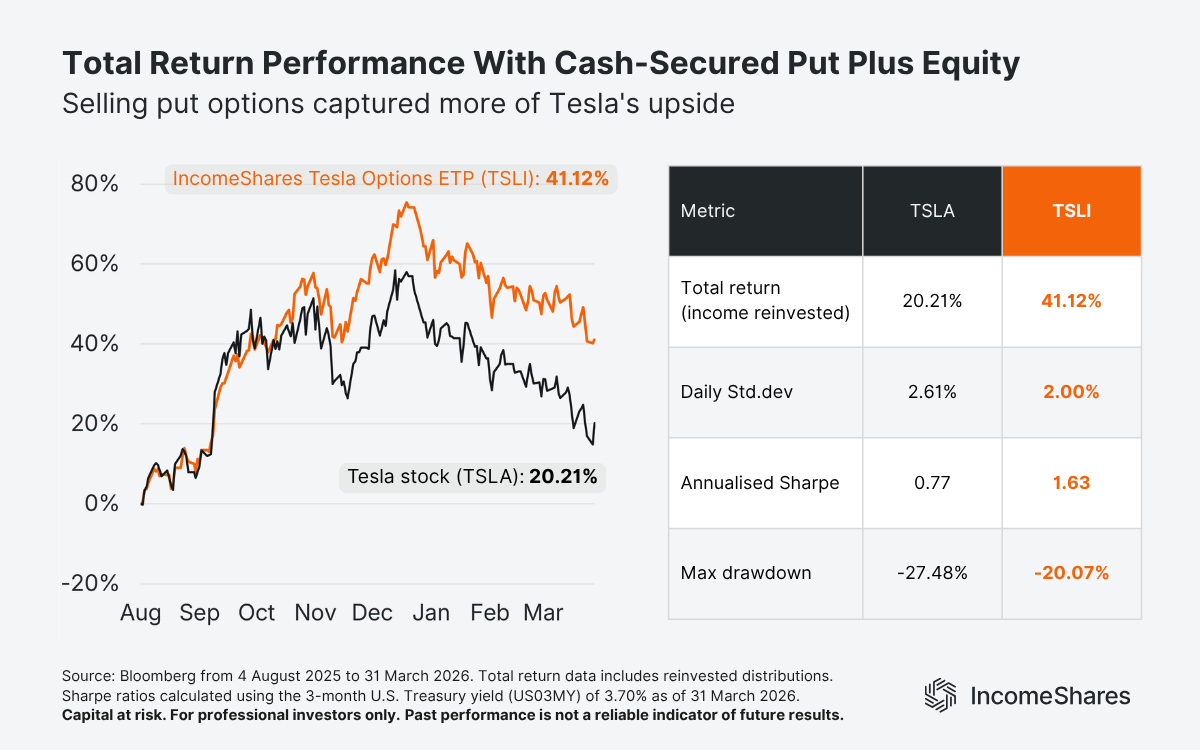
TSLI returned 41.12% over this period, while Tesla returned 20.21%. TSLI beat the stock and paid income along the way.
TSLI was also less volatile. Its daily standard deviation was 2.00%, against 2.61% for Tesla. TSLI's max drawdown was -20.07%, compared to -27.48% for Tesla.
On a risk-adjusted basis, TSLI also came out ahead. Its annualised Sharpe ratio was 1.63, against 0.77 for Tesla.
A few caveats to keep in mind
The two periods cover different lengths of time, and Tesla also traded differently under each one. Under the covered call, Tesla had a deep drawdown and a big rally – which hurt TSLI's relative return. Under the new strategy, Tesla was more steady – which may have helped TSLI's numbers.
A different market could produce different results.
Three things to remember
Under a covered call (July 2024 to August 2025), TSLI returned 5.95%. Tesla returned 22.83%.
Under cash-secured put plus equity (August 2025 to March 2026), TSLI returned 41.12%. Tesla returned 20.21%.
The two periods had different market conditions. Past performance is not a reliable indicator of future results.
Your capital is at risk if you invest. You could lose all your investment. Please see the full risk warning here.
Related Products:

Strategy
Cash-Secured Put + Equity
Distribution Yield
52.24%

Strategy
Cash-Secured Put + Equity
Distribution Yield
72.04%

Strategy
Basket of Income-generating ETPs
Distribution Yield
37.64%