

Author
Jonathan Hobbs, CFA
Date
03 Aug 2026
Category
Education
Higher Implied Volatility Doesn't Always Mean Higher Income
Your capital is at risk if you invest. You could lose all your investment. Please see the full risk warning here.
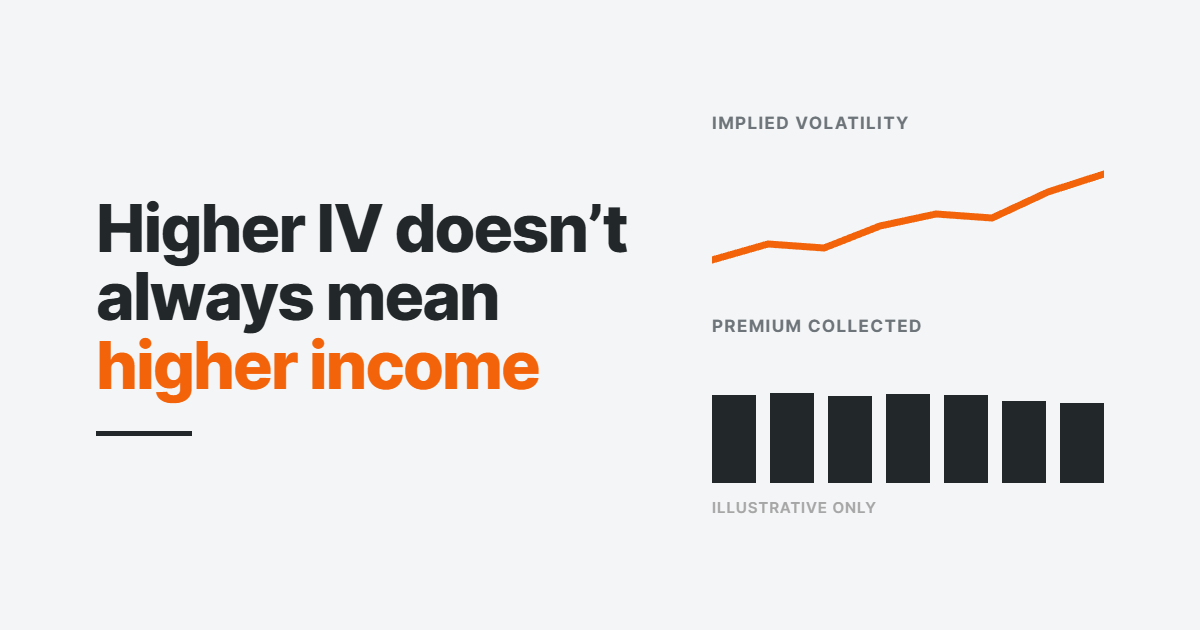
IncomeShares aims to generate income for investors by selling options across our exchange-traded products (ETPs). When implied volatility (IV) rises, it's natural to expect a bigger income payout from the strategy. Implied volatility can affect option premiums, but the link isn't one to one.
This article explains what a general IV reading shows, and why it can't predict a distribution on its own.
Note: This article is a general explanation of how implied volatility relates to options income. It's not a comment on any specific IncomeShares distribution.
What an implied volatility reading can and can't tell you
Implied volatility is the market's estimate of how much an asset could move, taken from option prices. When traders expect bigger swings, options can cost more, so higher IV generally supports higher premiums (all else equal).
The catch is that everything else rarely stays equal. Implied volatility varies by strike price and expiry date – it isn't one number for the whole market.
Why a general IV reading may not match the options we trade
The IV line on a trading screen is usually a standardised measure. Interactive Brokers' Trader Workstation (TWS) platform, for example, shows a 30-day "at-market" IV estimate. That's the expected volatility of options with strike prices near the current market level. Other platforms may calculate theirs differently.
The standardised measure IV may not describe the options we sell, for three main reasons:
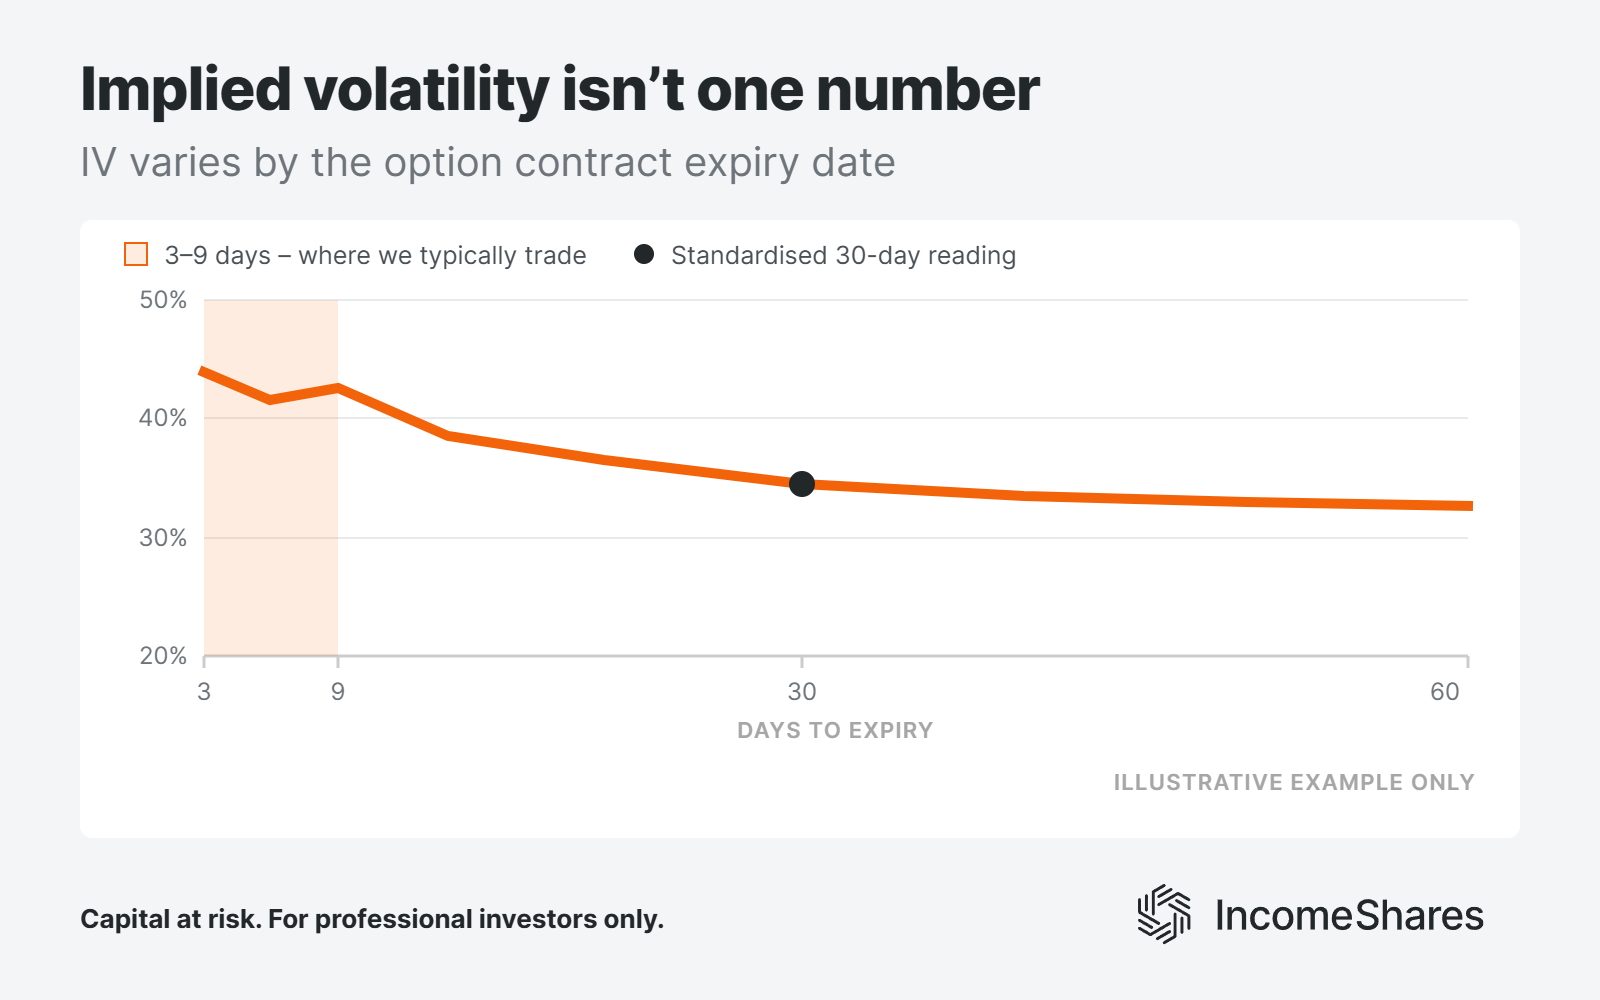
First, we typically trade options with three to nine days left to expiry – not 30. An option's price includes "time value" – the extra amount buyers pay for the time it has left to run. More time means more chance for the market to move, so buyers tend to pay more for it. With only a few days left, there's less time value to sell, so premiums are generally smaller by that time.
Second, the standardised figure is based on options with strike prices near the market level. We typically sell options at strike prices further away. Each strike price carries its own IV, so the premiums on our options can behave differently from the headline IV number.
Third, a standardised reading blends many contracts into one number. It can move higher while the premium on the specific contract we're trading moves lower.
The chart below shows how the 30-day reading compares with the expiries we typically trade.
What drives the options income we collect
Beyond the option contract itself, two parts of our trading process affect the income we collect: the execution and the rolling.
Execution near the close
We typically pick our strike prices roughly 20 to 30 minutes before the market closes. Execution then usually runs through a 30-second "time-weighted average price" (TWAP) order. A TWAP splits the trade into smaller pieces rather than executing at one single price.
If the underlying asset moves in those final minutes, the strike price and premium can differ from the targets.
Rolling more than 100 positions
We currently manage over 100 individual option positions across our funds. Each position has a "resting order" – an order we place in advance.
Let's say we sell an option and collect $1 of premium. If that option later gets 80% cheaper to buy back (at $0.20), the resting order buys it back automatically. We paid $0.20 to close a position that paid us $1 – so we keep the $0.80 difference as profit.
If the target hits, the position closes early. We then "roll" it – sell a new option with a later expiry date. The rest generally roll on a set schedule before expiry.
Hypothetical example: a seven-day trade vs a three-day trade
The figures below are hypothetical and don't represent an actual IncomeShares trade or distribution.
Both trades below sell "out-of-the-money" call options – the strike price is above where the asset currently trades. The further above, the cheaper the option generally becomes. The table below shows the two trades side by side.
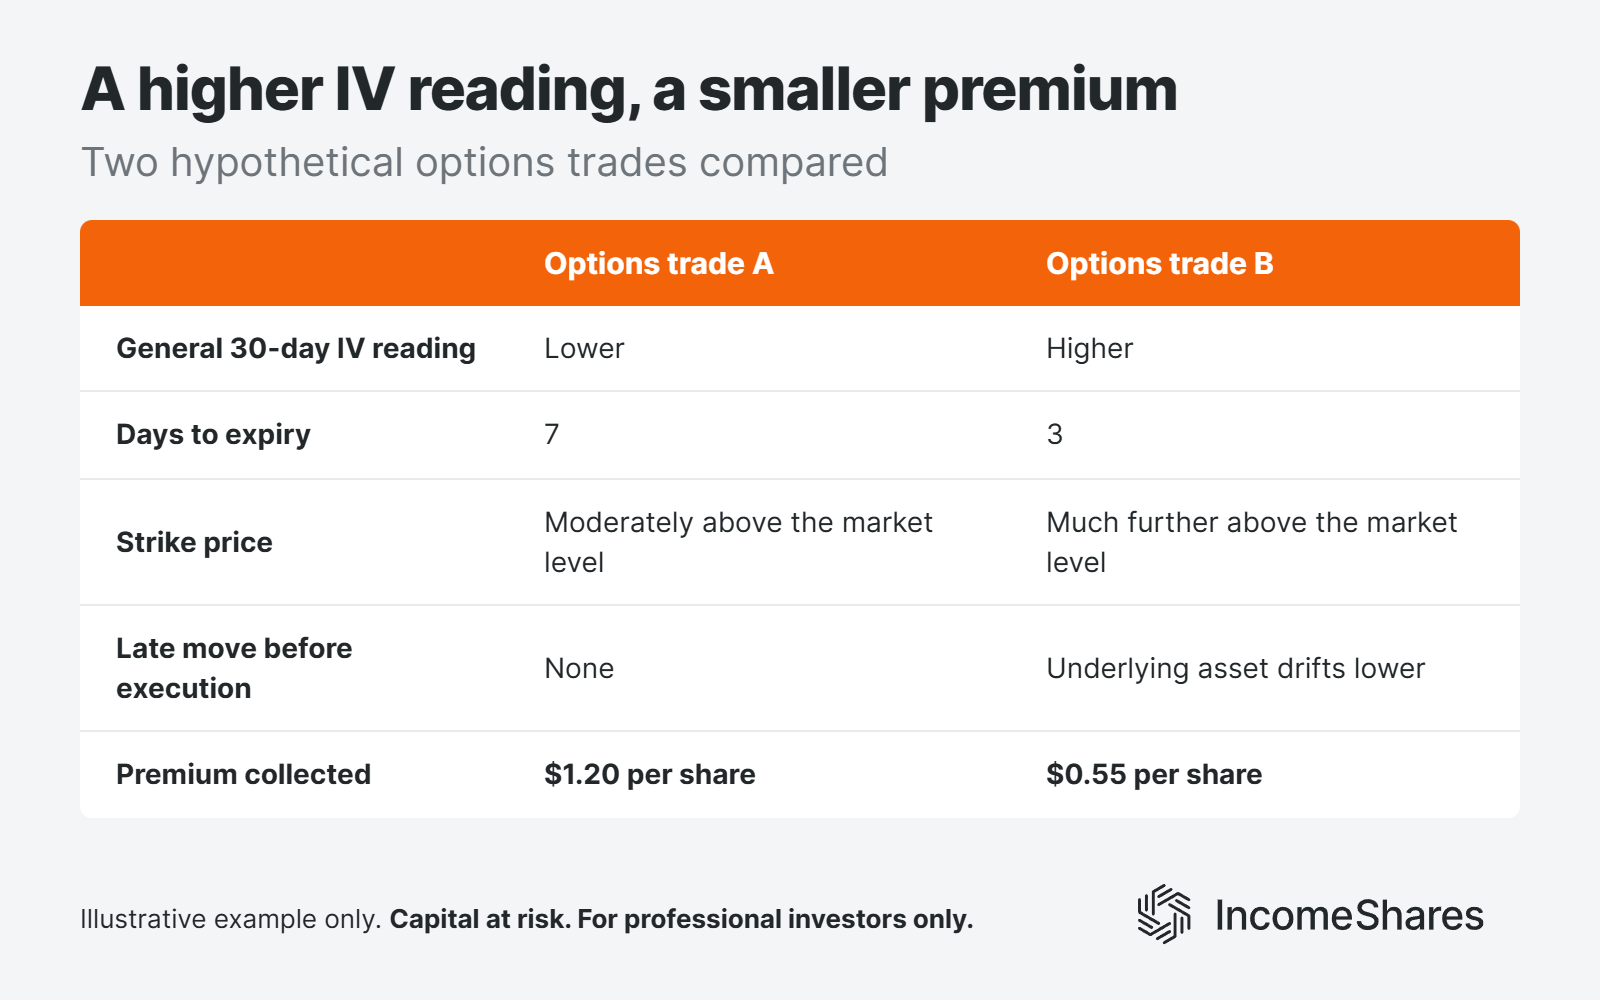
Despite the higher IV reading, options trade B collected the smaller premium. The other factors – a shorter expiry, a further strike price, and the late move – outweighed it. That's why a higher reading doesn't always mean higher income.
Three things to remember
Higher implied volatility generally supports higher option premiums (all else equal) – but all else rarely stays equal.
A general IV reading often describes a standardised measure, not the specific option contracts an income strategy trades.
A distribution reflects many positions across many trading days, so one IV chart can't predict or fully explain it.
Your capital is at risk if you invest. You could lose all your investment. Please see the full risk warning here.
Related Products:

Strategy
Cash-Secured Put + Equity
Distribution Yield
52.66%

Strategy
Cash-Secured Put + Equity
Distribution Yield
43.84%

Strategy
Cash-Secured Put + Equity
Distribution Yield
27.43%

Strategy
Covered Call
Distribution Yield
13.01%

Strategy
Basket of Income-generating ETPs
Distribution Yield
37.05%

Strategy
Basket of income strategies on leading AI stocks
Distribution Yield
67.06%

Strategy
LS SpaceX Options-Based Income Strategy
Distribution Yield
68.95%

Strategy
LS Memory Options-Based Income Strategy
Distribution Yield
78.06%