

Author
Jonathan Hobbs, CFA
Date
09 Sep 2026
Category
Market Insights
Options Income ETPs in a Down Market: 12 Real Examples
Your capital is at risk if you invest. You could lose all your investment. Please see the full risk warning here.
Twelve IncomeShares exchange-traded products (ETPs) hold an underlying asset that has fallen since launch. That gives us real data on options income ETPs in a down market, rather than theory. This article explains how each of those ETPs performed against its underlying asset.
How selling options may soften a fall
Our ETPs hold some exposure to an underlying asset and sell options on it. The option buyer pays the ETP a fee up front, called a premium. That premium stays in the ETP whatever the asset's price does next. We aim to pay it to investors as monthly income distributions. An income distribution is the cash payment an ETP makes to investors who hold it, and it may vary.
All of our ETPs except three use a cash-secured put plus equity strategy. They hold around 25% of their value in the underlying asset and sell put options on the rest. A put option gives its buyer the right to sell us the asset at a set strike price. If the price falls below that strike, we may have to buy more of the asset at the strike. That strike is then above the market price. But the premiums we collect from selling options may help offset that difference.
The other three, Gold+ Yield, Silver+ Yield, and 20+ Year Treasury Options, use a covered call strategy instead. They hold the asset and sell call options on it, which may cap some of the upside. In both strategies, the premium has tended to offset part of a fall in the underlying asset. It can't offset all of it, since the ETP still holds the asset.
That's the theory. The twelve examples below show how each ETP performed against its underlying asset when that asset fell.
12 options income ETPs in a down market
All twelve comparisons use total return, with daily price data from Bloomberg. Total return counts the change in the ETP's net asset value (NAV) plus every income distribution, reinvested when it's paid. That's the fair test, because each income distribution lowers the NAV when it's paid to investors. The option premiums form part of the NAV until they're paid out, so the price alone understates the return.
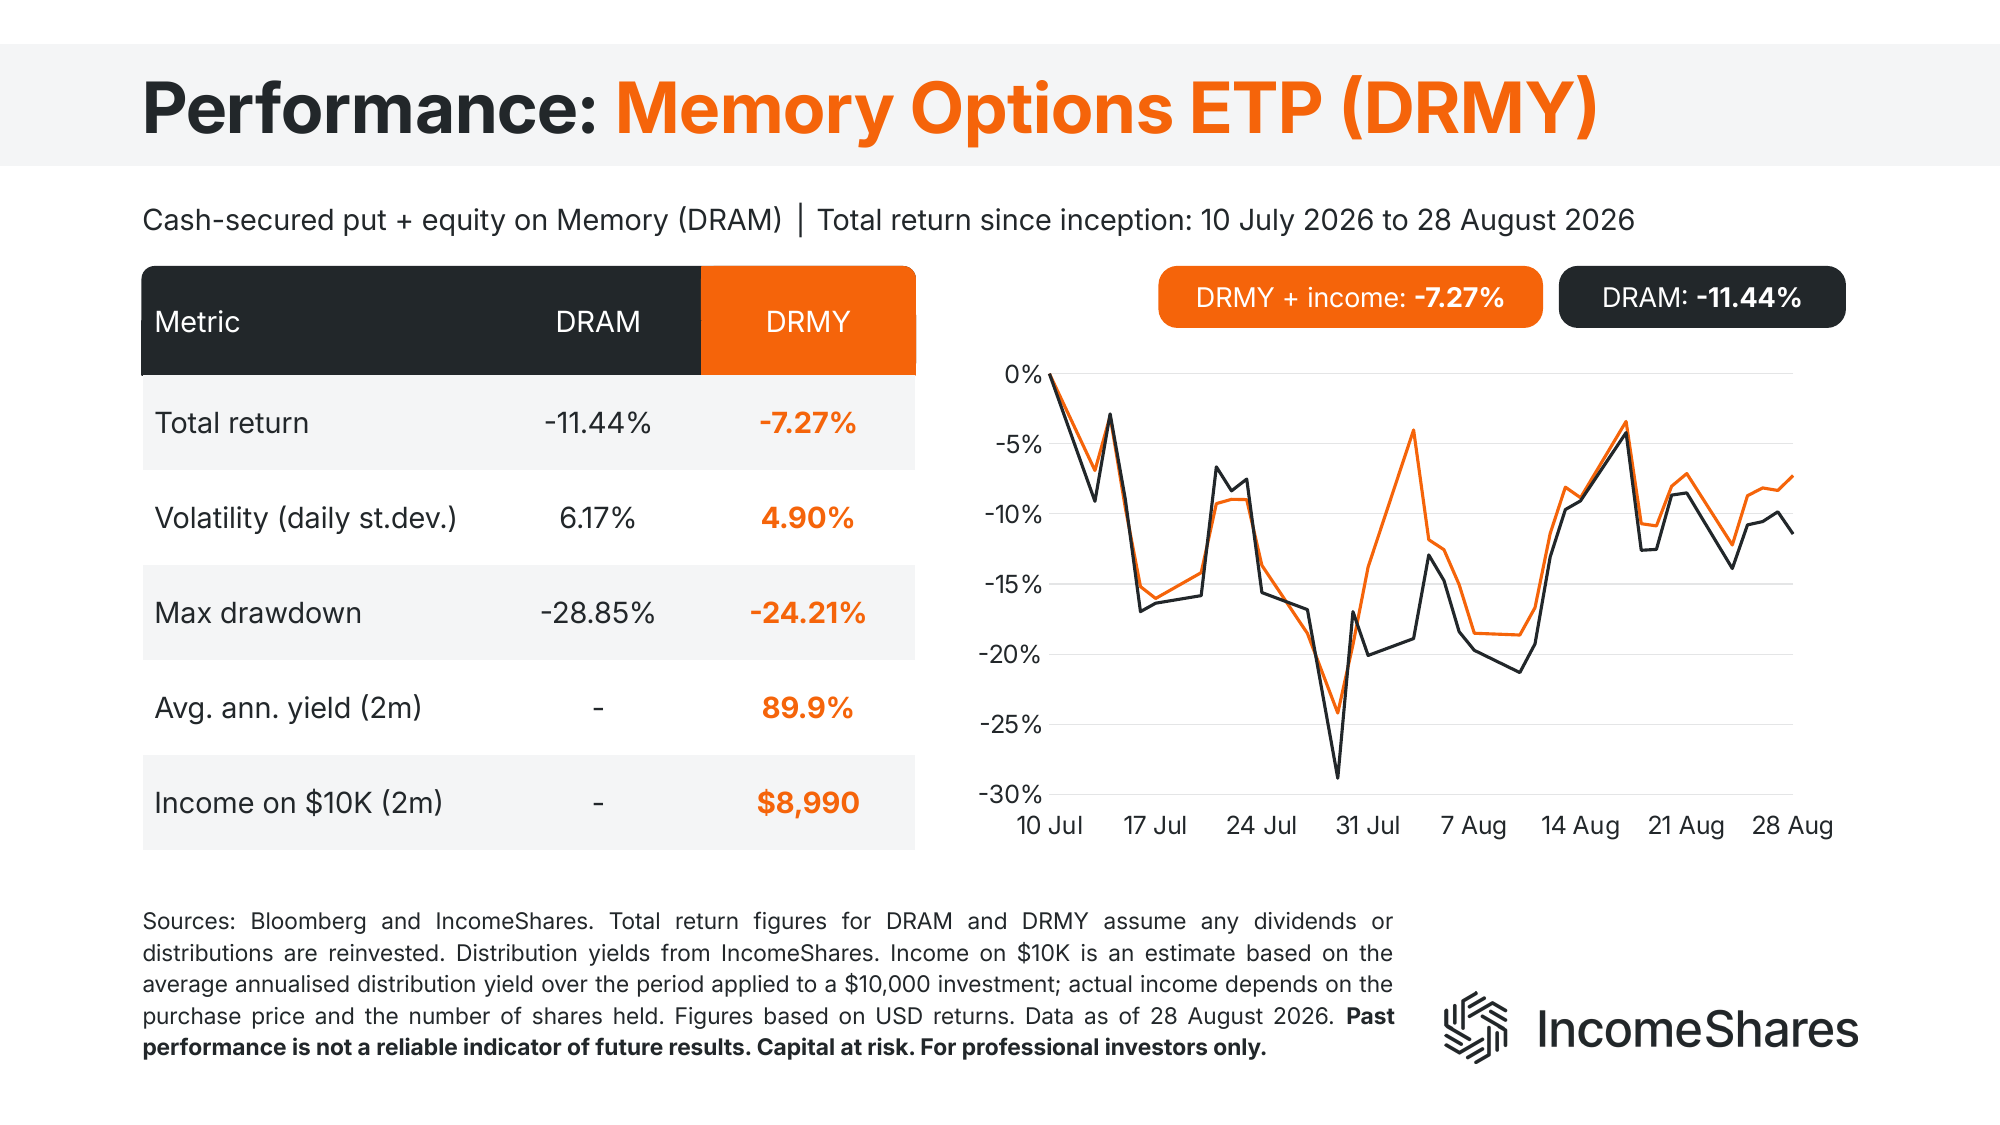
The data runs from each ETP's launch to the August month end (28 August 2026). Each chart also shows the daily volatility, the largest peak-to-trough fall, and the distribution yield. Nine of the twelve ETPs lost less than their underlying asset, and all twelve had lower daily volatility.
Seven single-stock ETPs where the share price fell
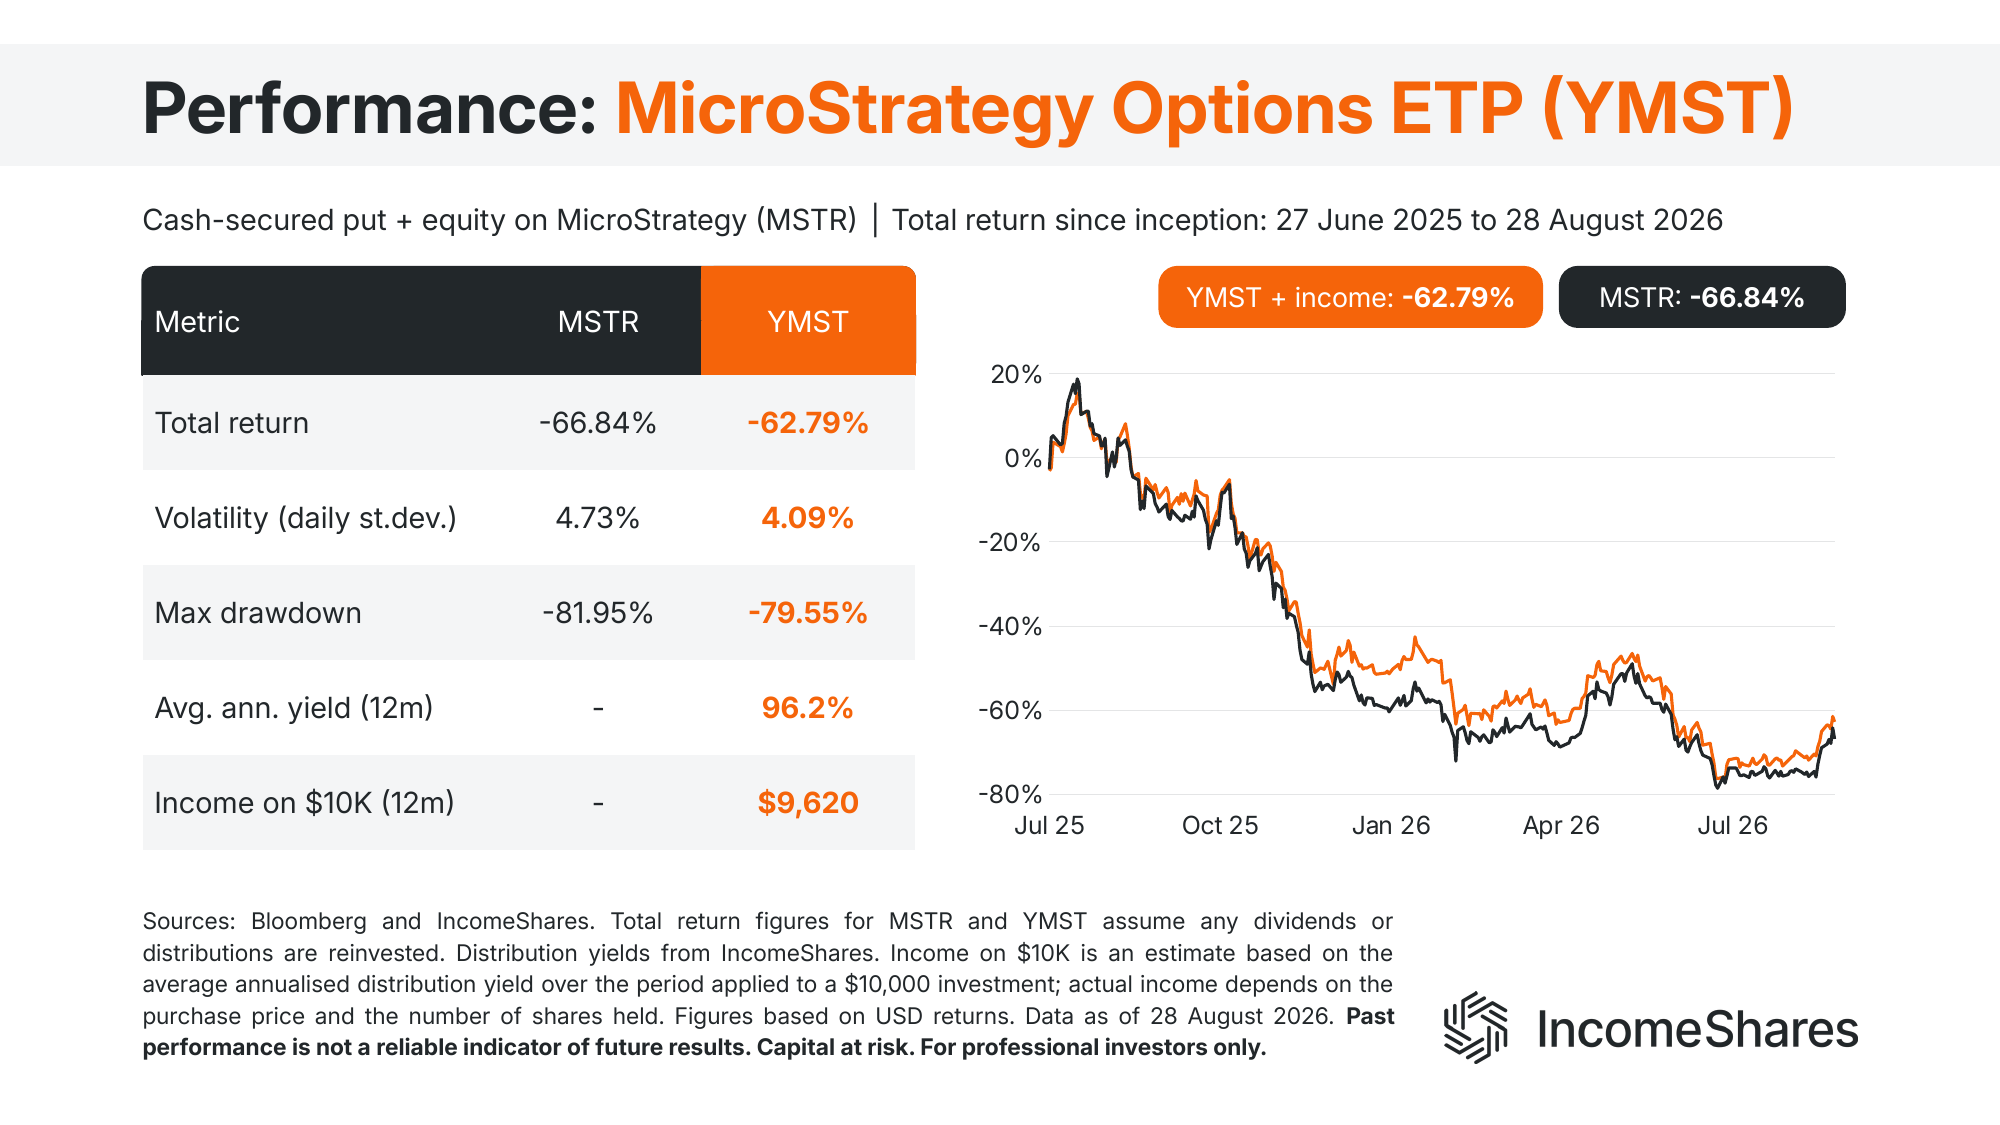
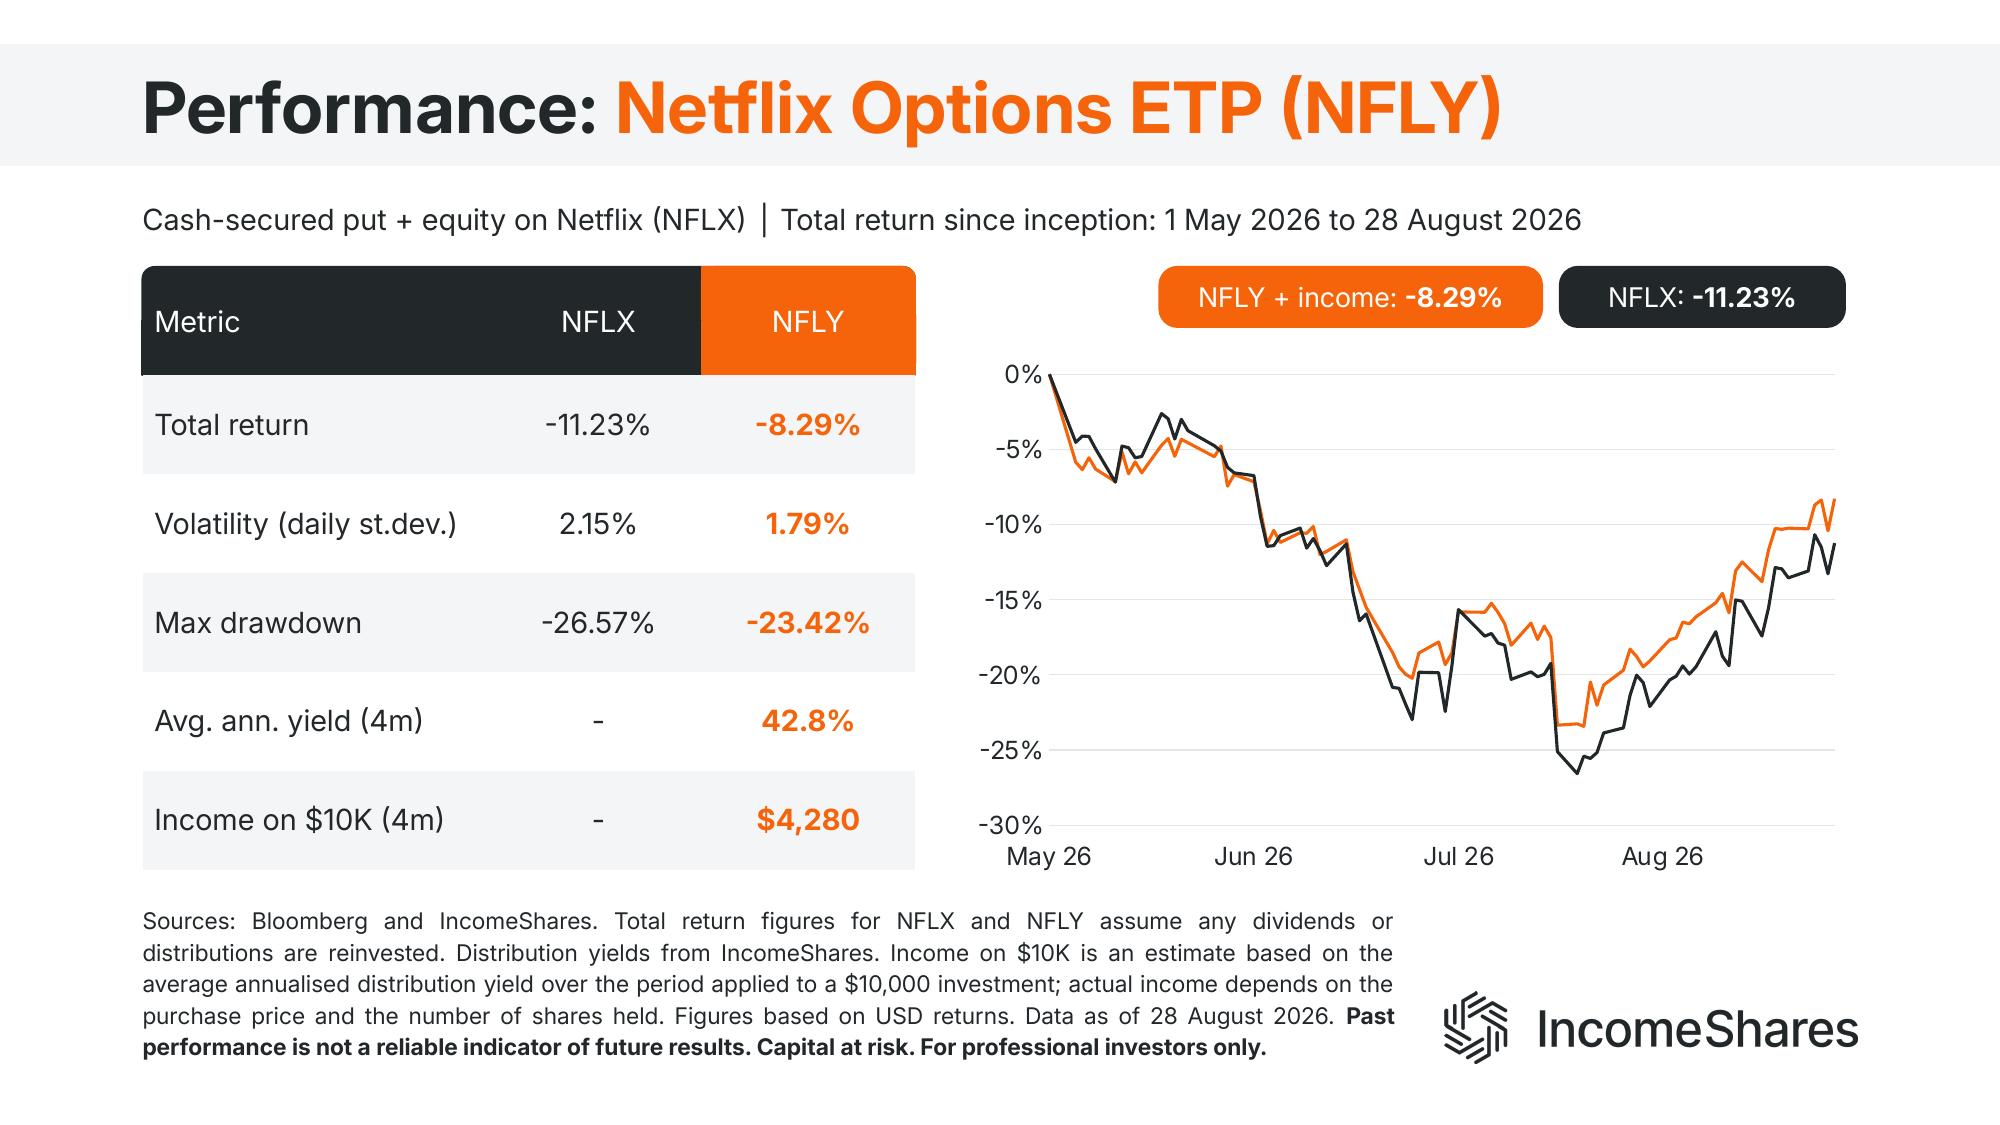
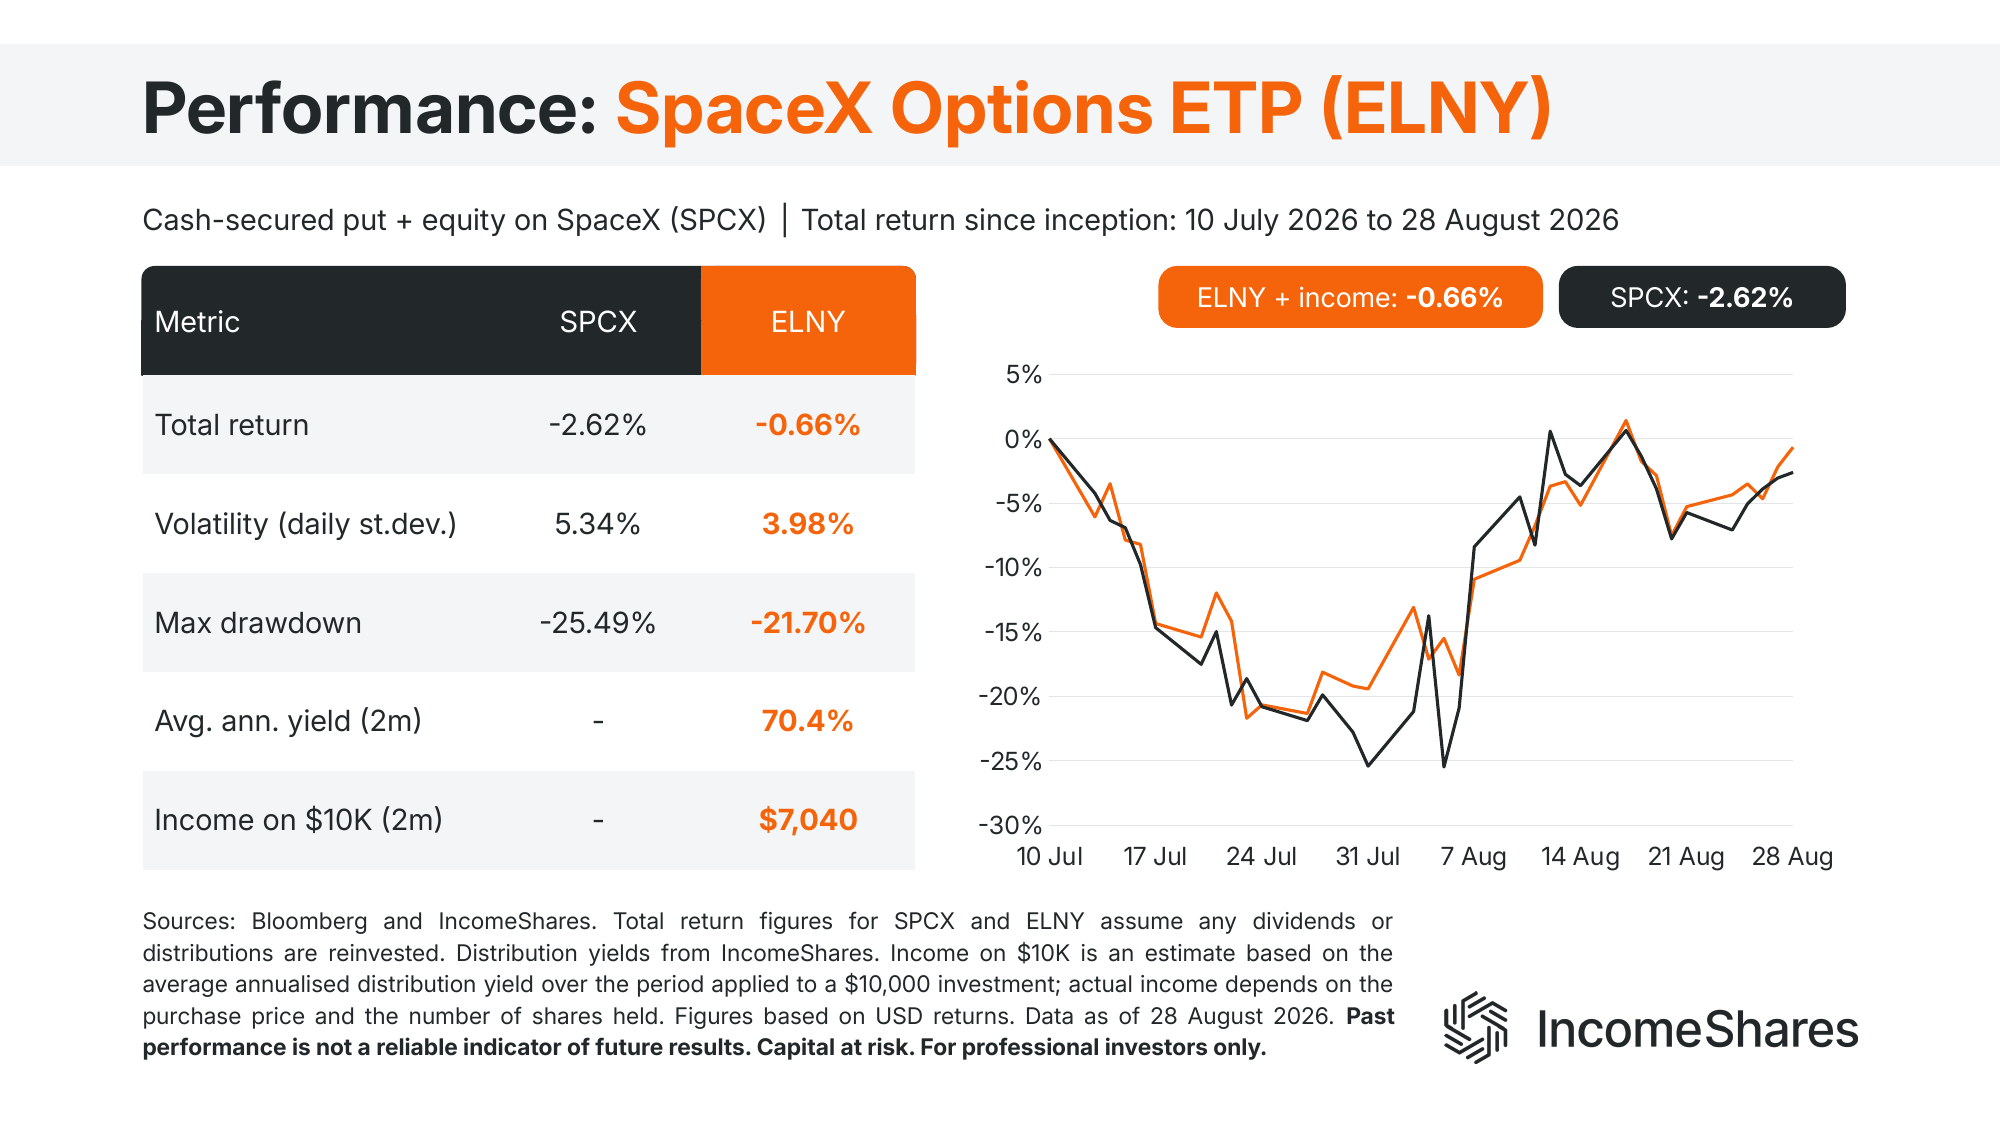
Our MicroStrategy Options ETP (YMST) saw the largest fall in its underlying asset. MicroStrategy (MSTR) lost 66.84% from the ETP's launch on 27 June 2025, and YMST lost 62.79% with income reinvested. Four percentage points is a small cushion against a fall that size. That's despite an average annualised distribution yield of 96.2% over the past 12 months. Our Netflix, SpaceX, and Memory Options ETPs show the more typical pattern. Each ETP followed the share price down, and the premiums shaved two to four percentage points off the decline.
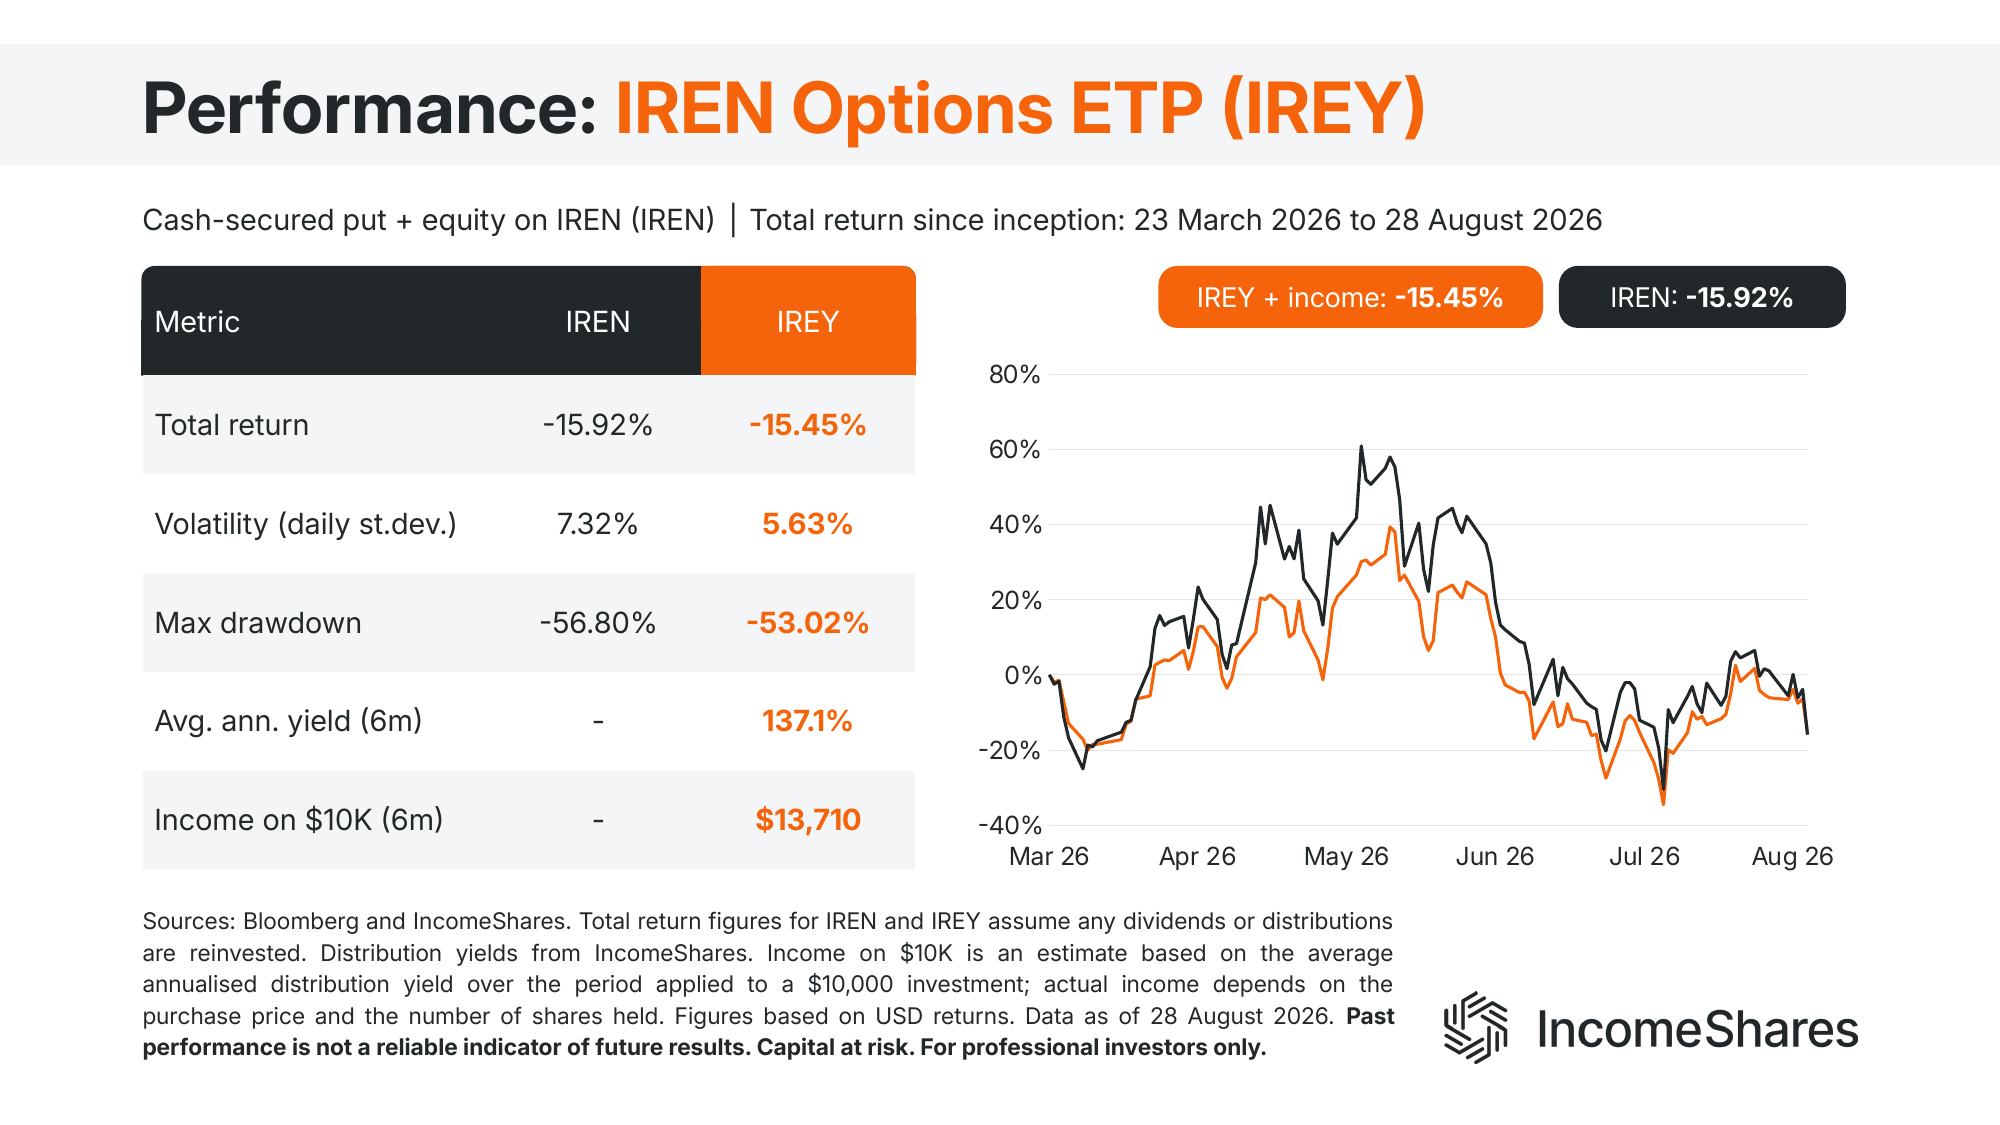
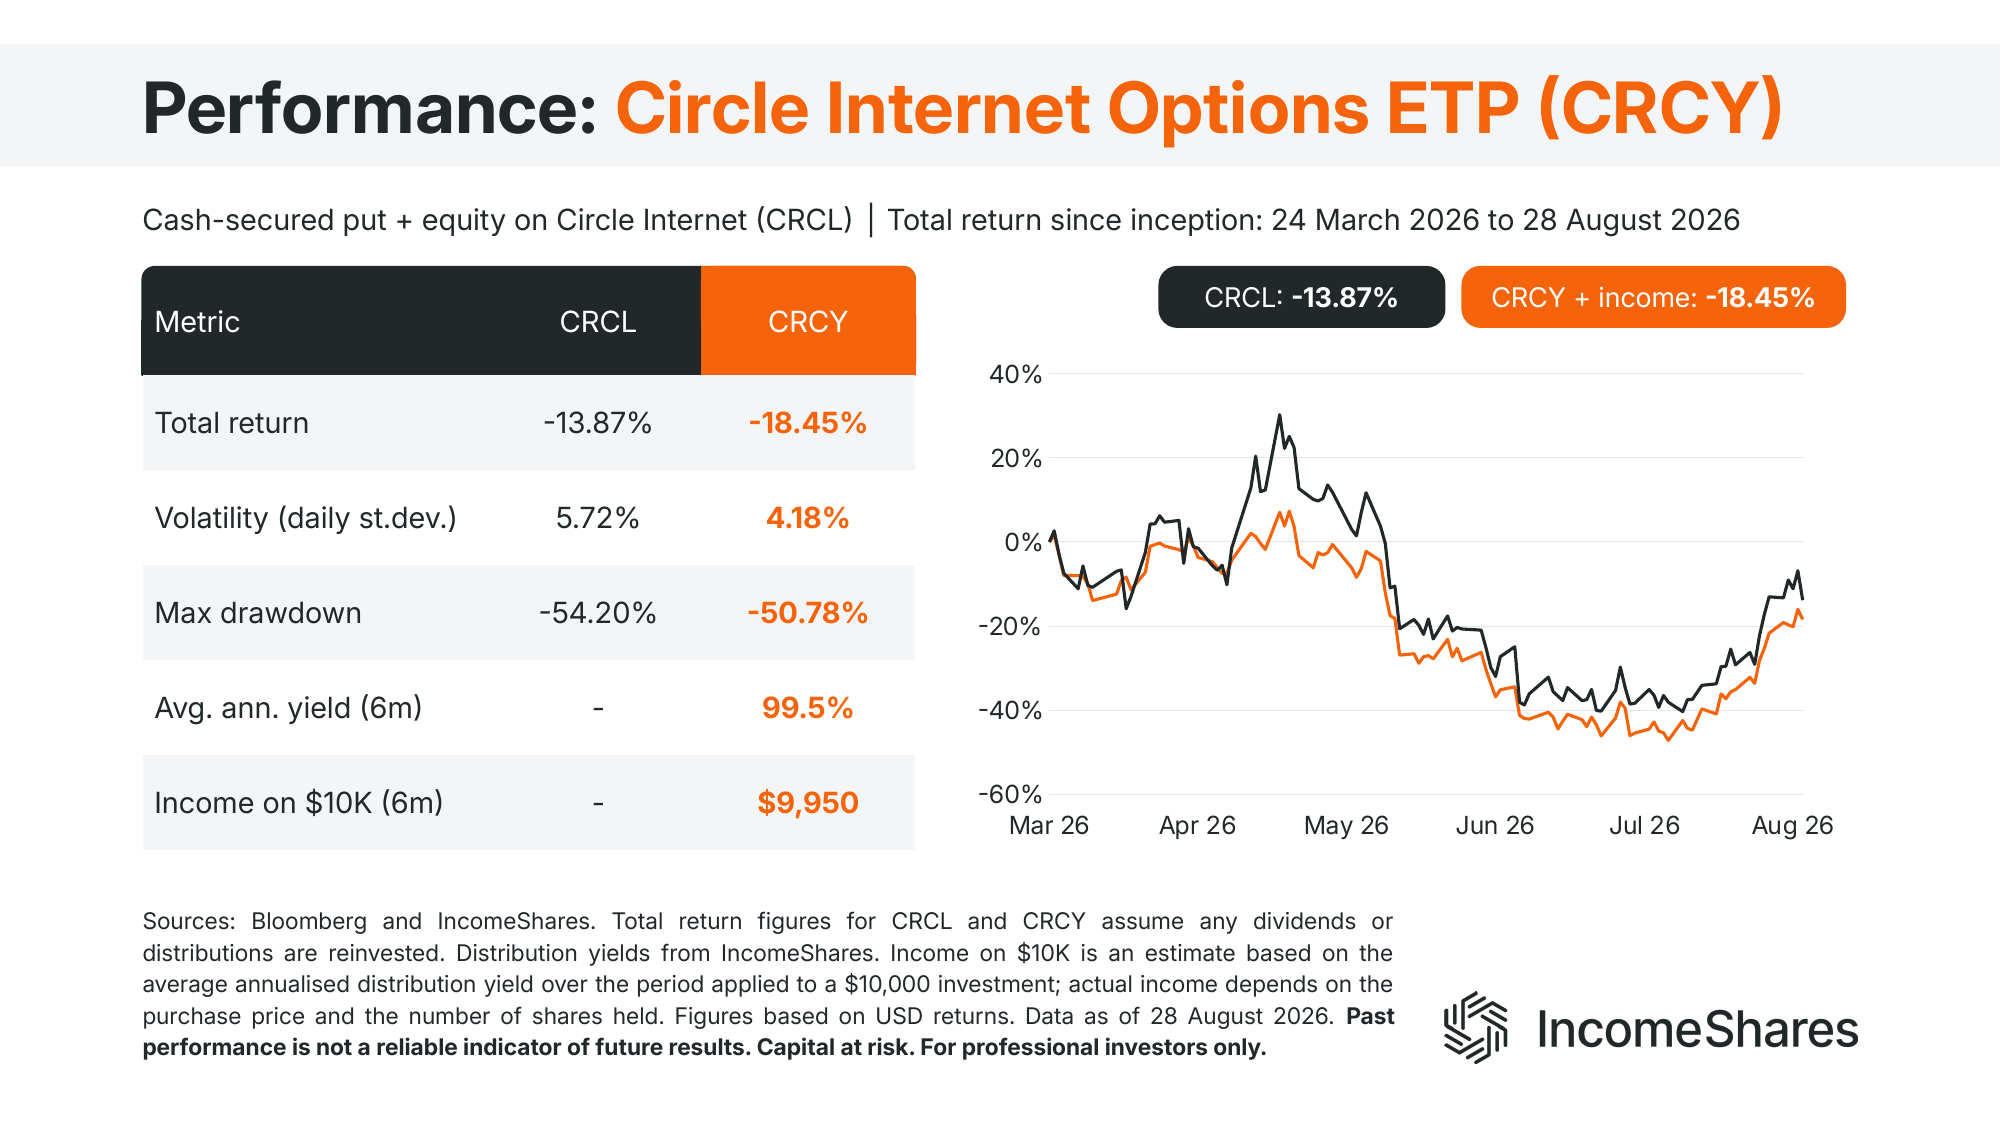
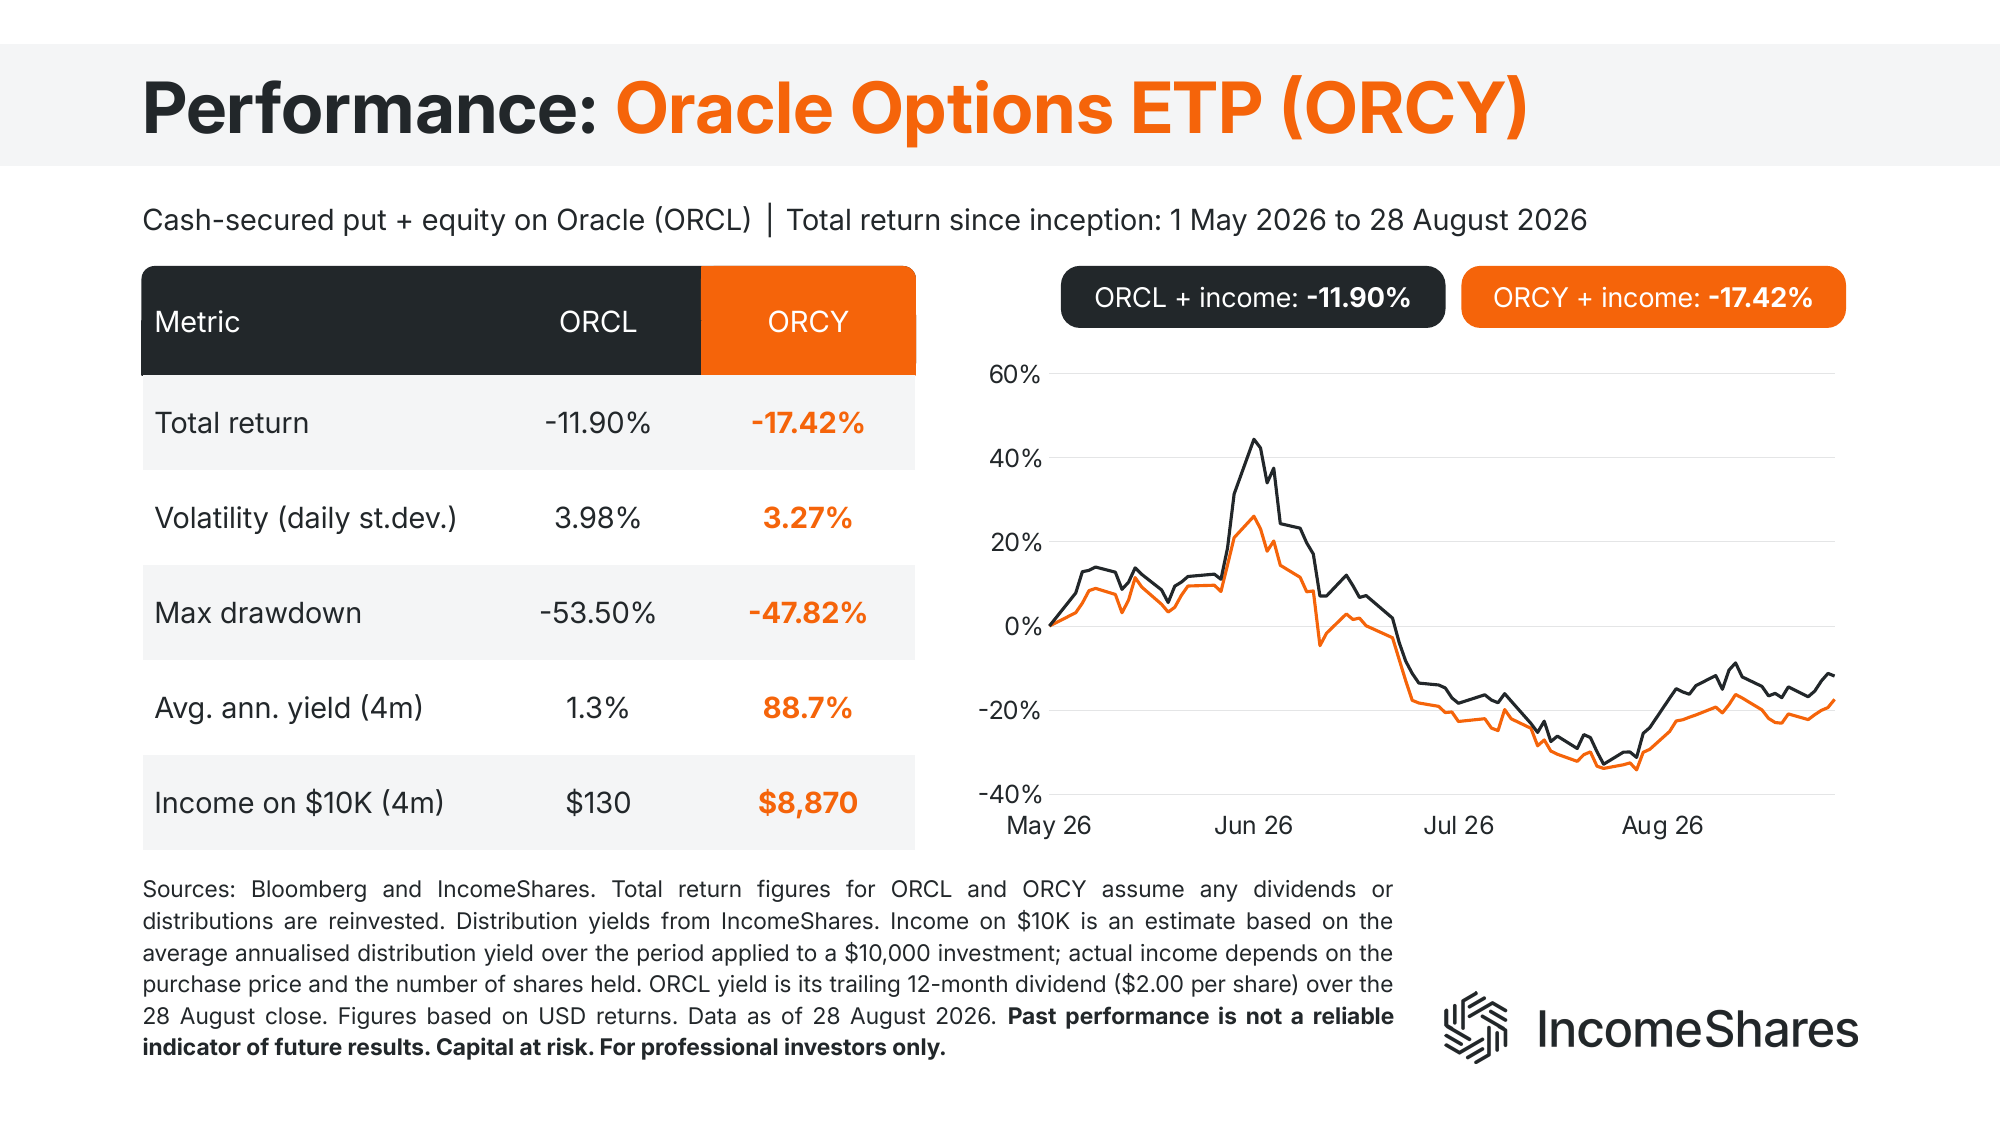
Our IREN, Circle Internet, and Oracle Options ETPs tell a different story. All three shares rallied after the ETPs launched, by 30% to 60%, and then gave it all back. A put-selling ETP can capture less of a rally than the share, so each began its fall lower down. IREN's ETP finished half a percentage point ahead of the share. Circle Internet's and Oracle's finished 4.6 and 5.5 percentage points behind. A rally followed by a full reversal has been the worst sequence for this strategy.
Four ETPs on uranium, oil, blockchain, and Treasuries
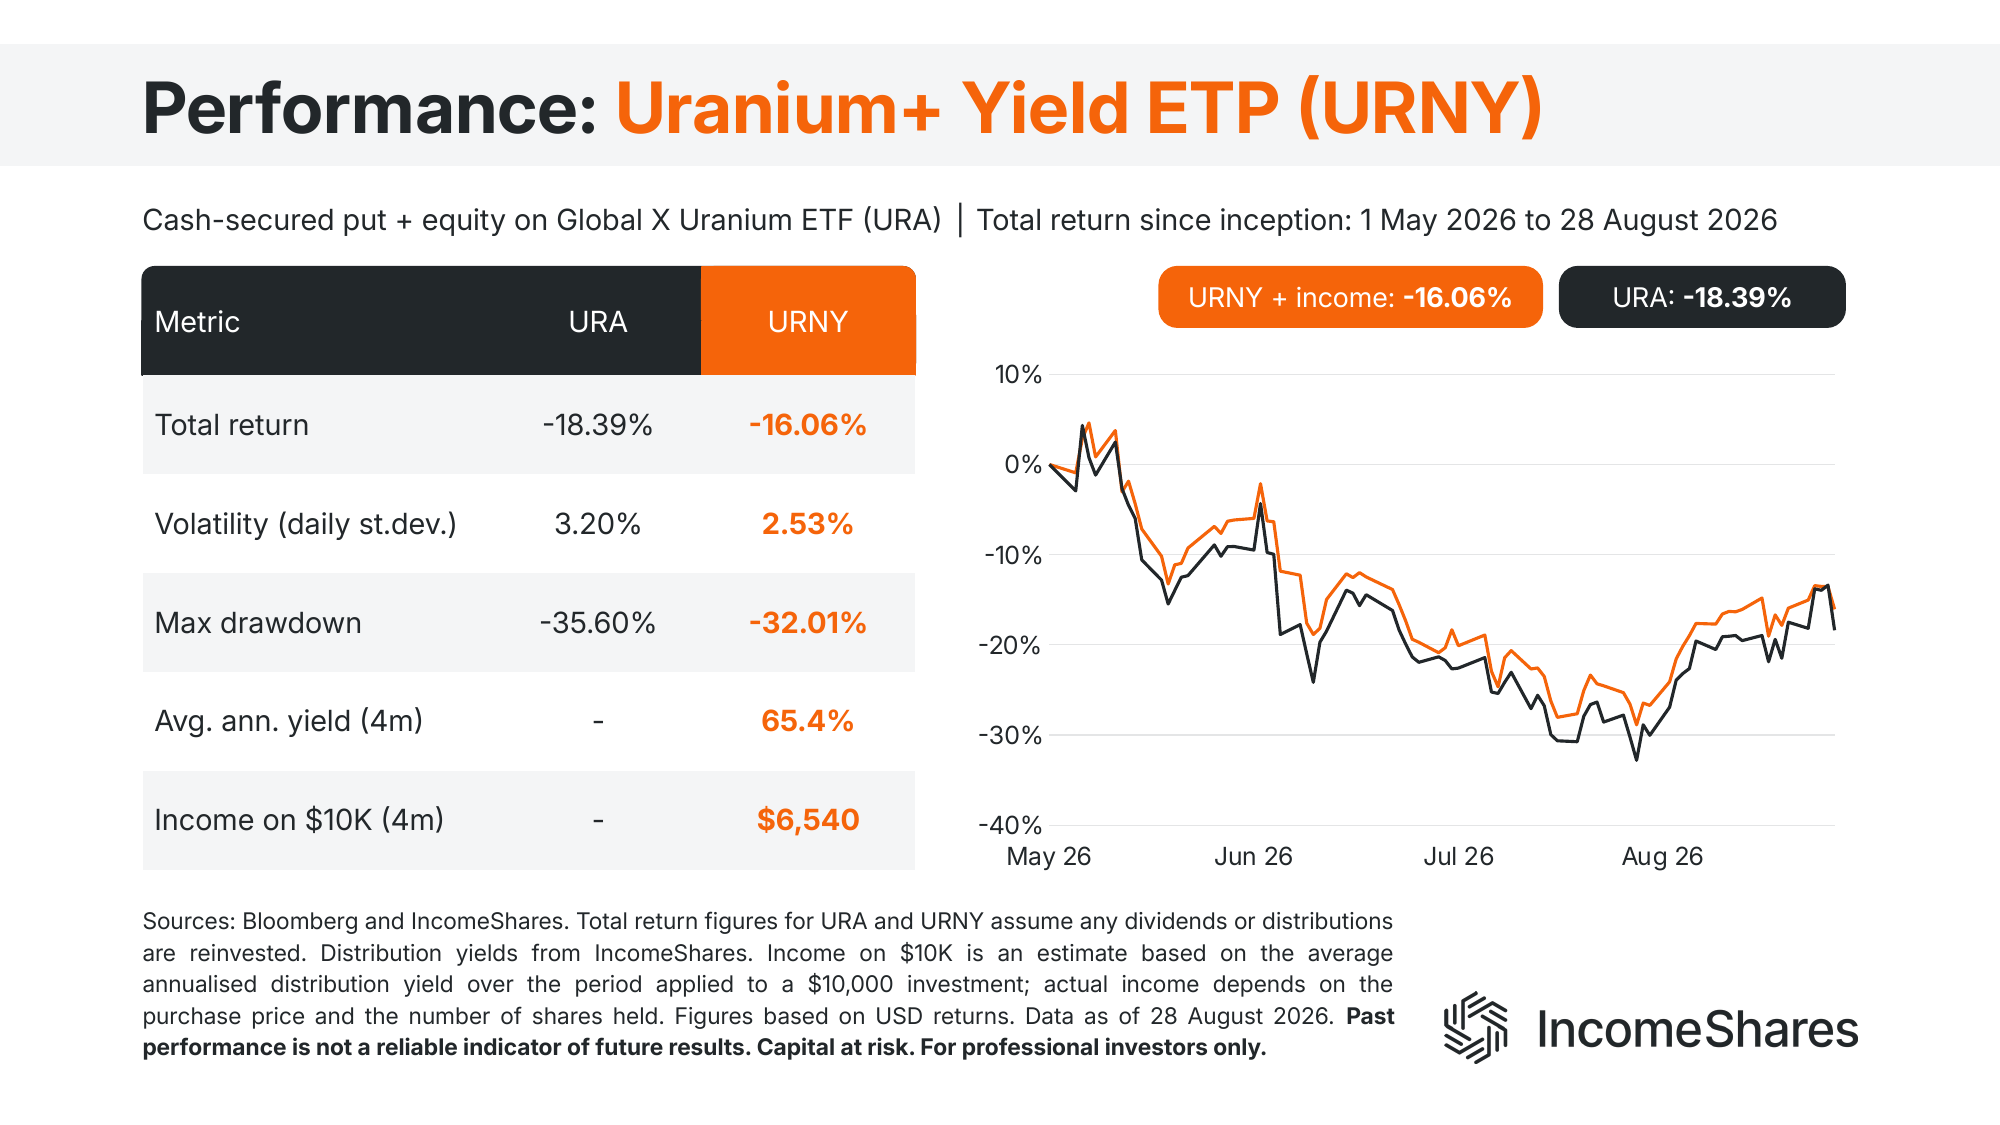
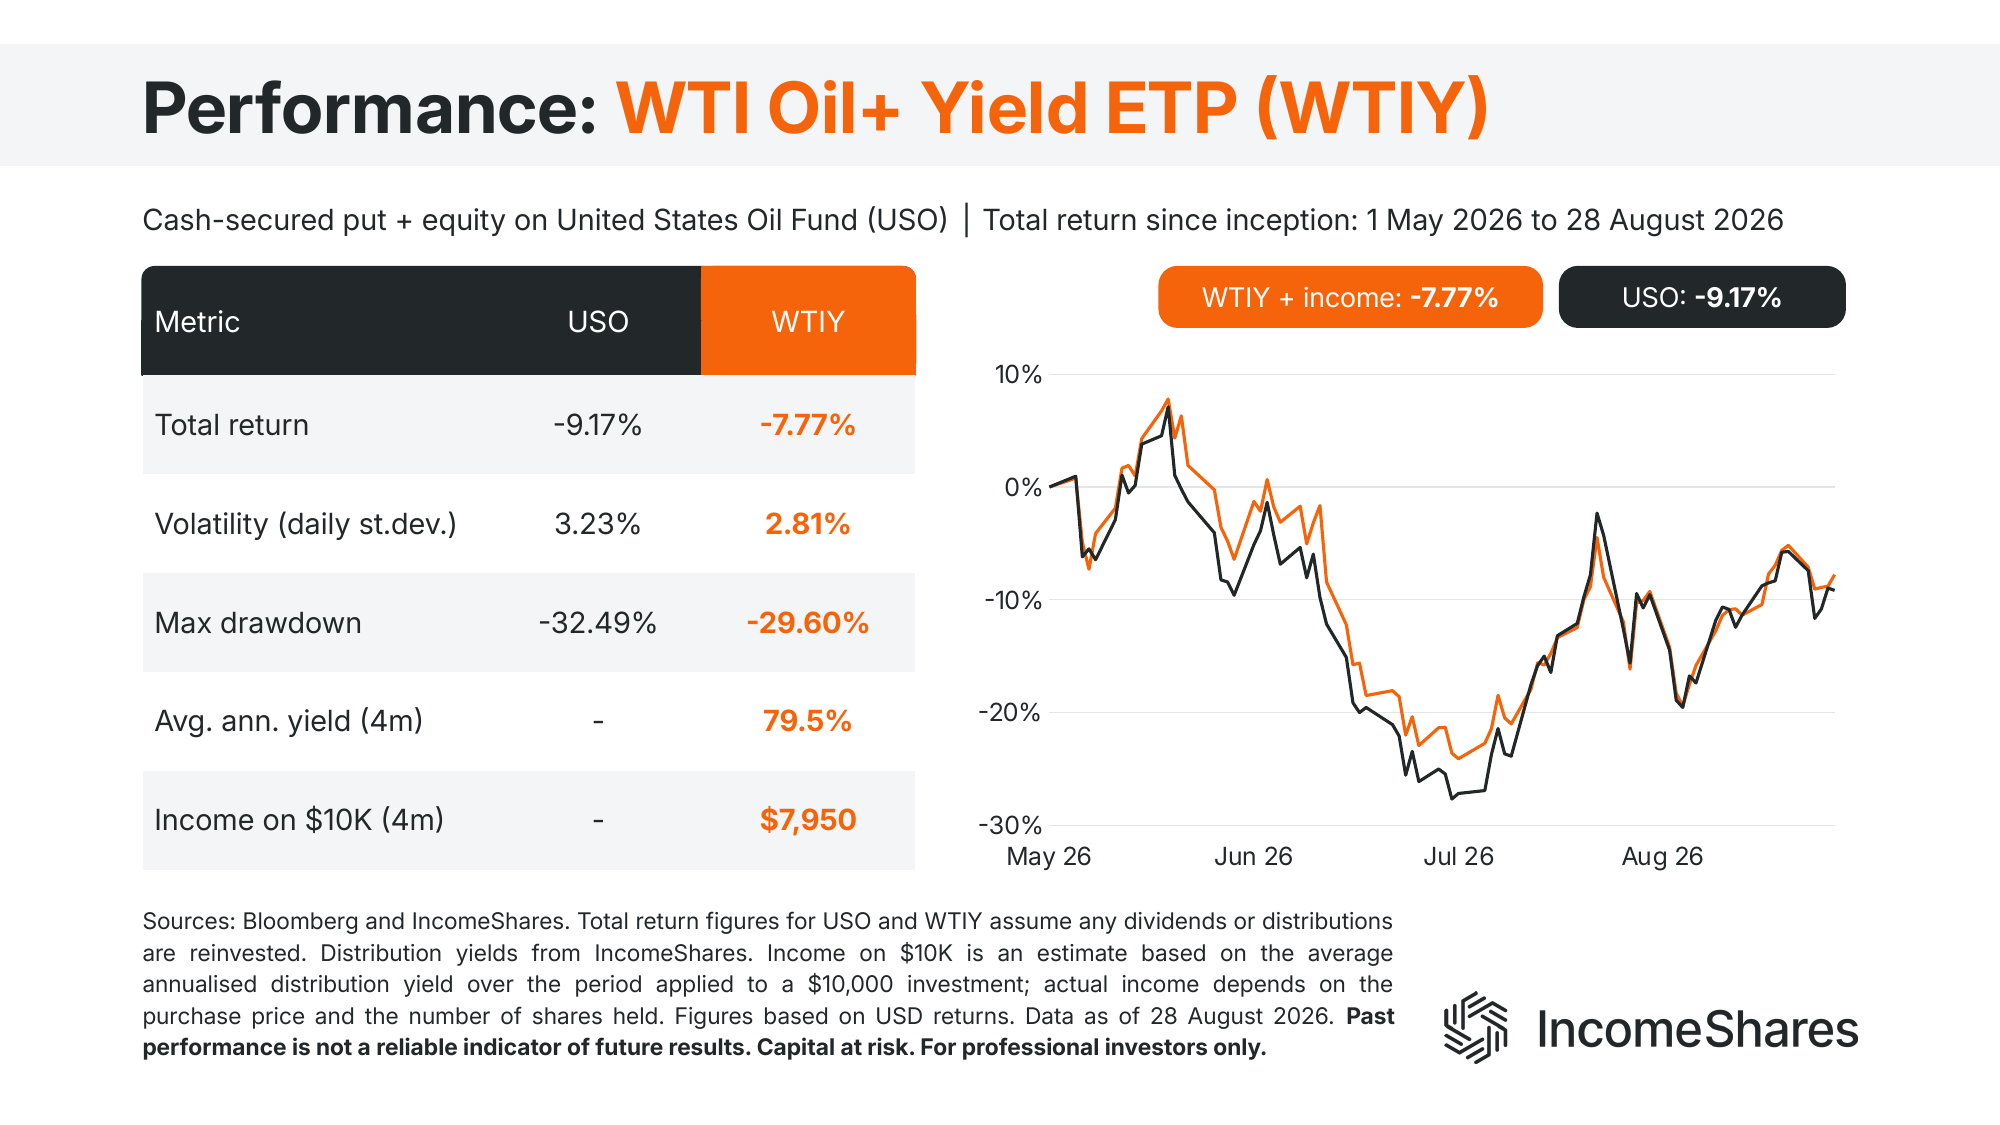
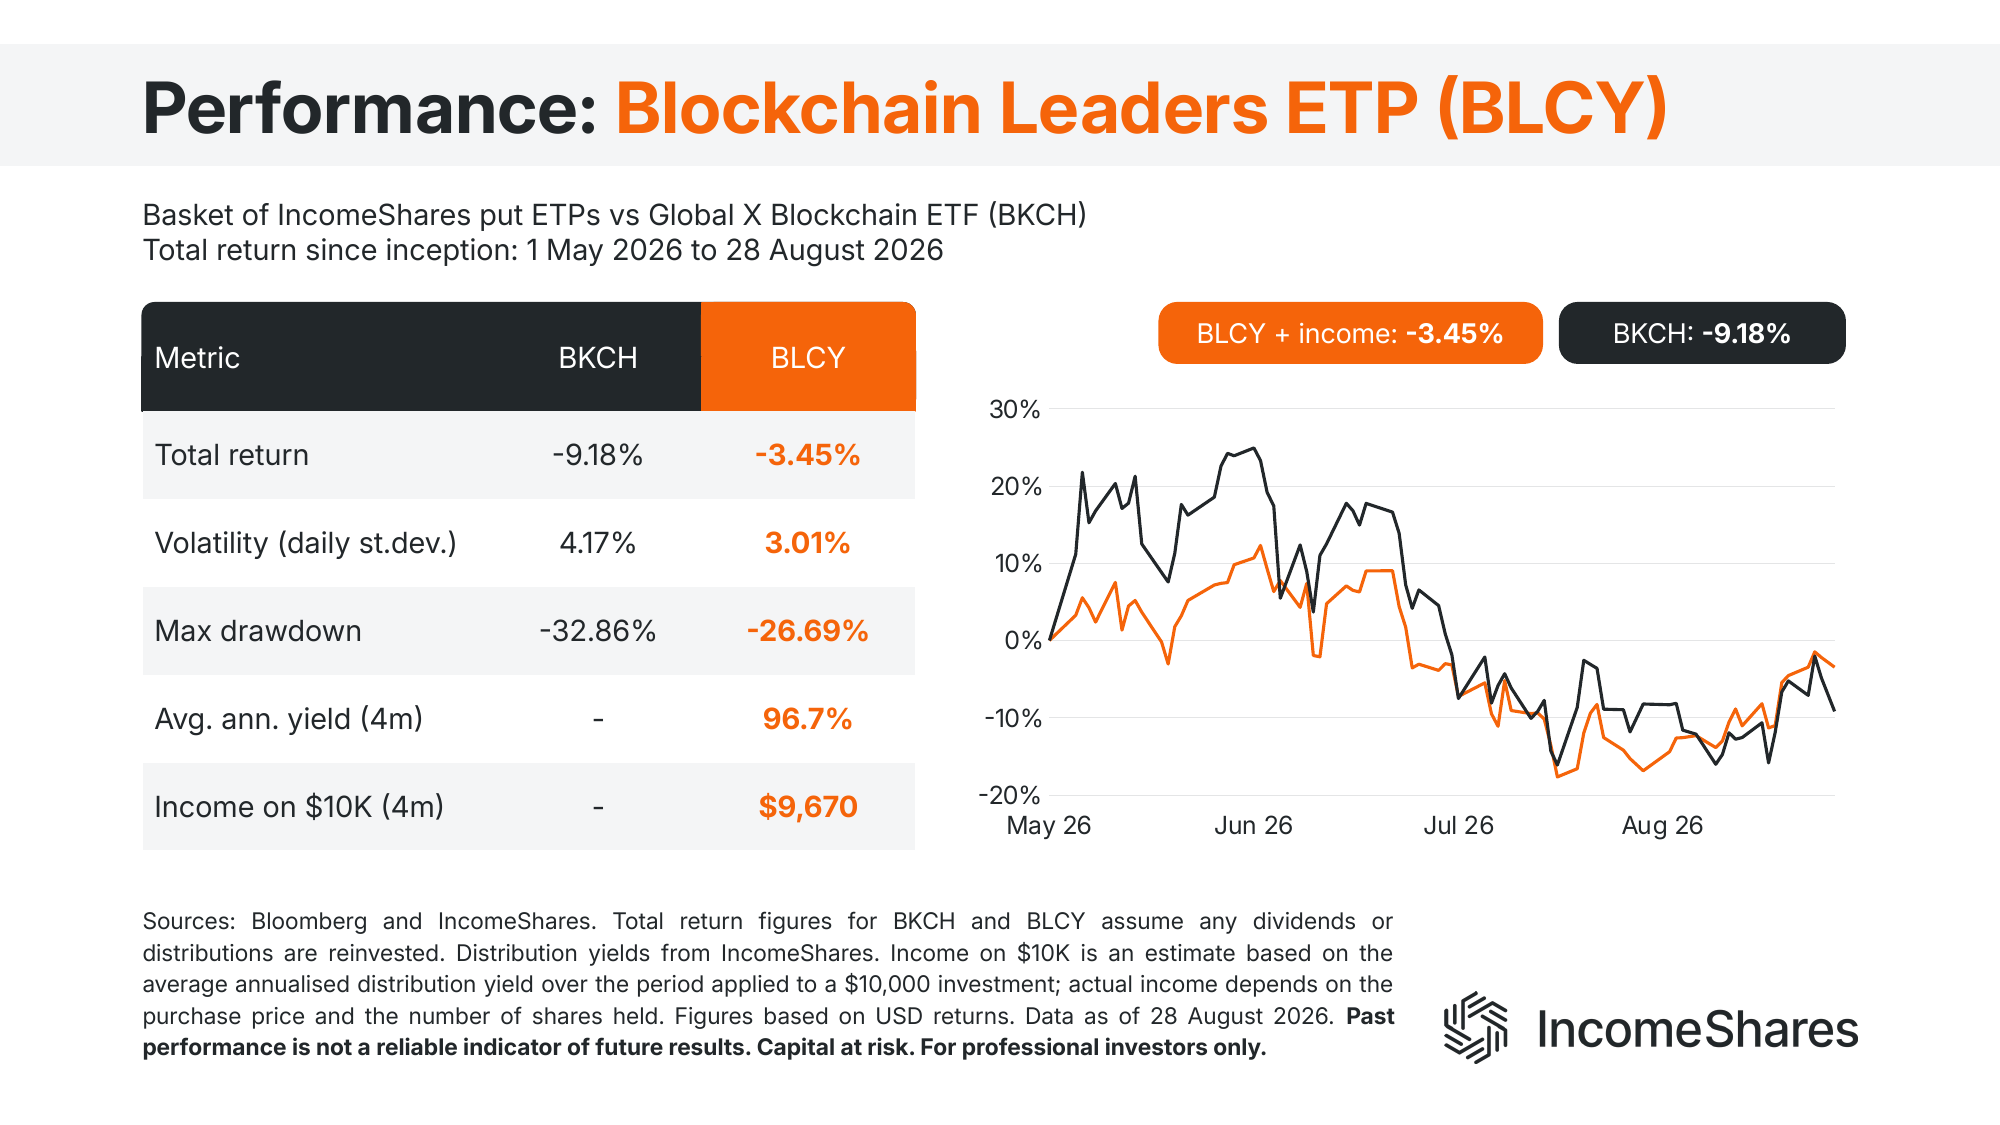
Our Uranium+ Yield and WTI Oil+ Yield ETPs hold the Global X Uranium ETF (URA) and the United States Oil Fund (USO), and sell puts on them. Our Blockchain Leaders ETP holds a basket of our own put-selling ETPs on blockchain stocks. We compare it with the Global X Blockchain ETF (BKCH). All three fell less than their comparison, by between 1.4 and 5.7 percentage points. Blockchain Leaders had the widest margin of the twelve.
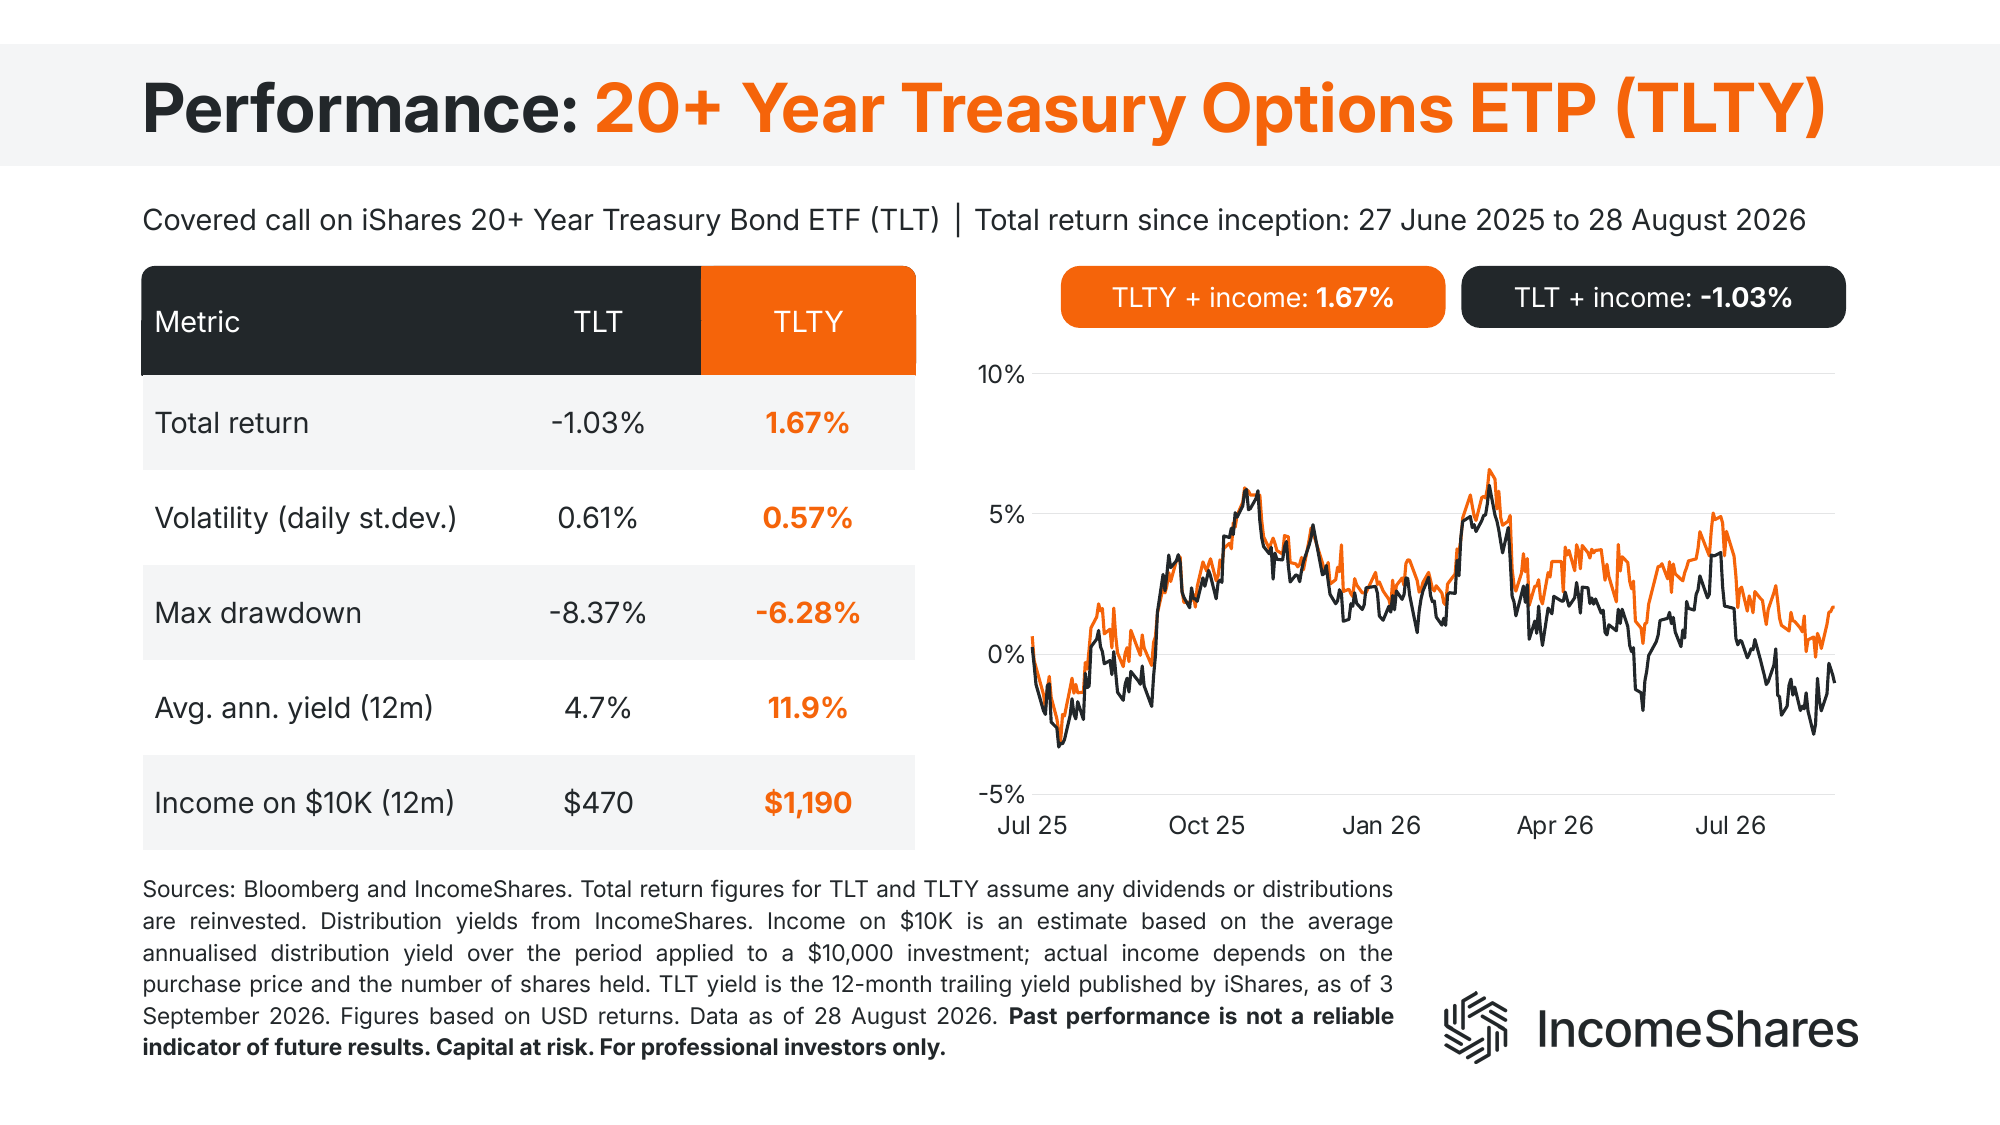
Our 20+ Year Treasury Options ETP (TLTY) is the only covered call ETP here. The iShares 20+ Year Treasury Bond ETF (TLT) moved in a narrow range and lost 1.03%, while TLTY gained 1.67%. The call premiums added up to more than the fund's small fall. The covered call upside cap cost very little in a market that never rallied far.
Coinbase: a covered call rally, then a put-selling fall
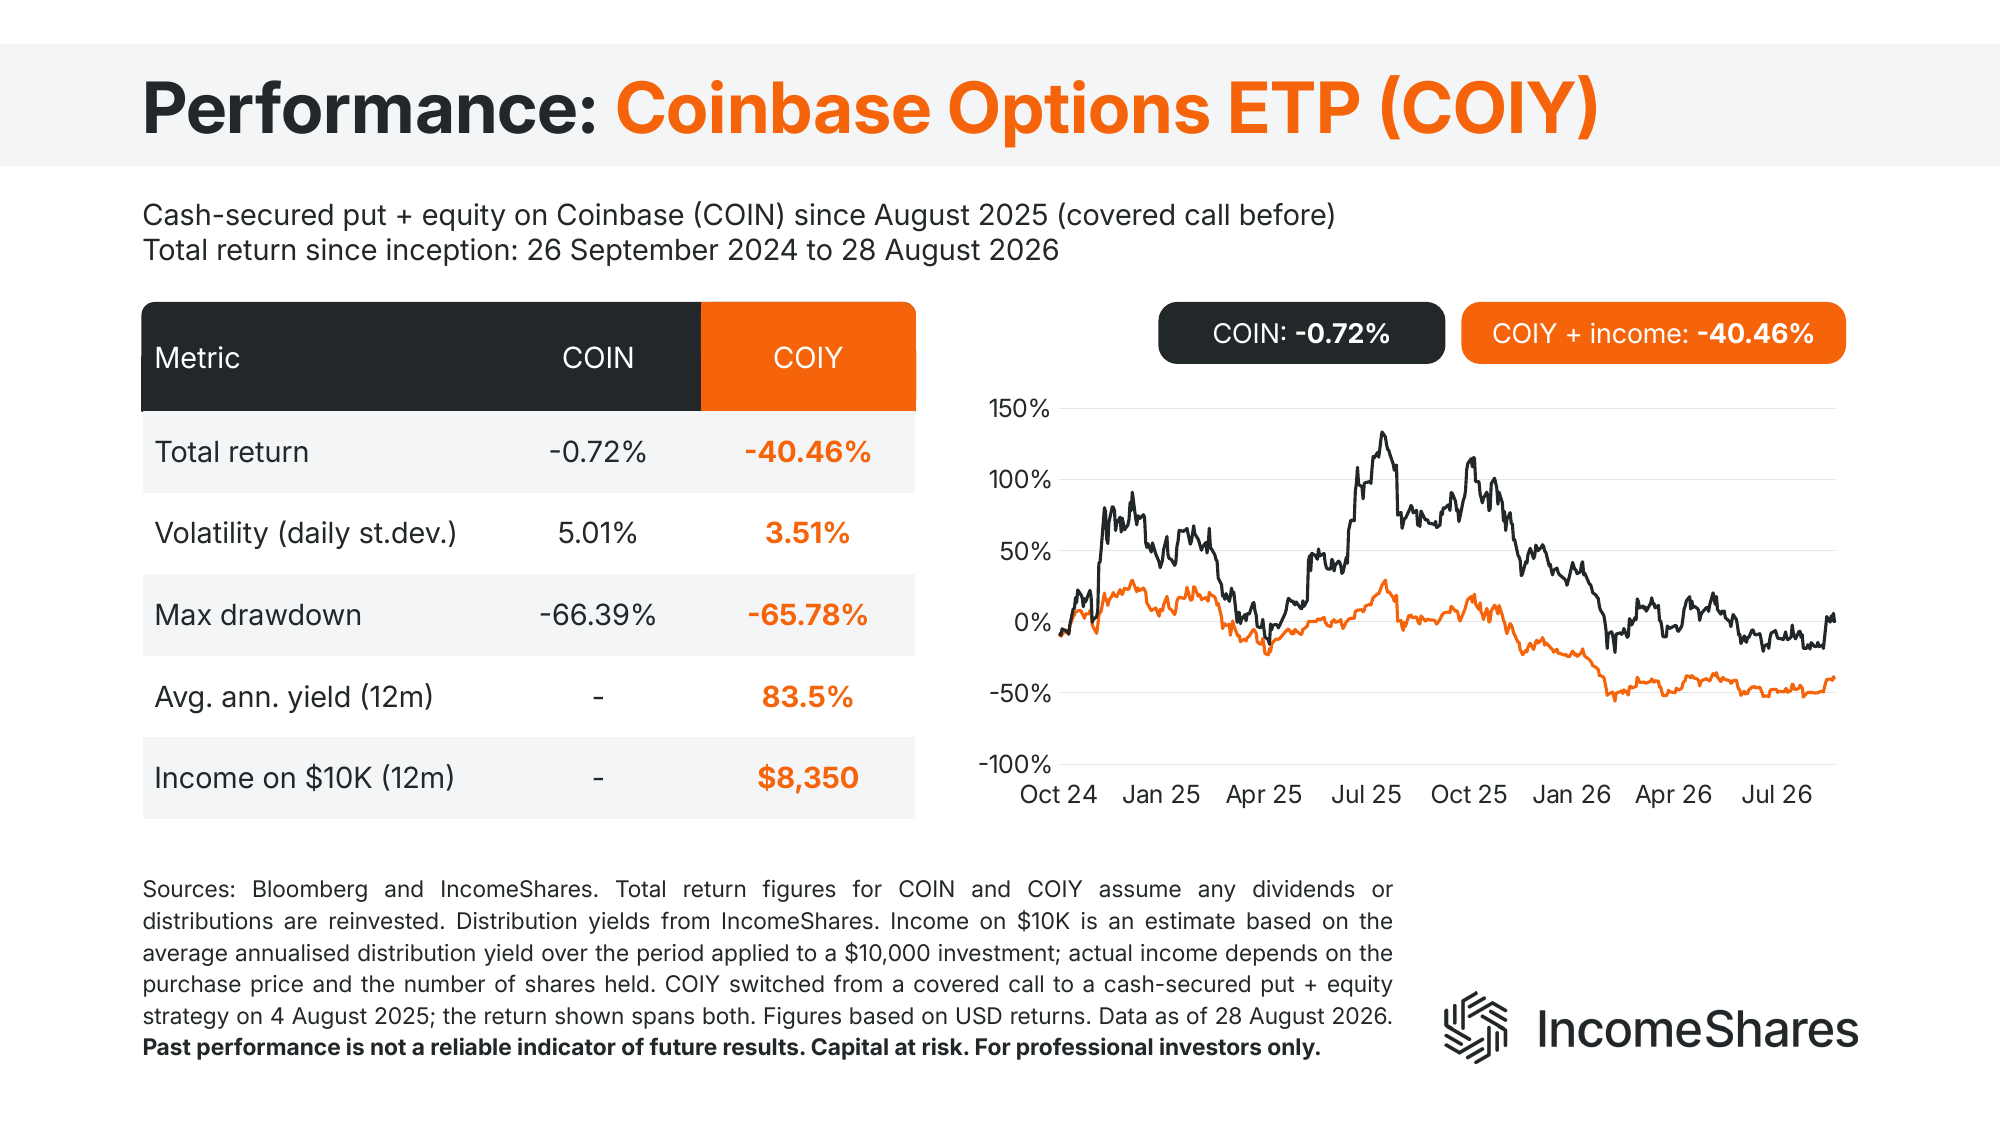
Our Coinbase Options ETP (COIY) is the largest lag of the twelve, and its strategy switch explains why. COIY ran a covered call strategy from its launch on 26 September 2024 until August 2025. It then moved to the cash-secured put plus equity strategy.
Coinbase (COIN) is down just 0.72% since launch, while COIY is down 40.46%. Almost all of that difference opened under the old covered call strategy. COIN rose 74.9% up to 1 August 2025, while the covered calls capped COIY at 0.4%. But since the switch, COIN has fallen 43.2% and COIY 40.7% – the same modest cushion the other put ETPs show.
Two caveats apply to all of this. Seven of the twelve launched in March, April, or July – so most of the data covers under six months. And across these twelve, the widest cushion in a fall was 5.7 percentage points. The largest lag after a rally was 39.7. The put-selling ETPs hold around 25% of their exposure in shares, so it can capture less of a rise. In these examples, that cost more than the premiums saved on the way down.
Key highlights
Nine of the twelve IncomeShares ETPs whose underlying asset fell since launch lost less than that asset. All twelve were less volatile.
The cushion was small. MicroStrategy fell 66.84% and our MicroStrategy Options ETP fell 62.79%. Netflix fell 11.23% and our Netflix Options ETP fell 8.29%.
The three that lagged (Circle Internet, Oracle, and Coinbase) all rallied before they fell. Coinbase's lag of 40 percentage points opened under its old covered call strategy.
Your capital is at risk if you invest. You could lose all your investment. Please see the full risk warning here.
Related Products:

Strategy
Cash-Secured Put + Equity
Distribution Yield
92.80%

Strategy
Cash-Secured Put + Equity
Distribution Yield
74.21%

Strategy
Cash-Secured Put + Equity
Distribution Yield
171.33%

Strategy
Cash-Secured Put + Equity
Distribution Yield
103.99%

Strategy
Cash-Secured Put + Equity
Distribution Yield
37.03%

Strategy
Cash-Secured Put + Equity
Distribution Yield
99.88%

Strategy
Basket of income strategies on leading blockchain stocks
Distribution Yield
91.83%

Strategy
LS SpaceX Options-Based Income Strategy
Distribution Yield
42.11%

Strategy
LS Memory Options-Based Income Strategy
Distribution Yield
104.07%