
Author
Jonathan Hobbs, CFA
Date
31 Oct 2025
Category
Market Insights
Meta Stock Analysis: 5 Charts Post-Earnings (Q3 2025)
Your capital is at risk if you invest. You could lose all your investment. Please see the full risk warning here.
Meta posted another quarter of record revenue, but the details beneath the surface show a more complex picture. Here are five charts that tell the fundamental story – plus a bonus technical analysis chart at the end.
Meta chart 1 – Profit hit by one-off tax charge
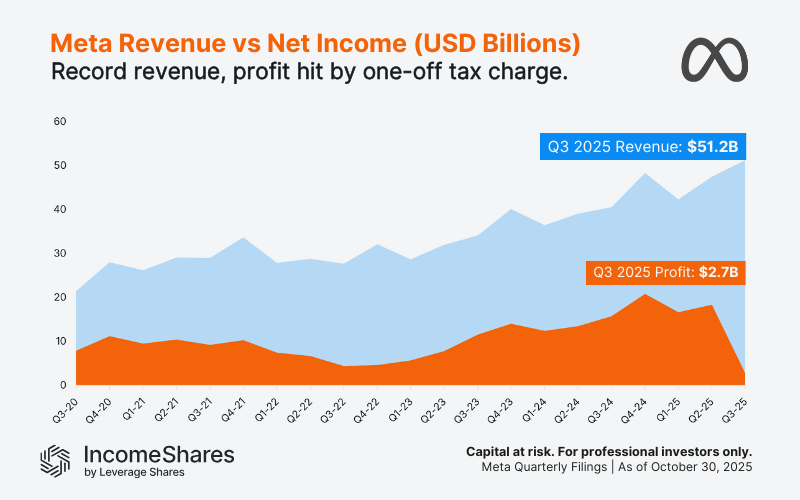
Meta’s revenue reached $51.2 billion in Q3 2025 – the highest in its history. But net income was just $2.7 billion – the lowest since Q2 2019. The profit drop was down to a one-time $15.9 billion tax charge tied to Trump’s “One Big Beautiful Bill Act”.
Without that charge, net income would have been about $18.6 billion last quarter. That’s roughly in line with recent quarters, and more than the $15.7 billion reported this time last year. Still, its profit margin would have been lower (around 36%) than in Q3 2024 (just under 39%).
The tax charge makes Meta’s results appear weak, but the company’s profitability is still solid. Revenue and net income have moved together in recent years, with a general profit margin recovery since 2022. Meta’s core business is still making money, even if accounting adjustments distort single-quarter results.
Chart 2 – Meta’s user base keeps growing across all apps
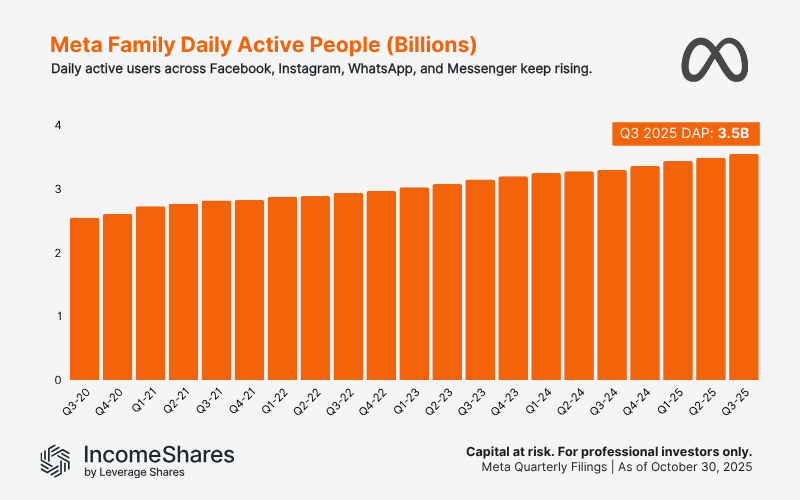
Family Daily Active People measures how many people use Meta’s services: Facebook, Instagram, WhatsApp, and Messenger. Total daily users reached 3.5 billion last quarter, up from 2.5 billion five years ago. Meta has grown its daily user base every quarter since before its 2021 rebrand to Meta Platforms.
That steady growth has kept Meta’s ad machine running. More users mean more ad impressions, which feed into the revenue trend we saw earlier. Ad impressions grew fastest in Asia-Pacific last quarter (23% year-on-year) – more than twice the rate of all other regions.
Chart 3 – Meta spends even more on AI infrastructure
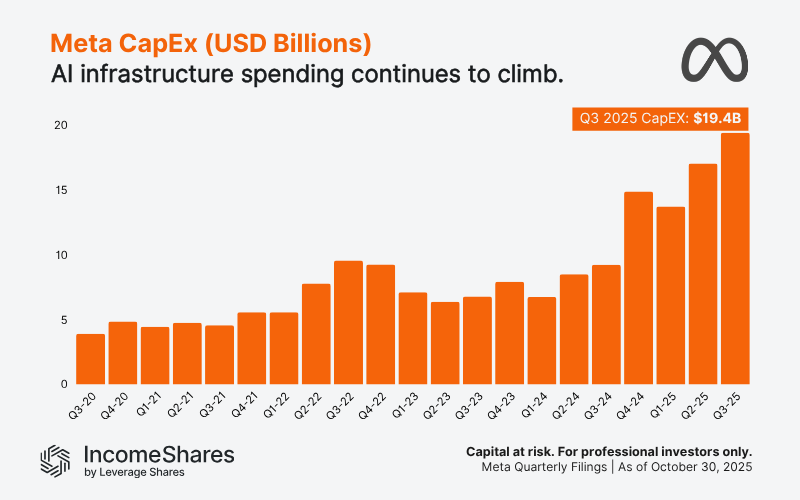
Meta’s capital expenditures (CapEx) reached $19.4 billion last quarter – more than double this time last year. That puts its total CapEx at $50 billion already this year, which is also double what it spent in 2024. Most of that spending goes to servers, data centres, and AI hardware to support recommendation models and LLMs for its apps.
Rising CapEx shows Meta’s long-term commitment to AI. Bigger spending could squeeze short-term profit margins, but improve its long-term engagement and ad targeting power.
Chart 4 – Rising AI investment pressures cash reserves
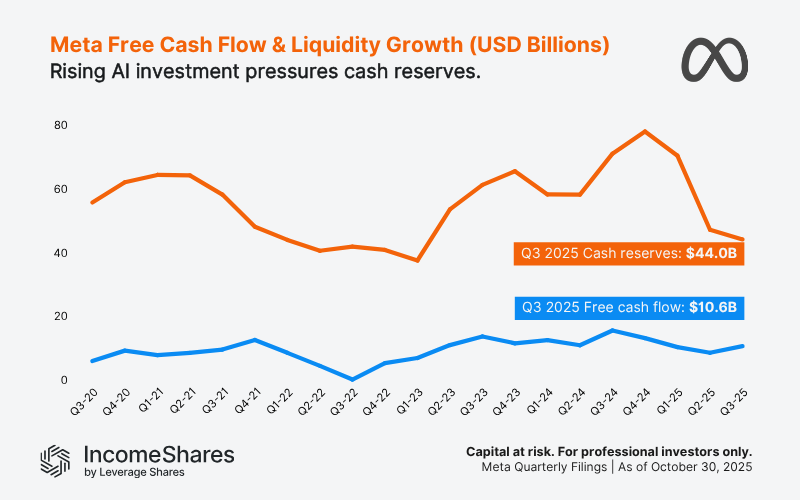
Meta’s free cash flow stayed positive despite higher CapEx, holding near $10 billion last quarter. Meanwhile, cash reserves have fallen from around $70 billion in late 2024 to $44 billion in Q3 2025, as AI infrastructure spending accelerated. That suggests Meta is funding its build-out with existing cash rather than new debt. Free cash flow stability, even with rising investment, shows the core business is still generating strong cash.
Chart 5 – Meta is “cheaper” than most Magnificent 7 stocks
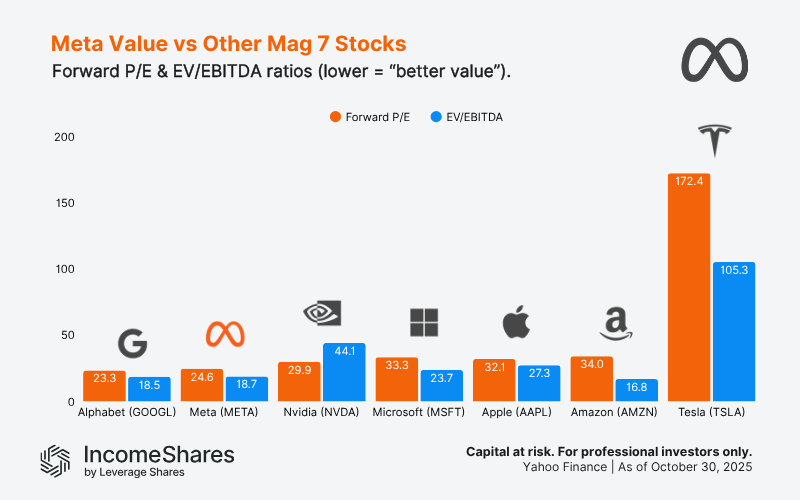
According to two key metrics, Meta trades at “better value” than every Magnificent 7 stock except Alphabet.
Meta’s forward price-to-earnings ratio (Fwd P/E) is just under 25. That means investors are now paying roughly $25 for every $1 of company earnings over the next 12 months. Those future earnings come from analysts’ forecasts, so they’re only estimates of what companies will earn.
Meta also has the second-lowest EV/EBITDA multiple – at 18.7. That suggests its market value is relatively low compared to its operating profit (versus other Magnificent 7 stocks, at least).
Bonus chart – Meta technical analysis
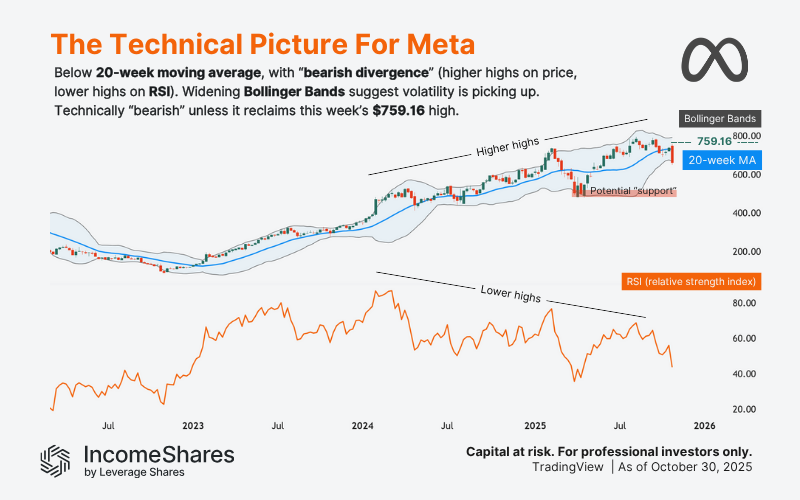
Meta’s chart shows a few drives of “bearish divergence” between its stock price and weekly relative strength index (RSI, orange). The stock price has made higher highs, while the RSI has made lower highs. That means the price has gone up, but with waning buyer strength – which can be a bearish signal.
With Meta dropping over 10% after Thursday’s earnings announcement, it’s now below its 20-week moving average (blue). The drop also caused an uptick in volatility, which you can see by the widening Bollinger Bands (gray). So technically speaking, the stock has the potential to trend lower over time. The next area of major support could be this year’s low (red box) of around $500.
For the bearish scenario to be “invalidated” in the short term, it would need to reclaim this week’s high of $759.16.
The IncomeShares Meta Options ETP aims to track Meta’s general price direction (after fees), and aims to pay monthly income from selling put options on the stock. The ETP trades in USD and GBP in the UK, and Euros in Europe.
Key takeaways
Meta’s Q3 profit slump was a one-off tax event – not an operational decline.
Daily active users and ad impressions keep growing, especially in Asia-Pacific.
Rising AI spending is pressuring cash reserves, but hasn’t hurt free cash flow.
Your capital is at risk if you invest. You could lose all your investment. Please see the full risk warning here.
Related Products:

Strategy
Cash-Secured Put + Equity
Distribution Yield
38.12%

Strategy
Cash-Secured Put + Equity
Distribution Yield
75.51%

Strategy
Basket of Income-generating ETPs
Distribution Yield
39.99%