
Author
Jonathan Hobbs, CFA
Date
07 Mar 2025
Category
Market Insights
The Magnificent 7: Who Kept the Most Profit Last Year?
Your capital is at risk if you invest. You could lose all your investment. Please see the full risk warning here.
The Magnificent 7 have reported their latest full-year earnings, giving us a fresh look at how these tech giants compared. These companies dominate the market, but how much of their revenue actually turned into profit? This post breaks down their revenue, total expenses, and net income – plus a final chart showing their profit margins.
Understanding financial year differences
Each company reports earnings based on different fiscal year-ends:
Amazon, Meta, Alphabet, Tesla, and Microsoft report their full-year results based on a December 31 year-end.
Apple operates on a September fiscal year, meaning its latest results cover October 2023 to September 2024.
Nvidia follows a February-to-January financial year, so its latest results (reported January 2025) cover February 2024 to January 2025.
For consistency, this analysis uses each company’s most recent full-year data.
How much revenue did each Magnificent 7 company generate?
First, let’s look at total revenue – the amount of money each company made before expenses.
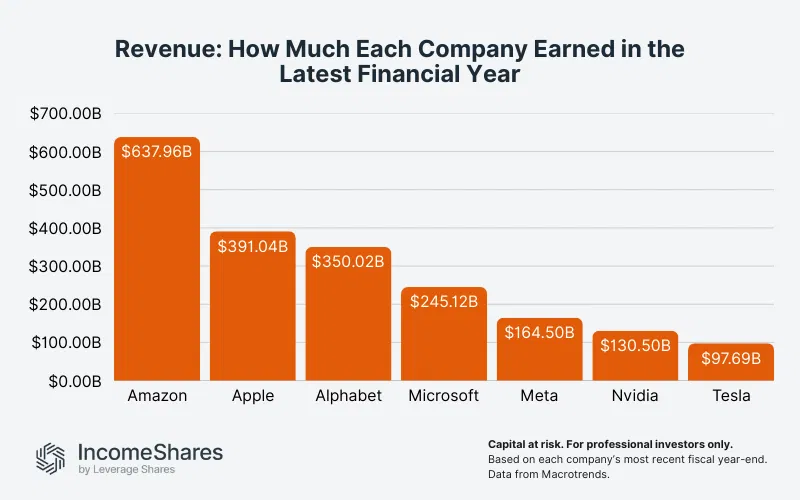
Amazon generated the most revenue, bringing in $638 billion – more than Apple and Microsoft combined.
Apple reported $391 billion in revenue, remaining one of the largest companies by sales.
Nvidia saw rapid growth, generating $130 billion – mostly fuelled by AI demand.
While revenue shows scale, it doesn’t tell us the full story. A high-revenue company isn’t necessarily the most profitable.
How much did they spend?
Next, we look at total expenses – the costs of running the business, including R&D, operations, and marketing.
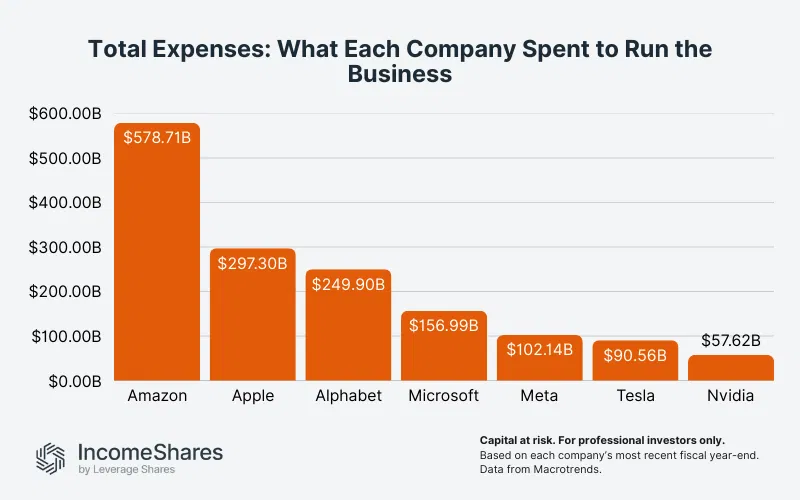
Amazon had the highest expenses at $579 billion, which is expected for a retail distribution giant.
Apple spent nearly $300 billion, maintaining strong profitability despite high costs.
Tesla recorded relatively high expenses compared to its revenue, which compressed its margins.
How much profit was left?
Net income is what remains after costs. This is the money available for shareholders, reinvestment, or dividends.
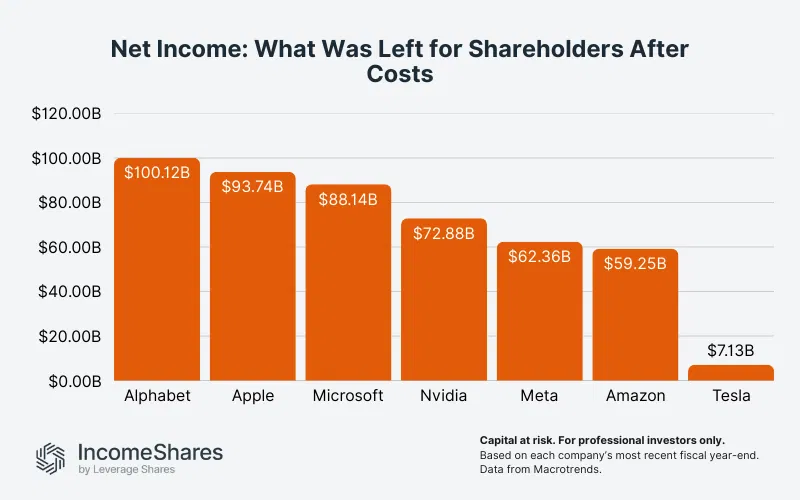
Alphabet generated the most net income, reporting $100.1 billion in profit.
Apple followed closely, with $93.7 billion, despite higher expenses.
Amazon, despite leading in revenue, earned $59.3 billion in net profit – a lower-margin business model.
Who had the highest profit margins?
Profit margin shows how much of each dollar in revenue turned into profit.
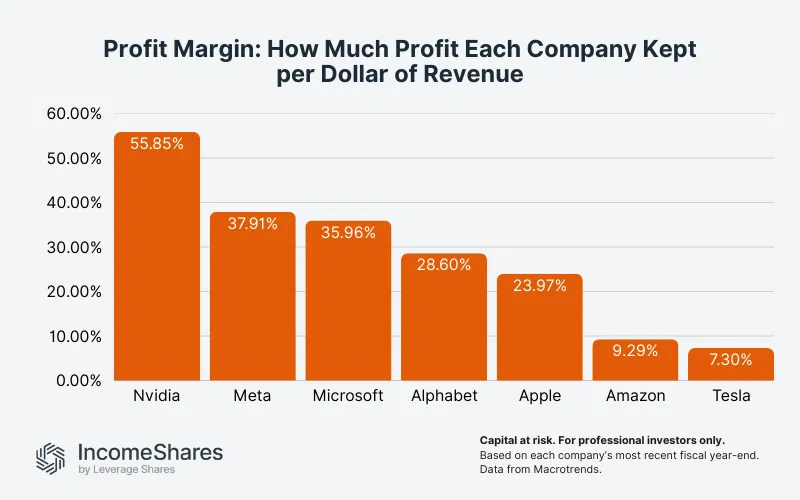
Nvidia had the highest profit margin, keeping 55.8% of every dollar it generated.
Meta, Microsoft, and Alphabet ran highly efficient businesses, each reporting 25%+ profit margins.
Amazon and Tesla had much slimmer profit margins, at 9.3% and 7.3%, respectively.
For income investors, understanding profitability and efficiency is key. IncomeShares offers individual options ETPs (exchange-traded products) for each of the Magnificent 7 stocks. These ETPs seek to generate monthly income by selling call options on their respective stocks while retaining upside exposure up to the strike price.
Key takeaways
Amazon generated the most revenue out of all the Magnificent 7 companies in the last financial year. But its lower margins meant it didn’t keep as much profit.
Nvidia led in profitability, with a 55.8% margin – driven by AI demand.
Meta, Microsoft, and Alphabet ran highly efficient businesses, keeping over 25% of revenue as profit.
Tesla had the lowest profit margin, despite strong revenue growth.
Your capital is at risk if you invest. You could lose all your investment. Please see the full risk warning here.
Related Products:

Strategy
Cash-Secured Put + Equity
Distribution Yield
31.85%

Strategy
Cash-Secured Put + Equity
Distribution Yield
23.13%

Strategy
Cash-Secured Put + Equity
Distribution Yield
44.71%

Strategy
Cash-Secured Put + Equity
Distribution Yield
37.00%

Strategy
Cash-Secured Put + Equity
Distribution Yield
47.52%