
Author
Jonathan Hobbs, CFA
Date
03 Apr 2026
Category
Investor update
IncomeShares Monthly Investor Update – March 2026
Your capital is at risk if you invest. You could lose all your investment. Please see the full risk warning here.
IncomeShares launched 20 new exchange-traded products in March, expanding the range to 39 ETPs. Cumulative fund flows reached a new all-time high of $169.8 million, and MicroStrategy posted the highest distribution yield of the range.
This update breaks down the numbers for the month.
Assets under management (AUM)
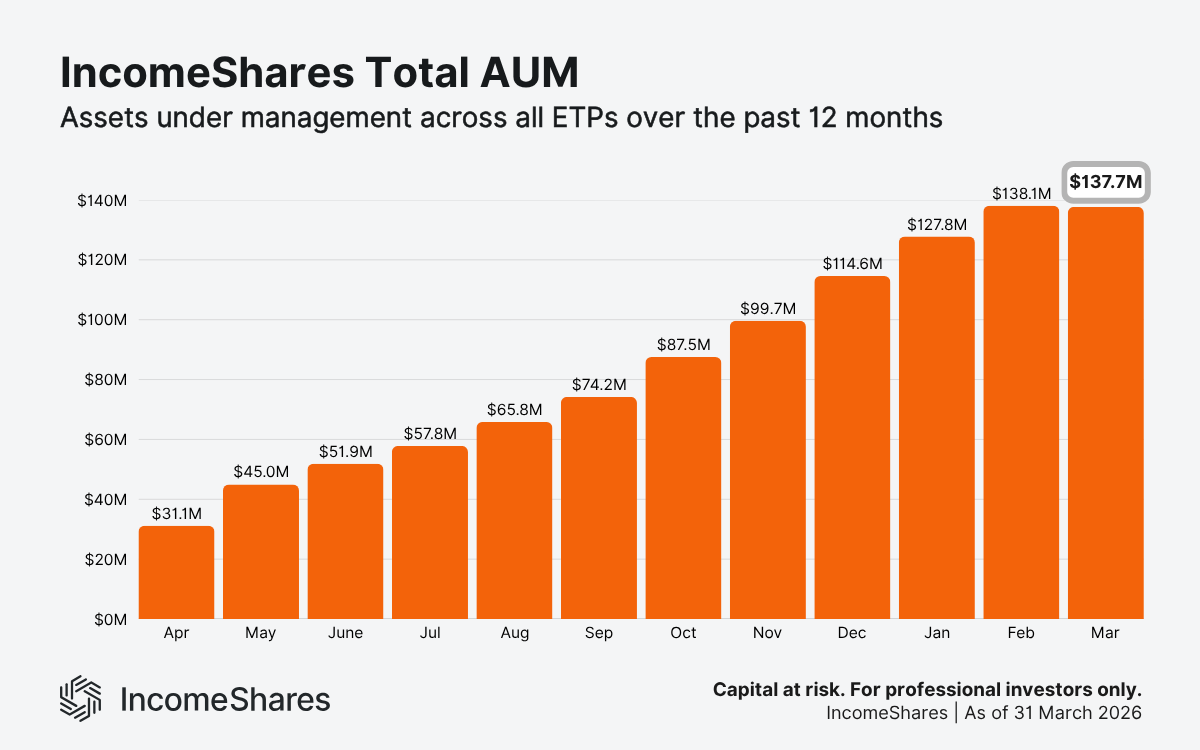
Total assets under management closed March at $137.7 million – a slight dip from February's $138.1 million. That dip reflects a combination of market movements and monthly income distributions paid to investors, not outflows. Net inflows for the month totalled $15.8 million.
Gold+ Yield continues to be our largest product, with $35.15 million in AUM as of the end of March. Our Nasdaq 100, Magnificent 7 basket, Silver+ Yield, and Tesla ETPs ended March with $12.83, $12.21, $10.30, and $9.29 million in AUM, respectively. Together with Gold+ Yield, these ETPs account for about 58% of our total AUM.
Cumulative fund flows
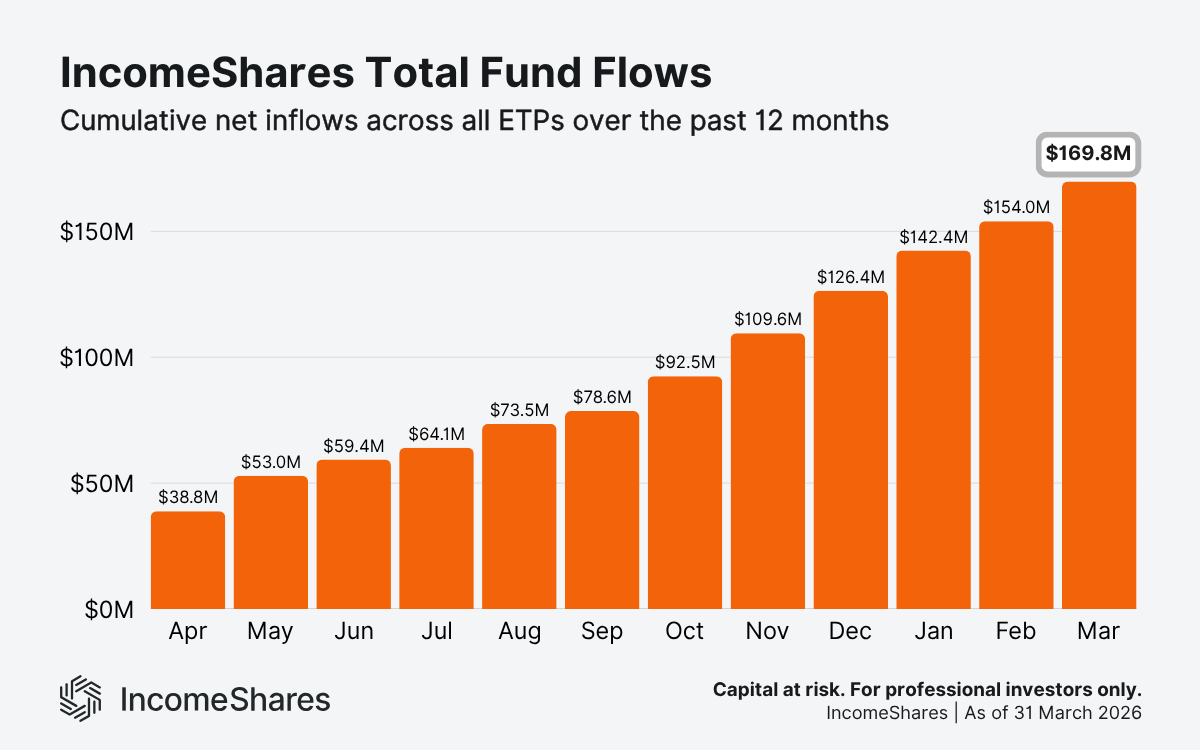
Cumulative fund flows reached $169.8 million by the end of March – a 10.3% increase from February. This metric tracks the net amount of money investors have added to IncomeShares exchange-traded products. Positive flows suggest growing demand.
Our Gold+ Yield ETP saw the largest net inflows in March, adding $3.43 million. Magnificent 7 and MicroStrategy followed with $1.54 and $1.52 million, respectively.
Total fund flows have risen every month since inception, and continue to exceed total AUM. That's expected for products that pay monthly income to investors, since distribution payments are subtracted from assets under management.
Trading turnover
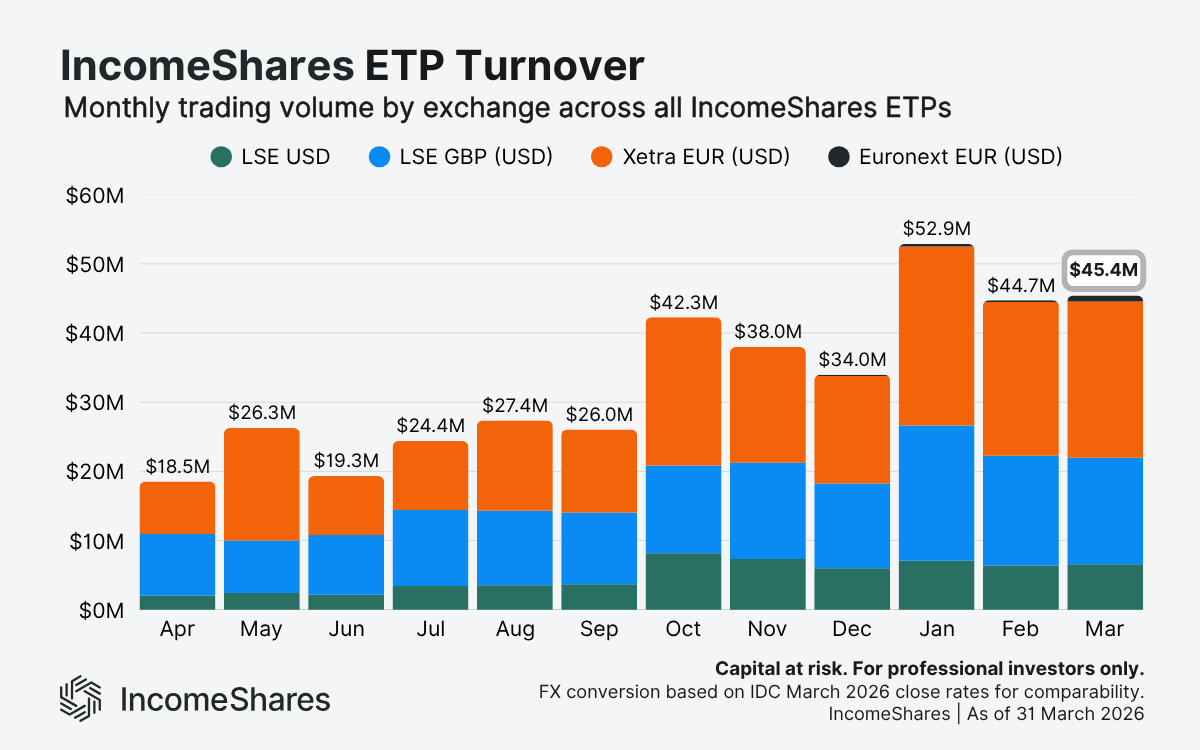
Total trading activity reached $45.4 million across exchanges in March. Turnover has held above $40 million for three consecutive months.
The split between the London Stock Exchange and Xetra remained broadly even, with Euronext Amsterdam continuing to build since IncomeShares ETPs began trading there in November 2025.
Note: Figures use IDC FX rates as of the March month-end to convert GBP and EUR into USD for comparison.
20 new ETPs launched in March
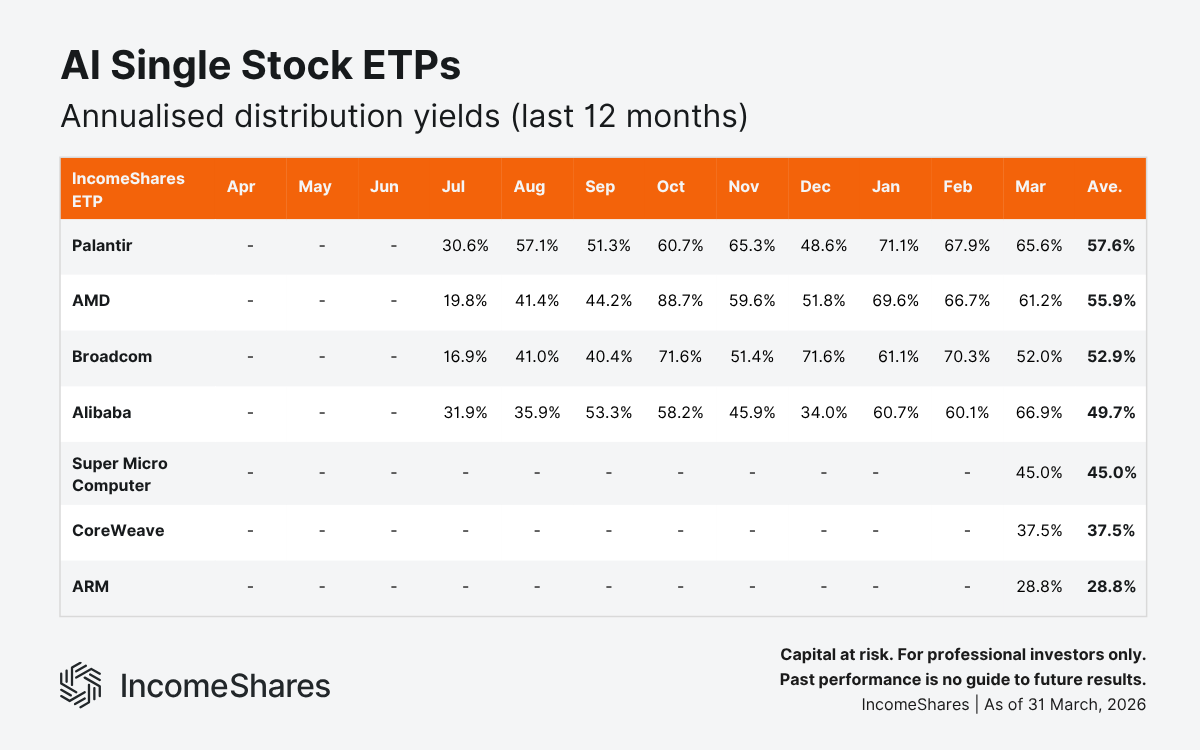
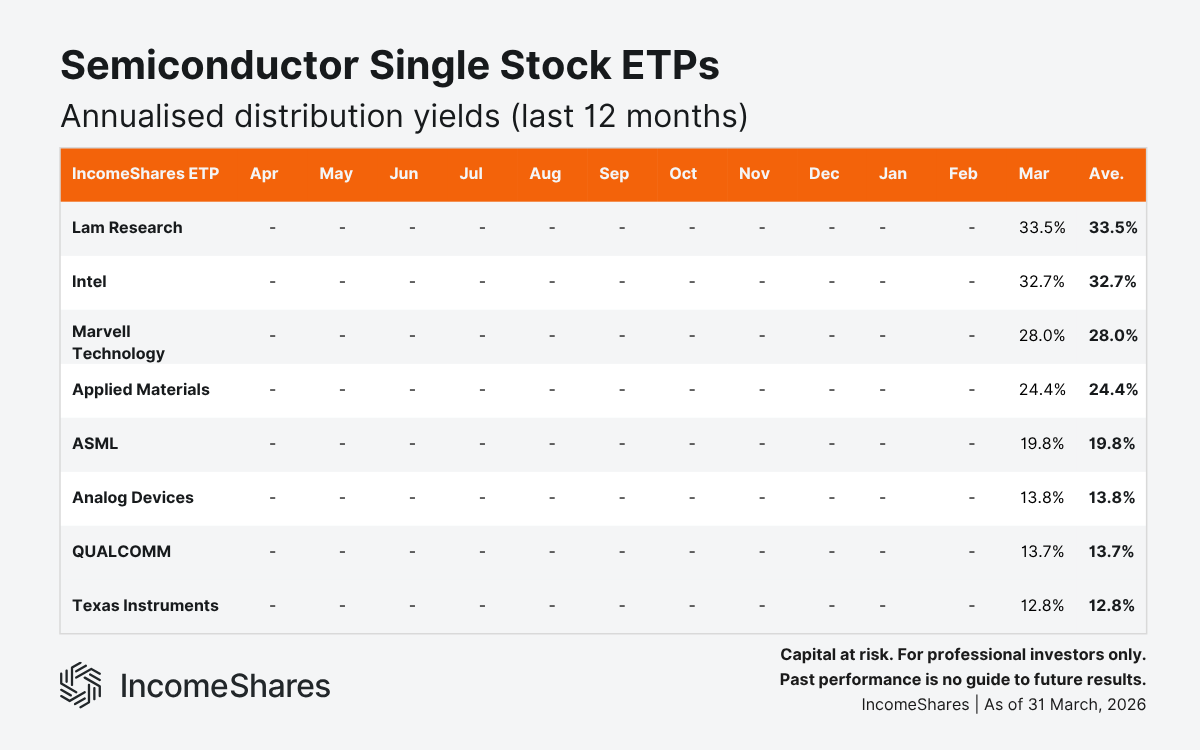
On 23 March, IncomeShares listed 20 new exchange-traded products – more than doubling the range from 19 to 39 ETPs. The new products cover semiconductors, AI infrastructure, digital assets, and baskets.
Semiconductor ETPs: Lam Research, Intel, Marvell Technology, Applied Materials, ASML, Analog Devices, QUALCOMM, and Texas Instruments.
AI ETPs: Super Micro Computer, CoreWeave, and ARM.
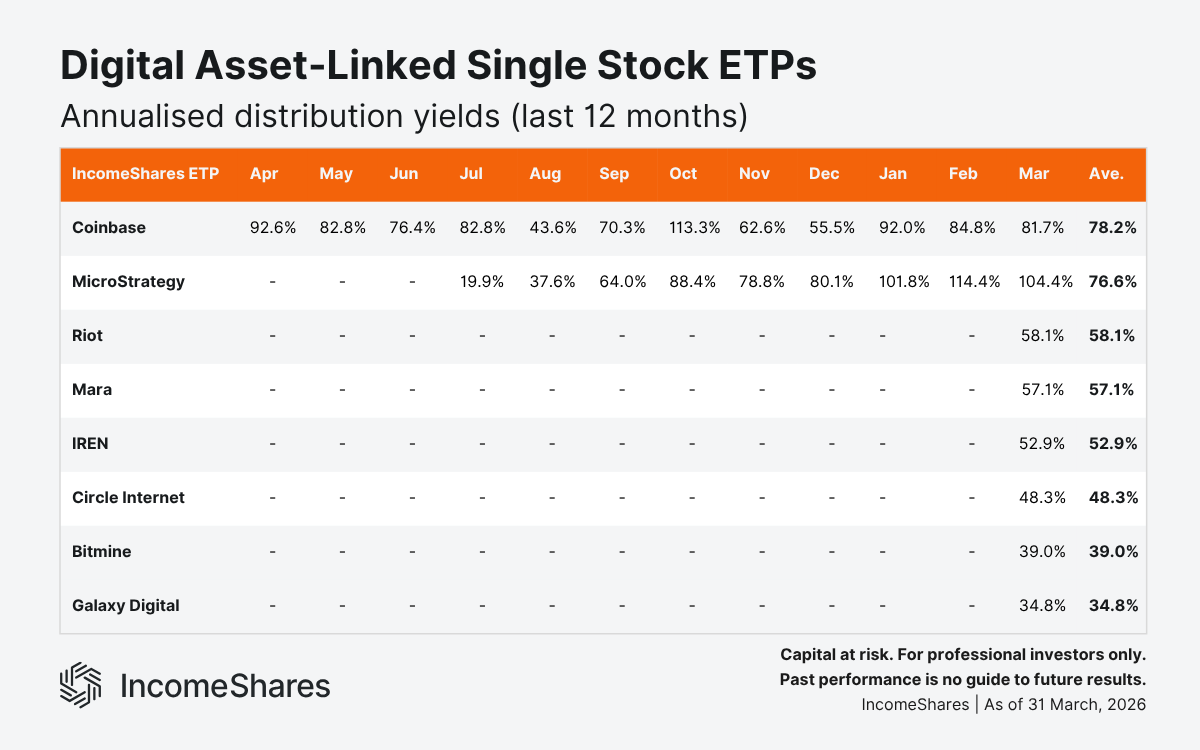
Digital asset-linked ETPs: Riot, Marathon Digital (Mara), IREN, Circle Internet, Bitmine, and Galaxy Digital.
Basket ETPs: AI Leaders, Semiconductor Leaders, and 60/30/10 Multi-Asset.
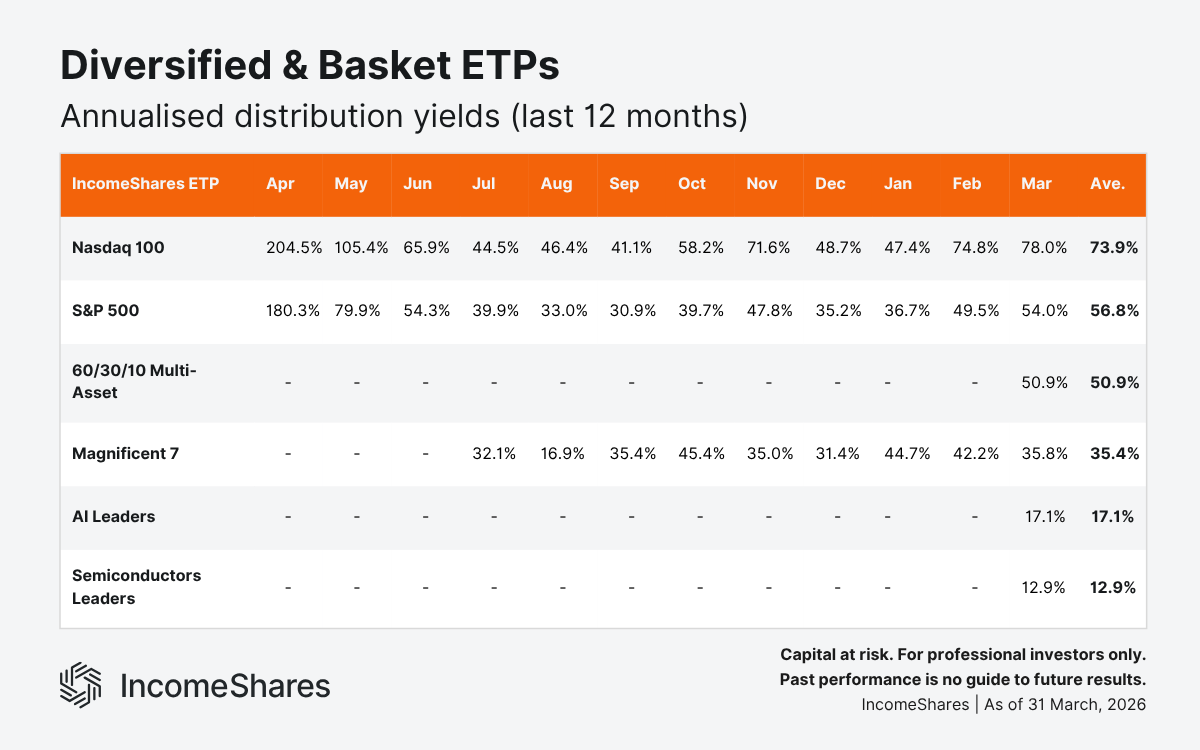
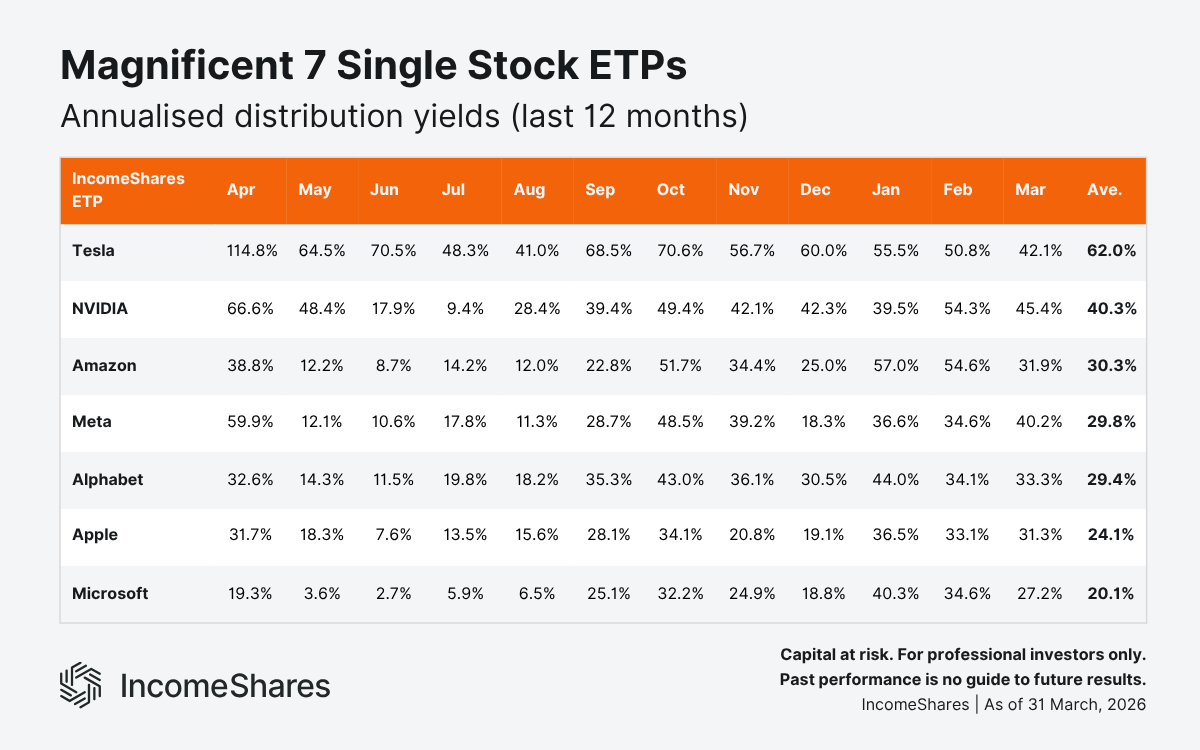
Distribution yields
Distribution yields represent the annualised income paid to investors as a percentage of an ETP's net asset value, based on the latest month's distribution. IncomeShares ETPs aim to generate this income from selling options. Yields change each month depending on strategy performance and market volatility.
March annualised distribution yields ranked from highest to lowest:
MicroStrategy Options ETP: 104.42%
Coinbase Options ETP: 81.65%
Nasdaq 100 Options ETP: 78.00%
Alibaba Options ETP: 66.88%
Palantir Options ETP: 65.57%
AMD Options ETP: 61.23%
Riot Options ETP: 58.13%
Mara Options ETP: 57.05%
S&P 500 Options ETP: 54.00%
IREN Options ETP: 52.92%
Broadcom Options ETP: 52.04%
60/30/10 Multi-Asset Options ETP: 50.90%
Circle Internet Options ETP: 48.27%
NVIDIA Options ETP: 45.38%
Super Micro Computer Options ETP: 45.00%
Tesla Options ETP: 42.14%
META Options ETP: 40.18%
Bitmine Options ETP: 39.04%
CoreWeave Options ETP: 37.54%
Magnificent 7 Options ETP: 35.84%
Galaxy Digital Options ETP: 34.81%
Lam Research Options ETP: 33.47%
Alphabet Options ETP: 33.33%
Intel Options ETP: 32.71%
Amazon Options ETP: 31.86%
Apple Options ETP: 31.31%
ARM Options ETP: 28.75%
Marvell Technology Options ETP: 28.02%
Microsoft Options ETP: 27.23%
Applied Materials Options ETP: 24.37%
ASML Options ETP: 19.75%
AI Leaders Options ETP: 17.05%
Analog Devices Options ETP: 13.78%
QUALCOMM Options ETP: 13.65%
Semiconductor Leaders Options ETP: 12.85%
Texas Instruments Options ETP: 12.77%
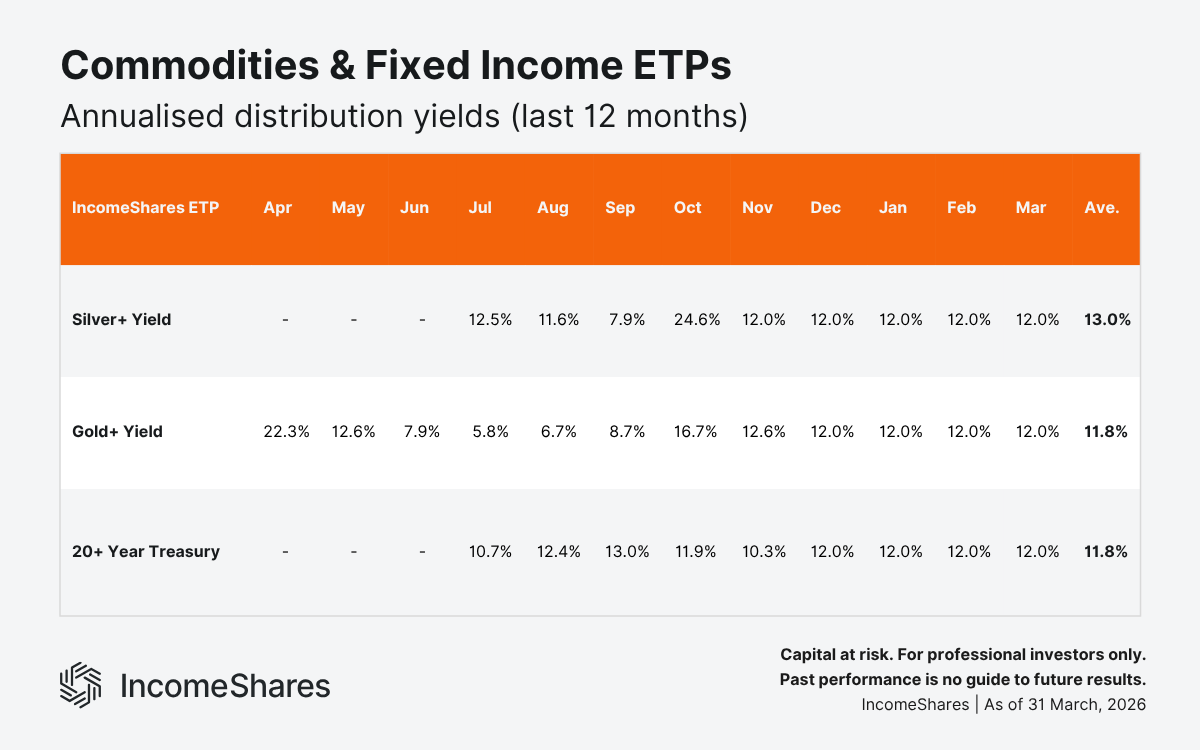
Silver+ Yield ETP: 12.00%
20+ Year Treasury Options ETP: 12.00%
Gold+ Yield ETP: 11.99%
With 39 ETPs now in the range, the tables below show annualised distribution yields over the past 12 months, grouped by theme. Not all ETPs have a full 12 months of data – each table shows yields from the month the product launched.
Key takeaways
IncomeShares launched 20 new ETPs in March, expanding the range to 39 products across six categories.
Cumulative fund flows reached $169.8 million – a new all-time high. Net inflows for March totalled $15.8 million.
AUM closed at $137.7 million. The slight dip from February reflects market movements, not outflows.
MicroStrategy, Coinbase, and Nasdaq 100 ETPs posted the highest distribution yields of the range in March.
All 39 ETPs paid income in March. Annualised distribution yields ranged from 12.0% to 104.4%.
Your capital is at risk if you invest. You could lose all your investment. Please see the full risk warning here.
Related Products:

Strategy
Cash-Secured Put + Equity
Distribution Yield
71.48%

Strategy
Covered Call
Distribution Yield
11.96%

Strategy
Basket of Income-generating ETPs
Distribution Yield
38.55%

Strategy
Covered Call
Distribution Yield
12.32%

Strategy
Covered Call
Distribution Yield
11.74%

Strategy
Portfolio of Multi-Asset Income Strategies
Distribution Yield
28.66%