

Author
Jonathan Hobbs, CFA
Date
05 Aug 2026
Category
Investor update
IncomeShares Monthly Investor Update – July 2026
Your capital is at risk if you invest. You could lose all your investment. Please see the full risk warning here.
Cumulative fund flows crossed $250 million for the first time in July. Distribution yields were mixed, and our SpaceX and Memory exchange-traded products (ETPs) paid their first income distributions.
This update breaks down the numbers for the month.
Assets under management (AUM)
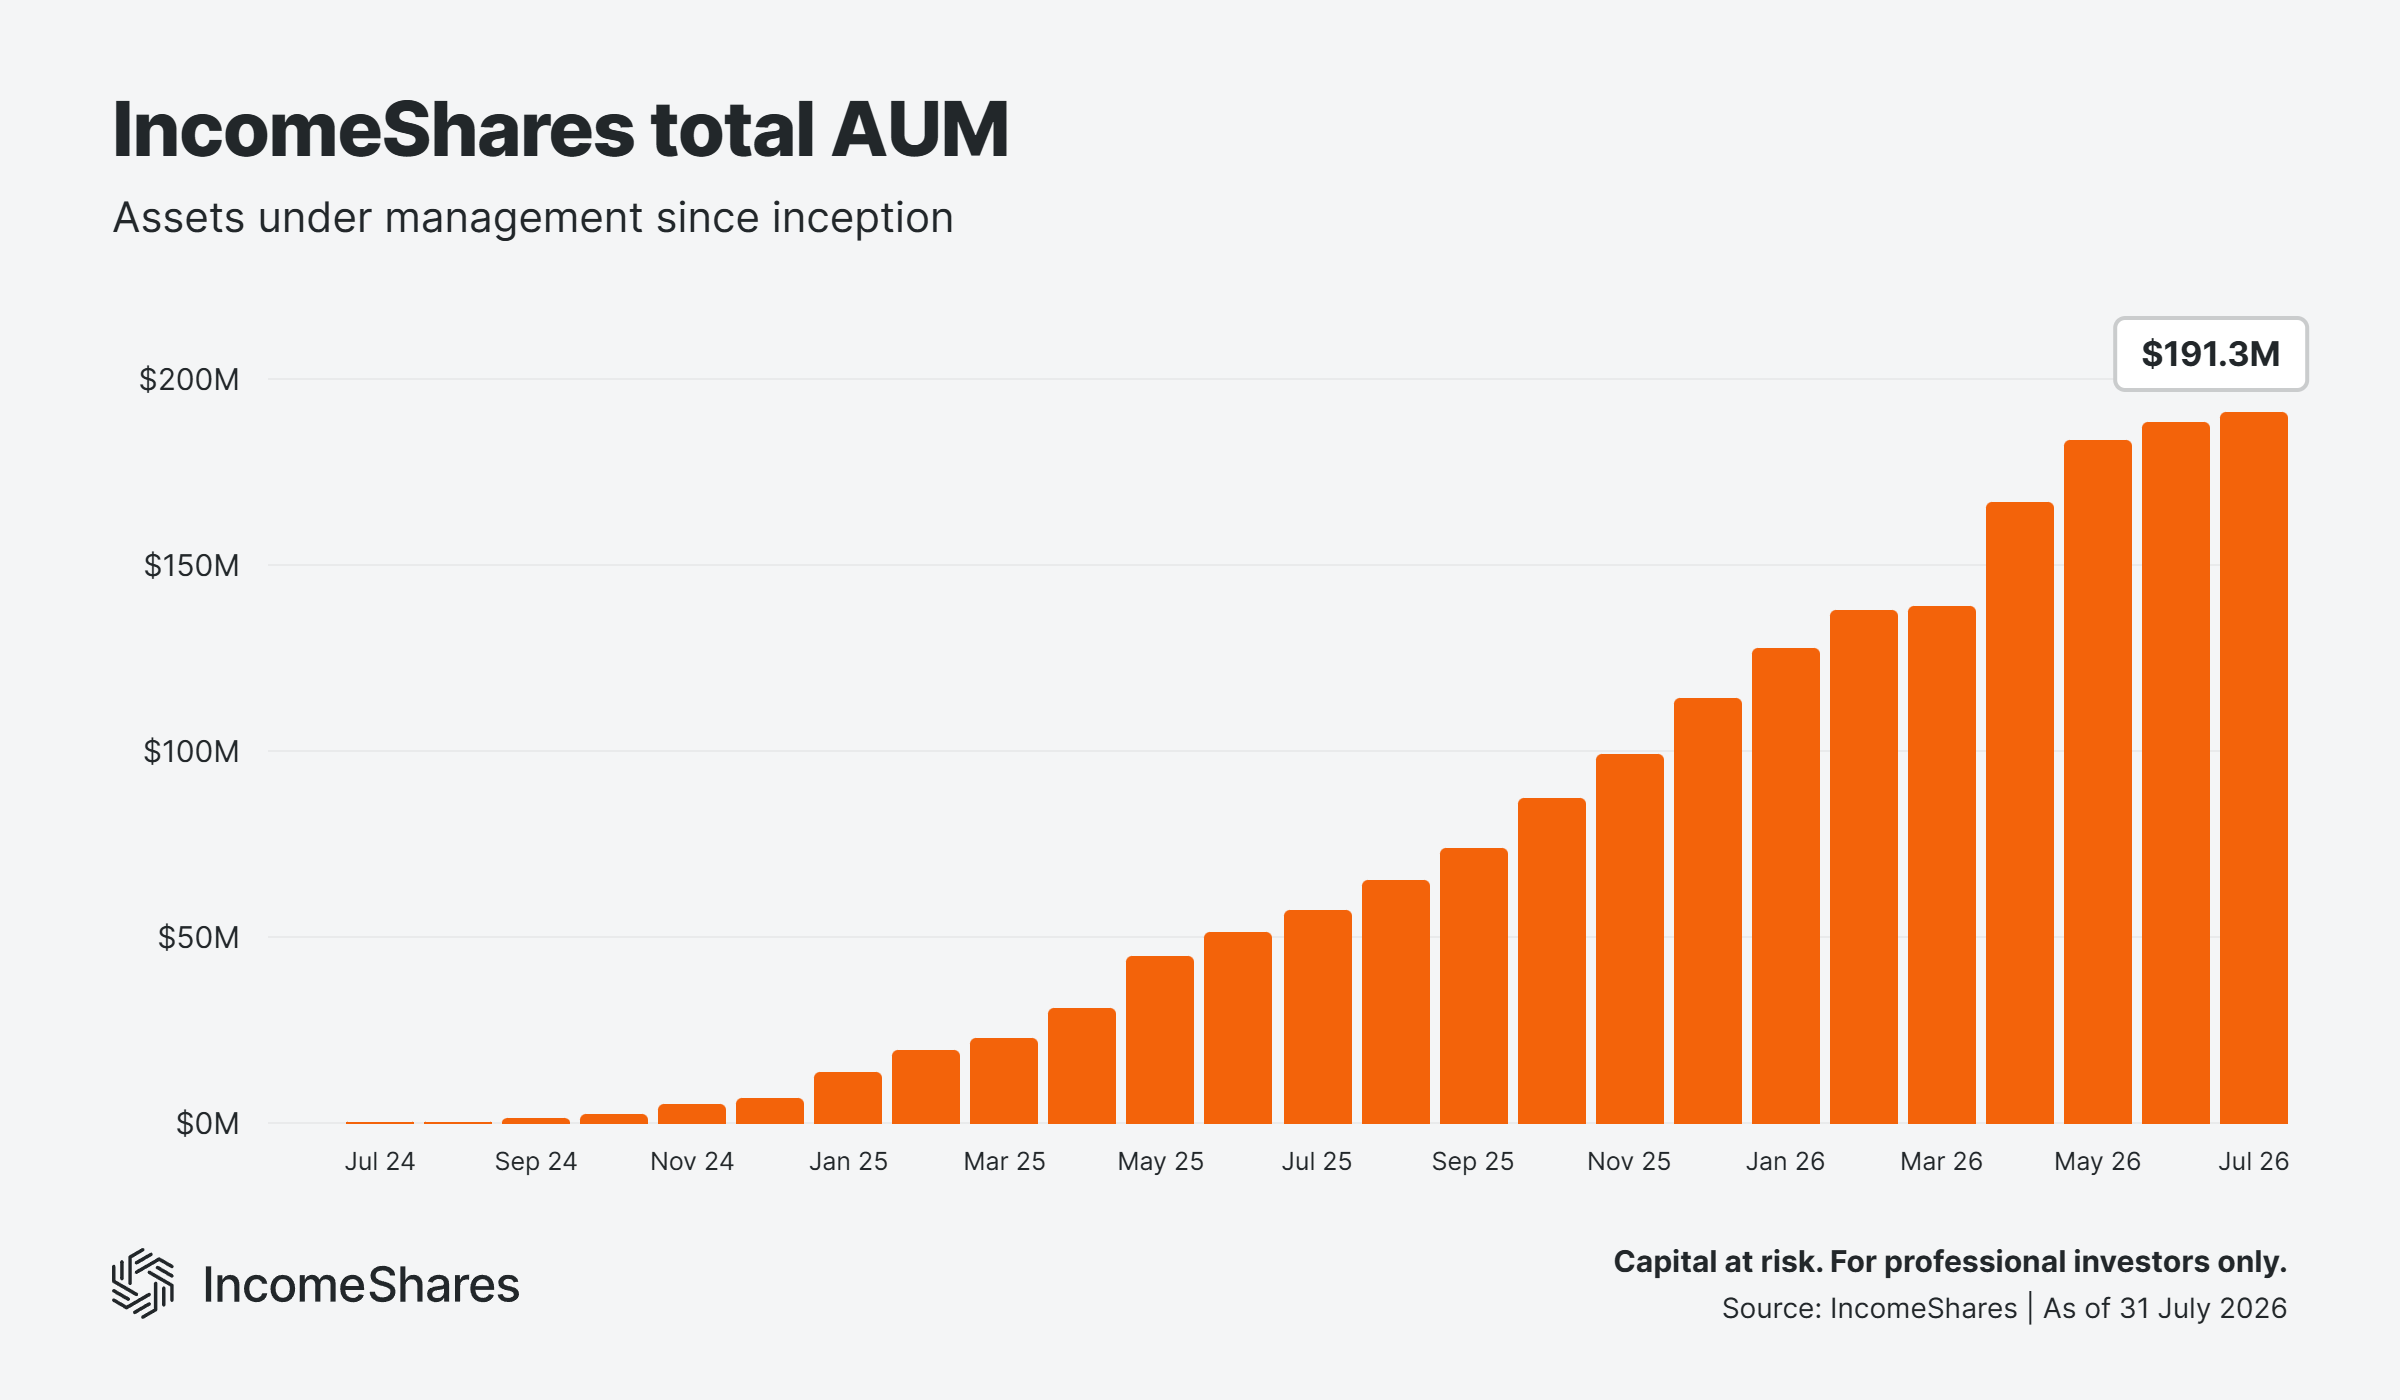
Total assets under management closed July at $191.3 million – up about 1.2% from June. Total AUM has risen every month since July 2024, when we launched our first ETPs.
Gold+ Yield is still our largest ETP, with $43.2 million in AUM. Our Magnificent 7, Nasdaq 100, Silver+ Yield, and S&P 500 ETPs followed. They ended July with $16.9, $16.1, $10.9, and $10.3 million, respectively. Together with Gold+ Yield, these five ETPs currently account for about half of our total AUM.
Cumulative fund flows
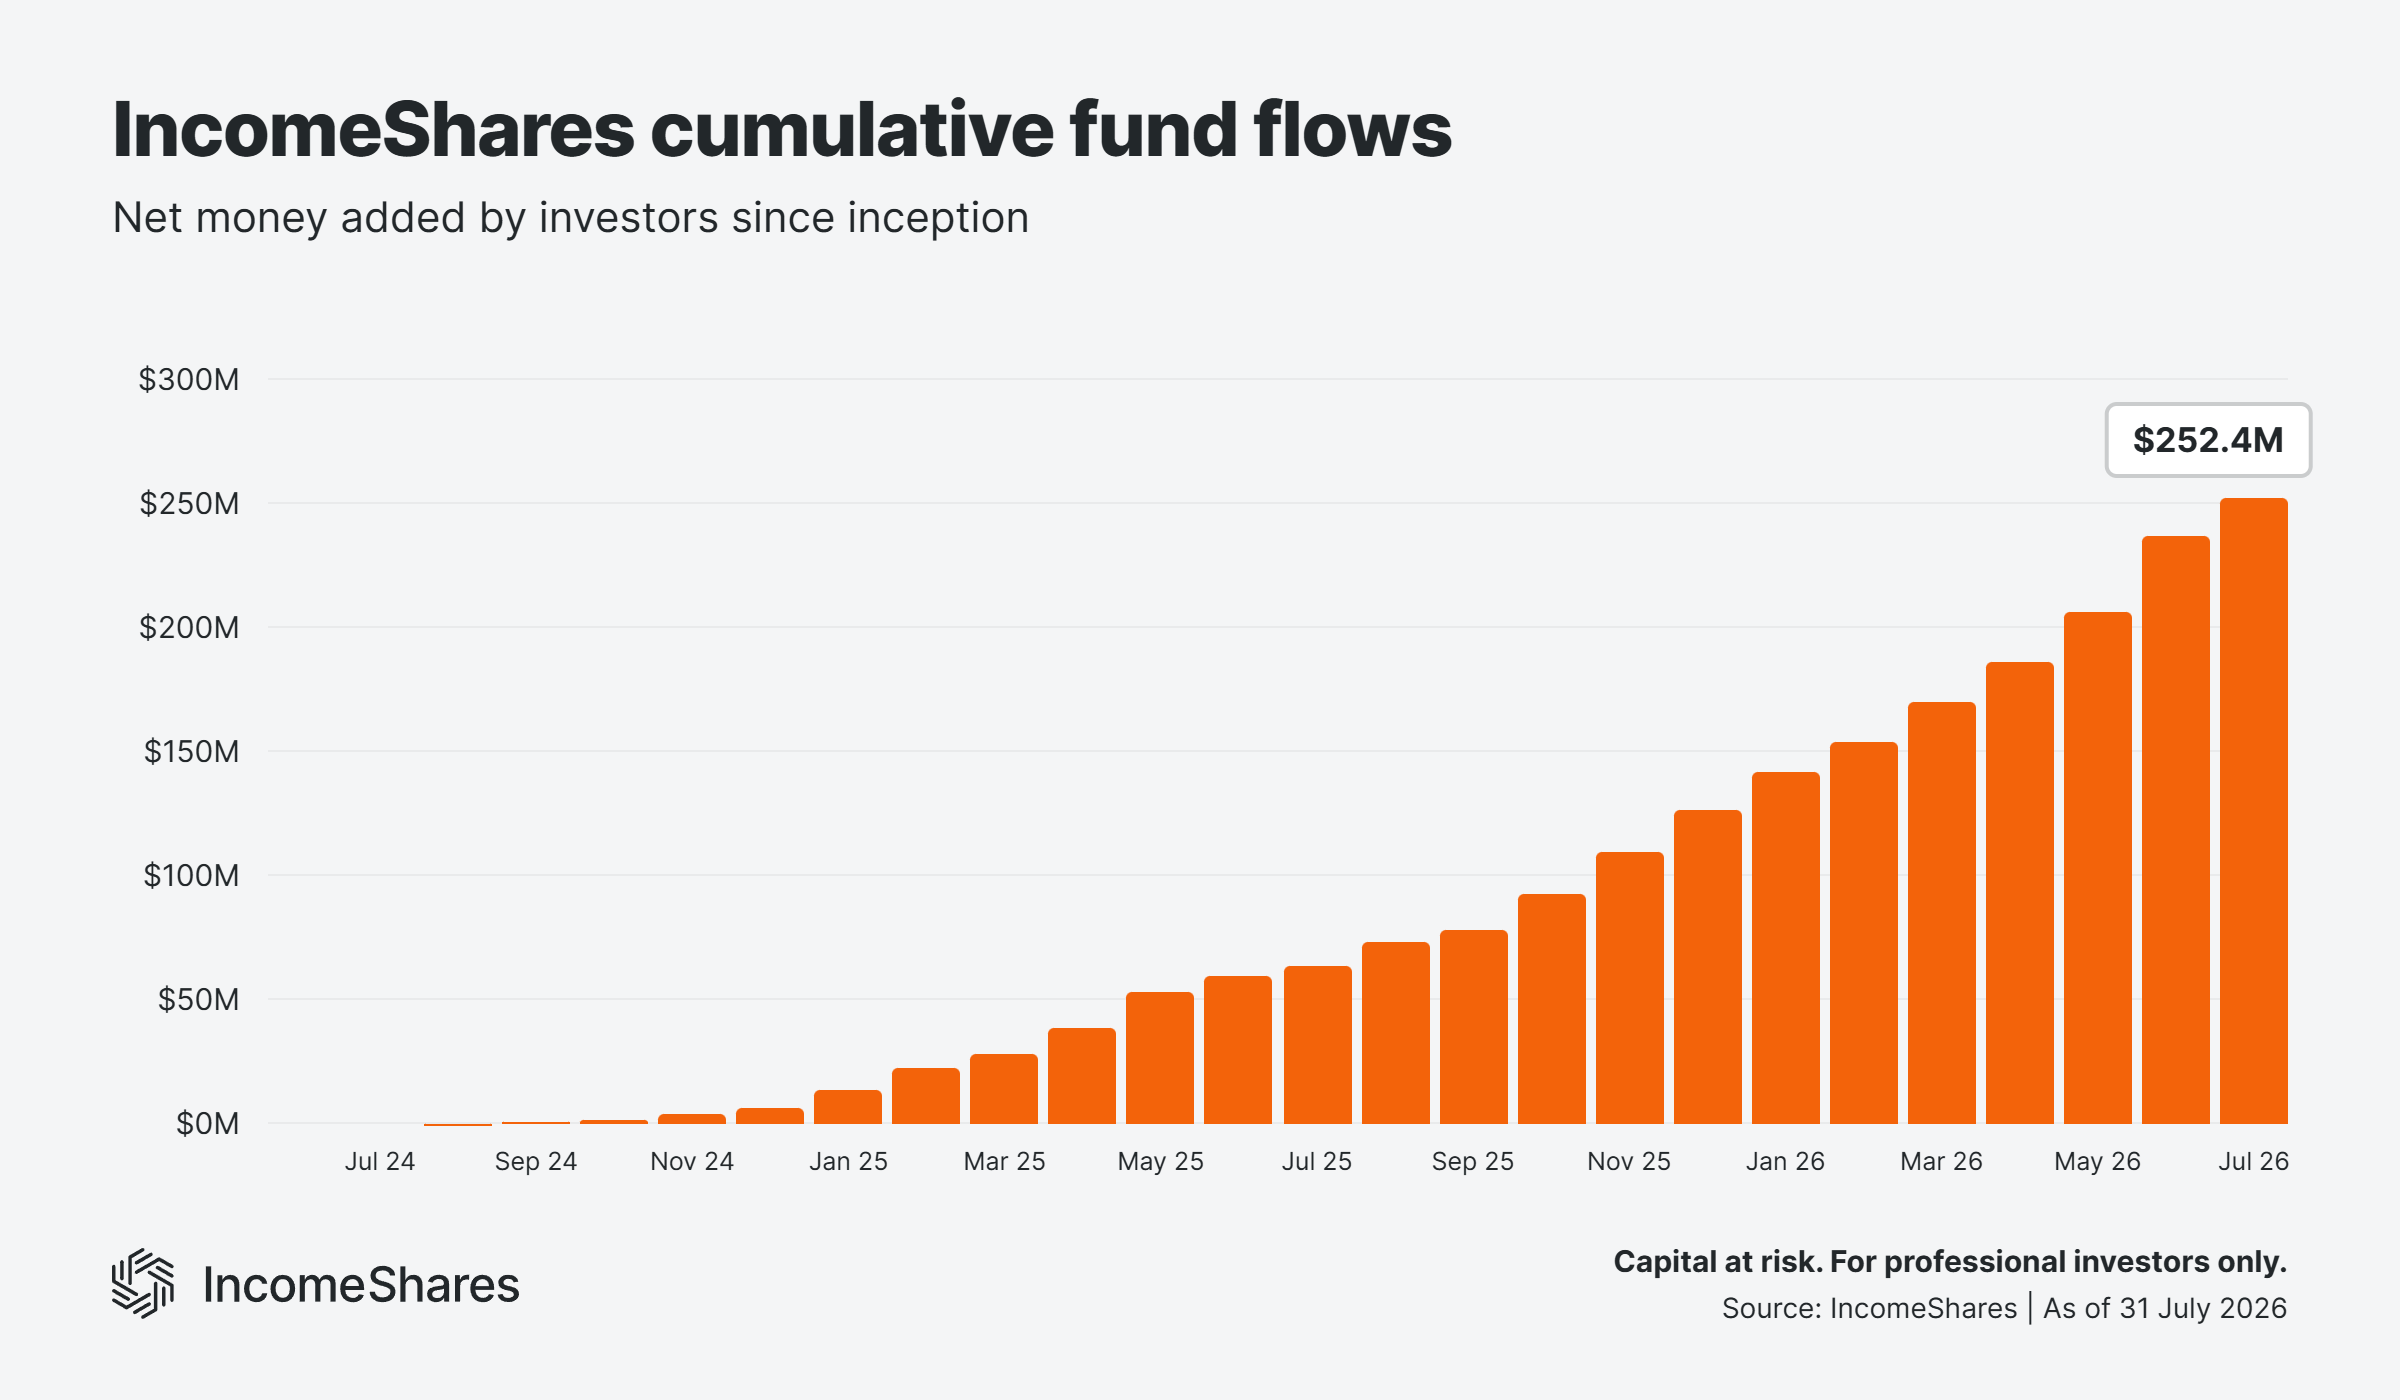
Cumulative fund flows reached $252.4 million by the end of July – a 6.4% increase from June. This metric tracks the net amount of money investors have added to IncomeShares ETPs since inception. Positive flows suggest growing demand.
Net inflows came to $15.2 million for the month. Our Gold+ Yield ETP added $4.1 million – the biggest net inflows of the range. Alphabet and our 75/10/15 Multi-Asset Growth ETPs followed, adding $0.95 and $0.92 million, respectively.
Total fund flows also have risen every month since inception, and continue to exceed total AUM. That's expected for ETPs that pay monthly income. Distributions come from the option premiums each strategy collects. When we pay that income out, the NAV falls by the payout amount – so cumulative inflows can naturally run ahead of AUM over time.
Trading turnover
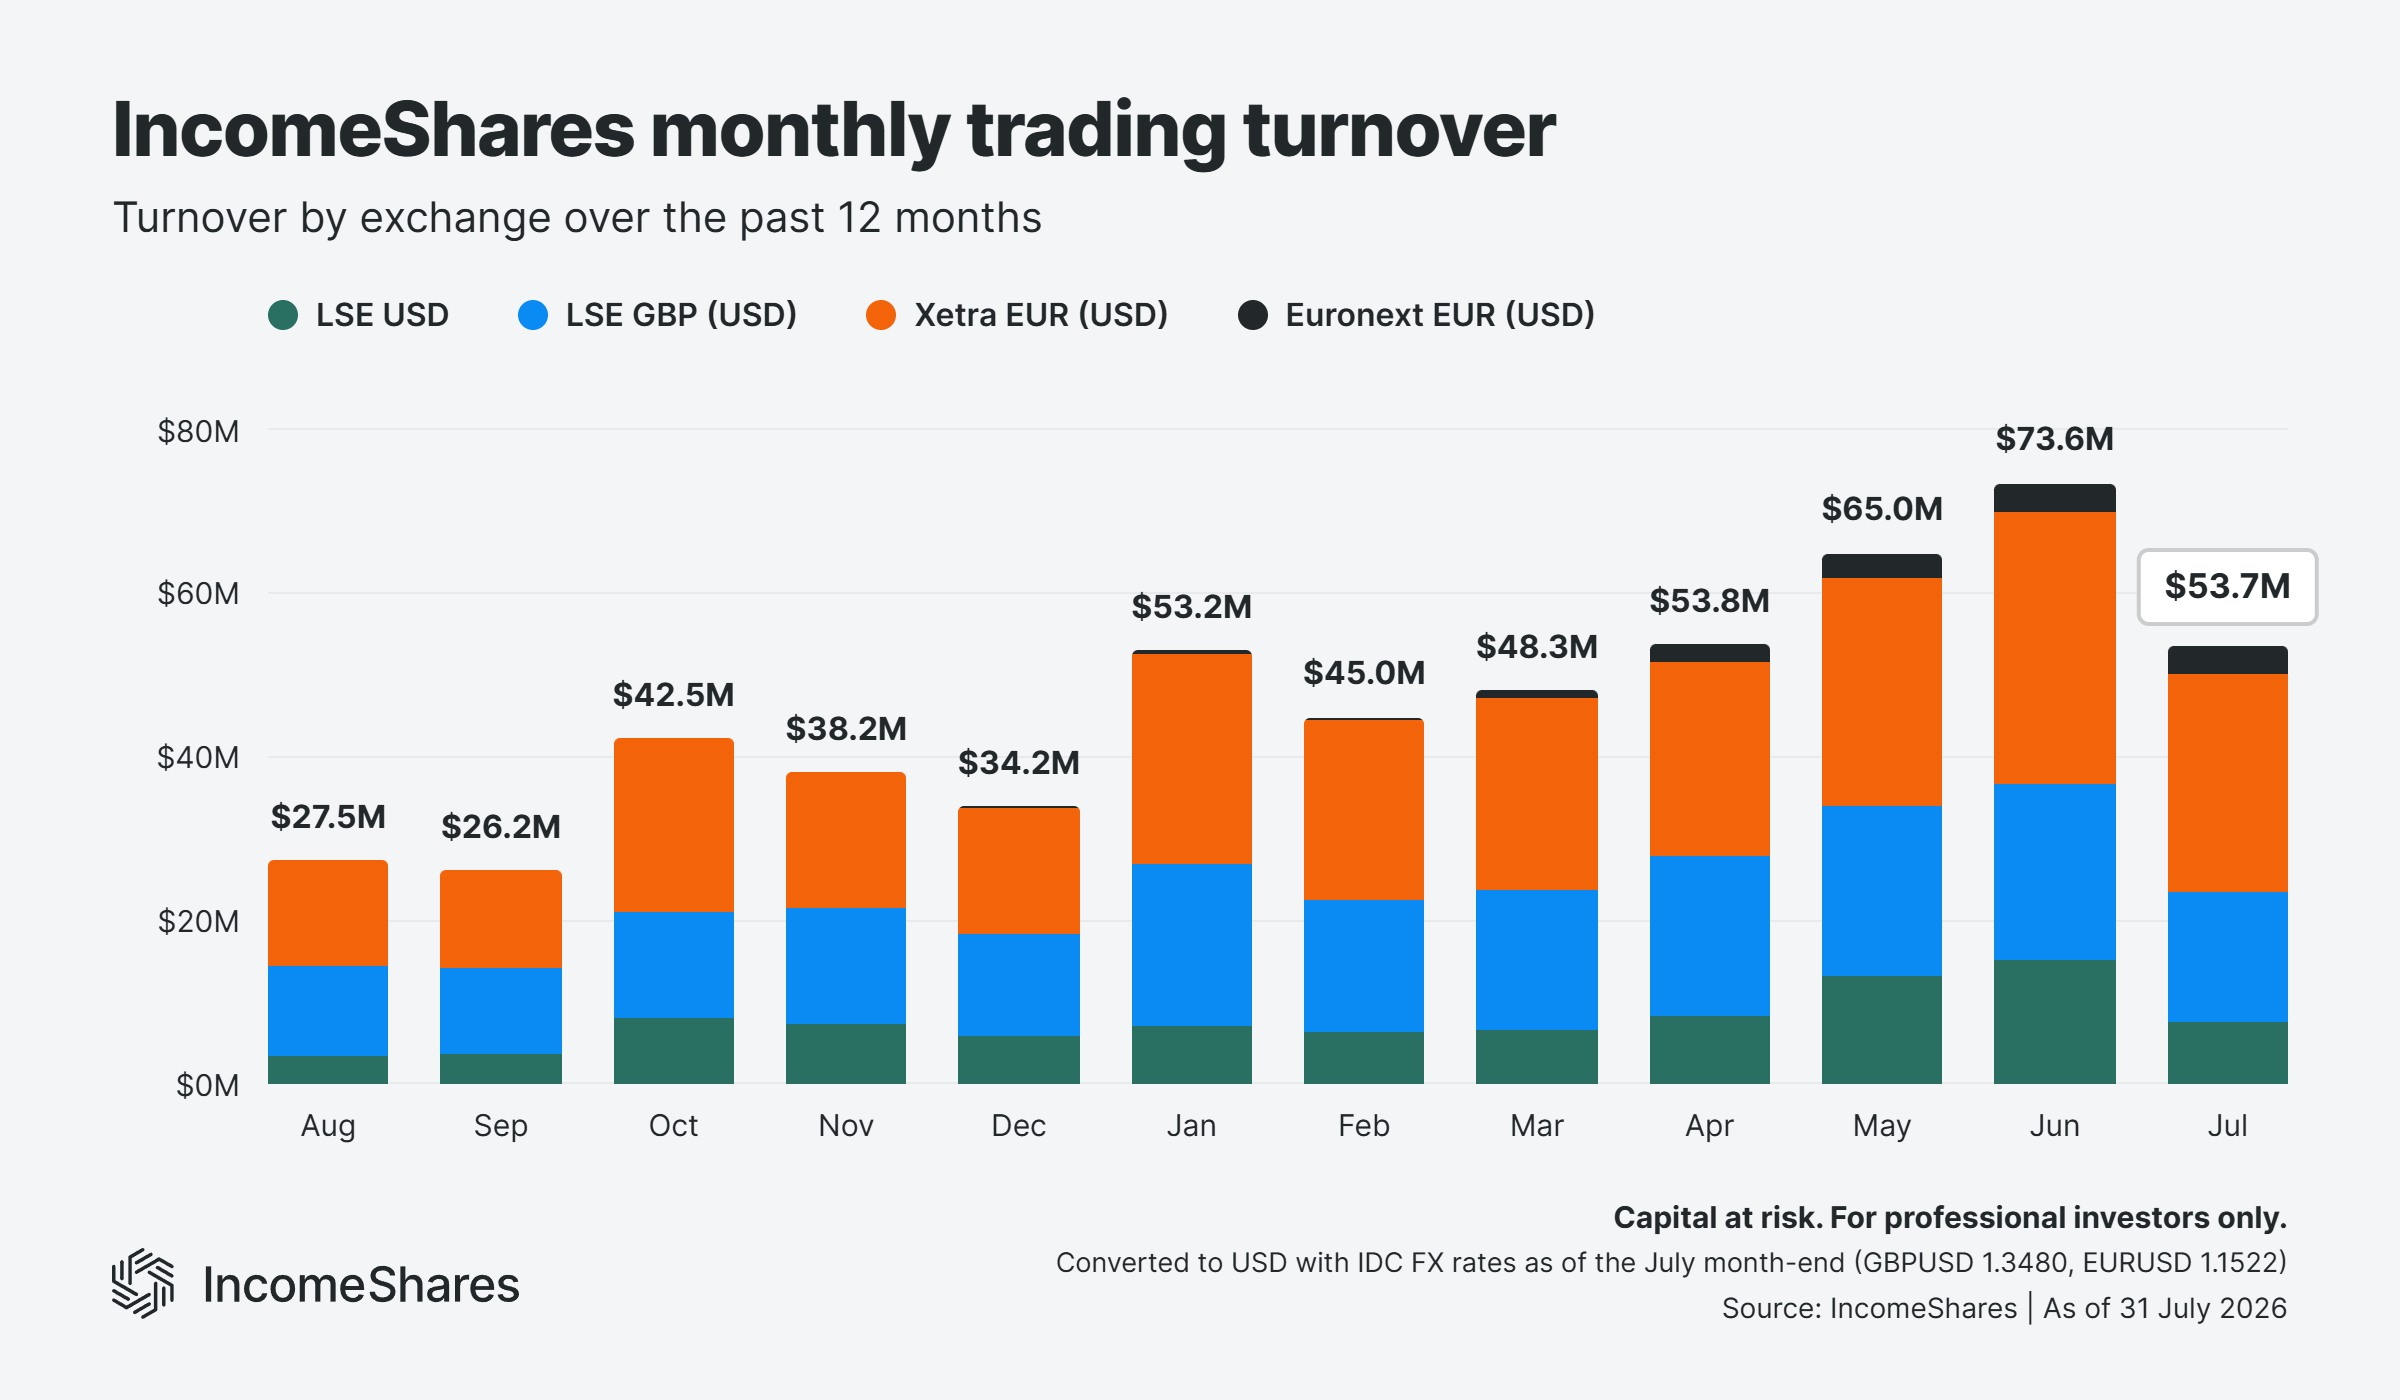
Total IncomeShares trading activity reached $53.7 million across exchanges in July – down about 26% from June's record high.
Xetra led the way with $26.6 million in turnover. Our GBP-denominated ETPs traded $16.1 million on the London Stock Exchange, with USD ETPs at $7.7 million. Euronext Amsterdam turnover came to $3.4 million – close to June's $3.5 million high.
Note: Figures use IDC FX rates as of the July month-end to convert GBP and EUR into USD for comparison.
Distribution yields
Distribution yields represent the annualised income paid to investors as a percentage of an ETP's net asset value, based on the latest month's distribution. IncomeShares ETPs aim to generate this income from selling options. Yields can change each month depending on strategy performance and market volatility.
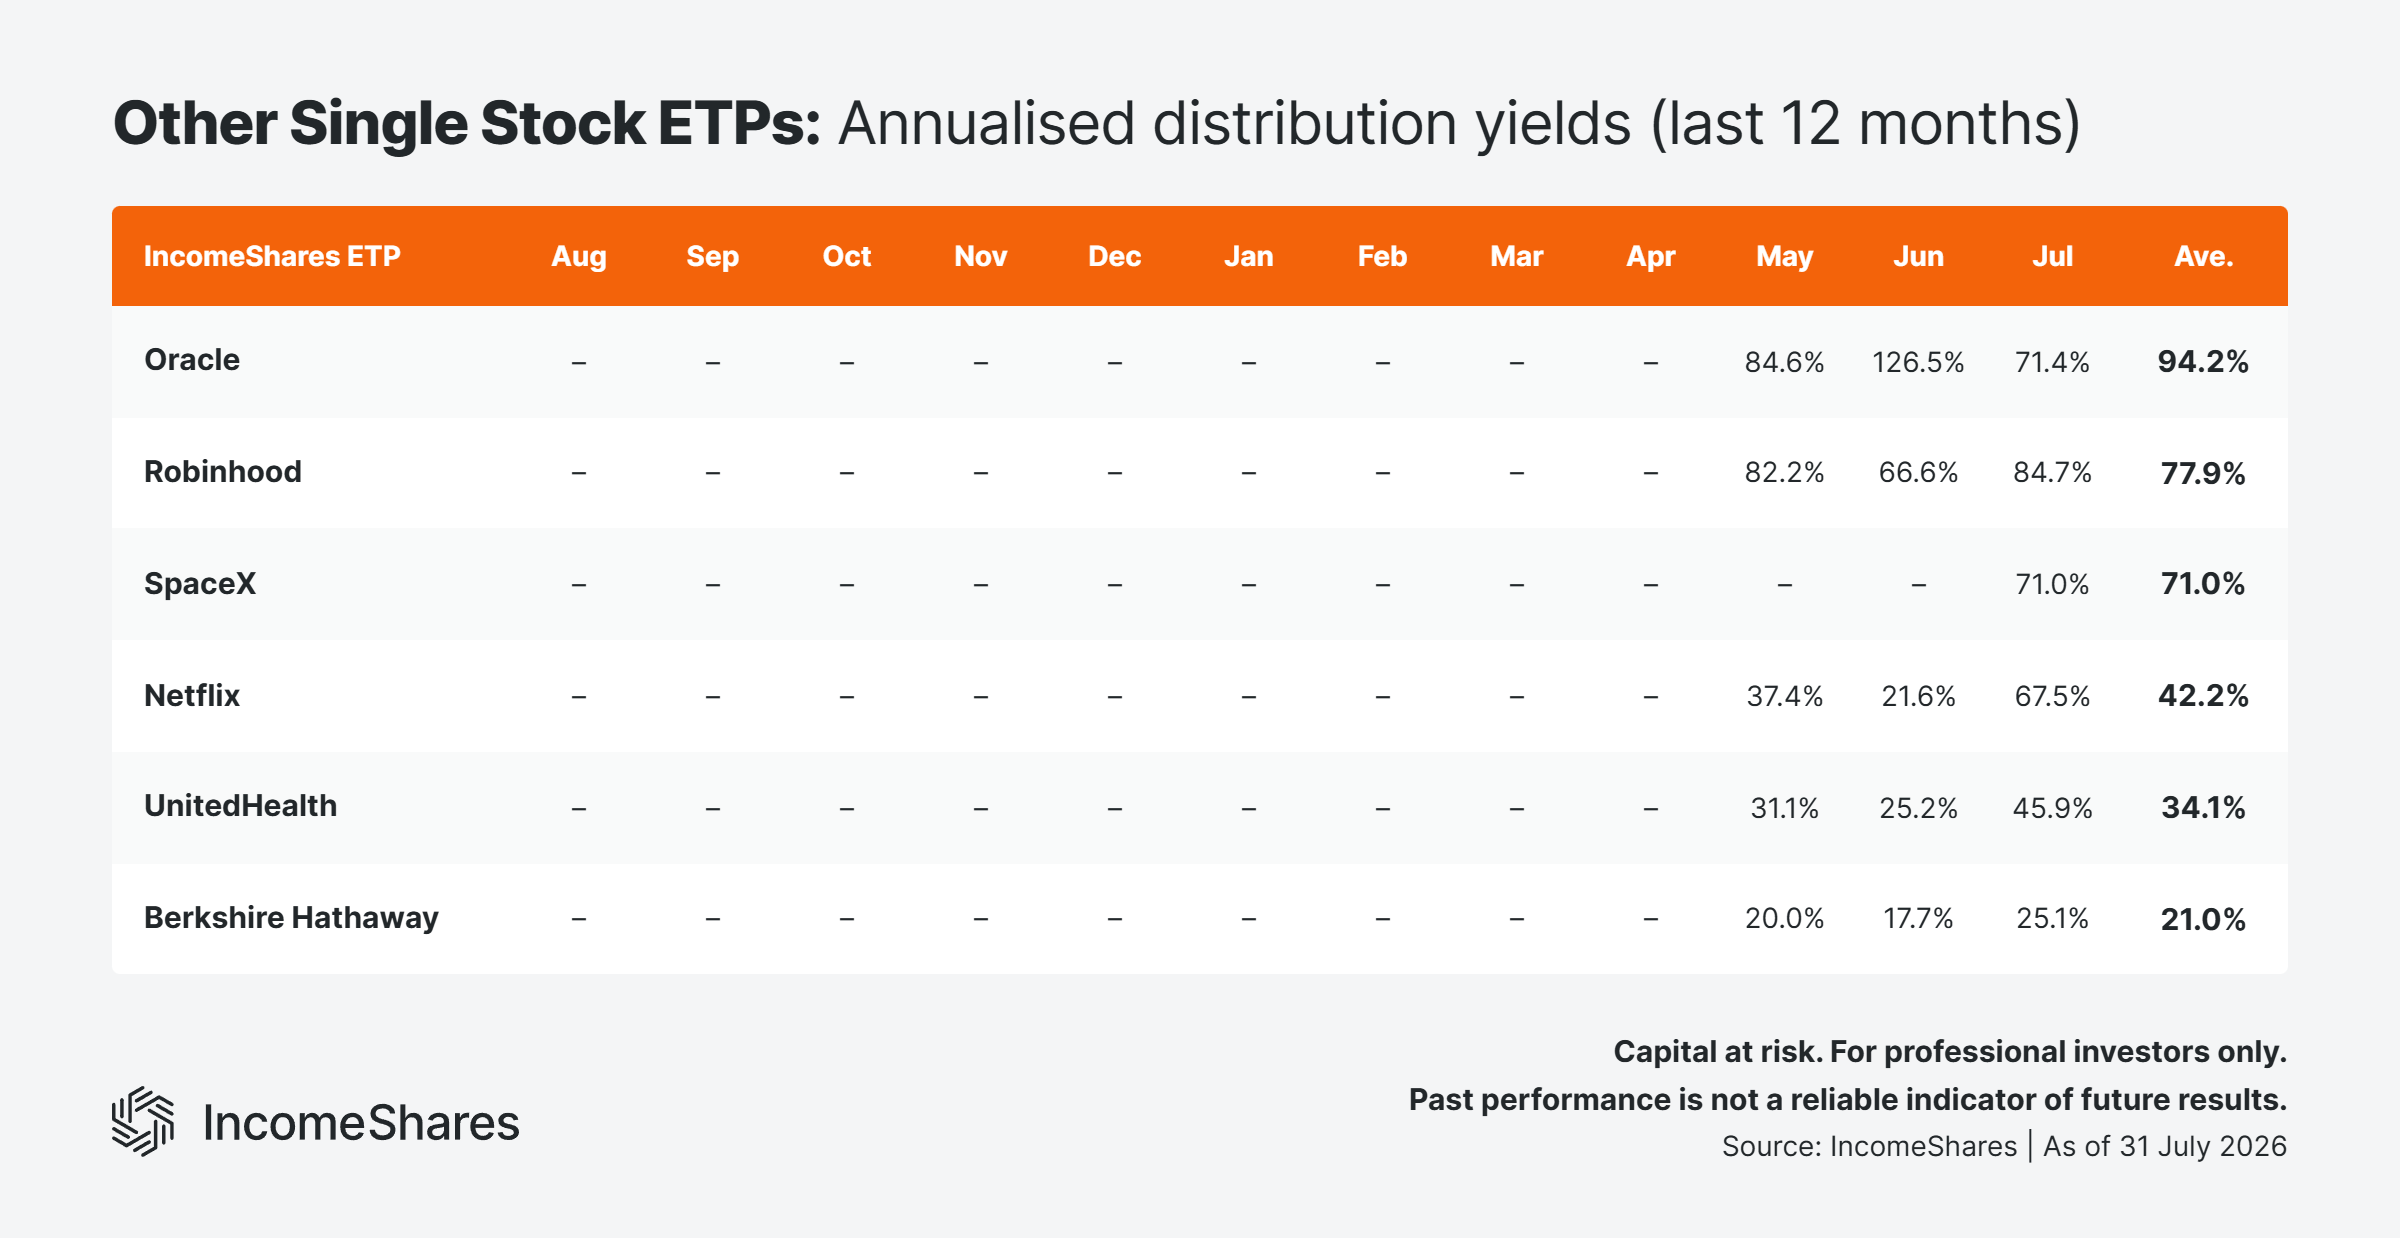
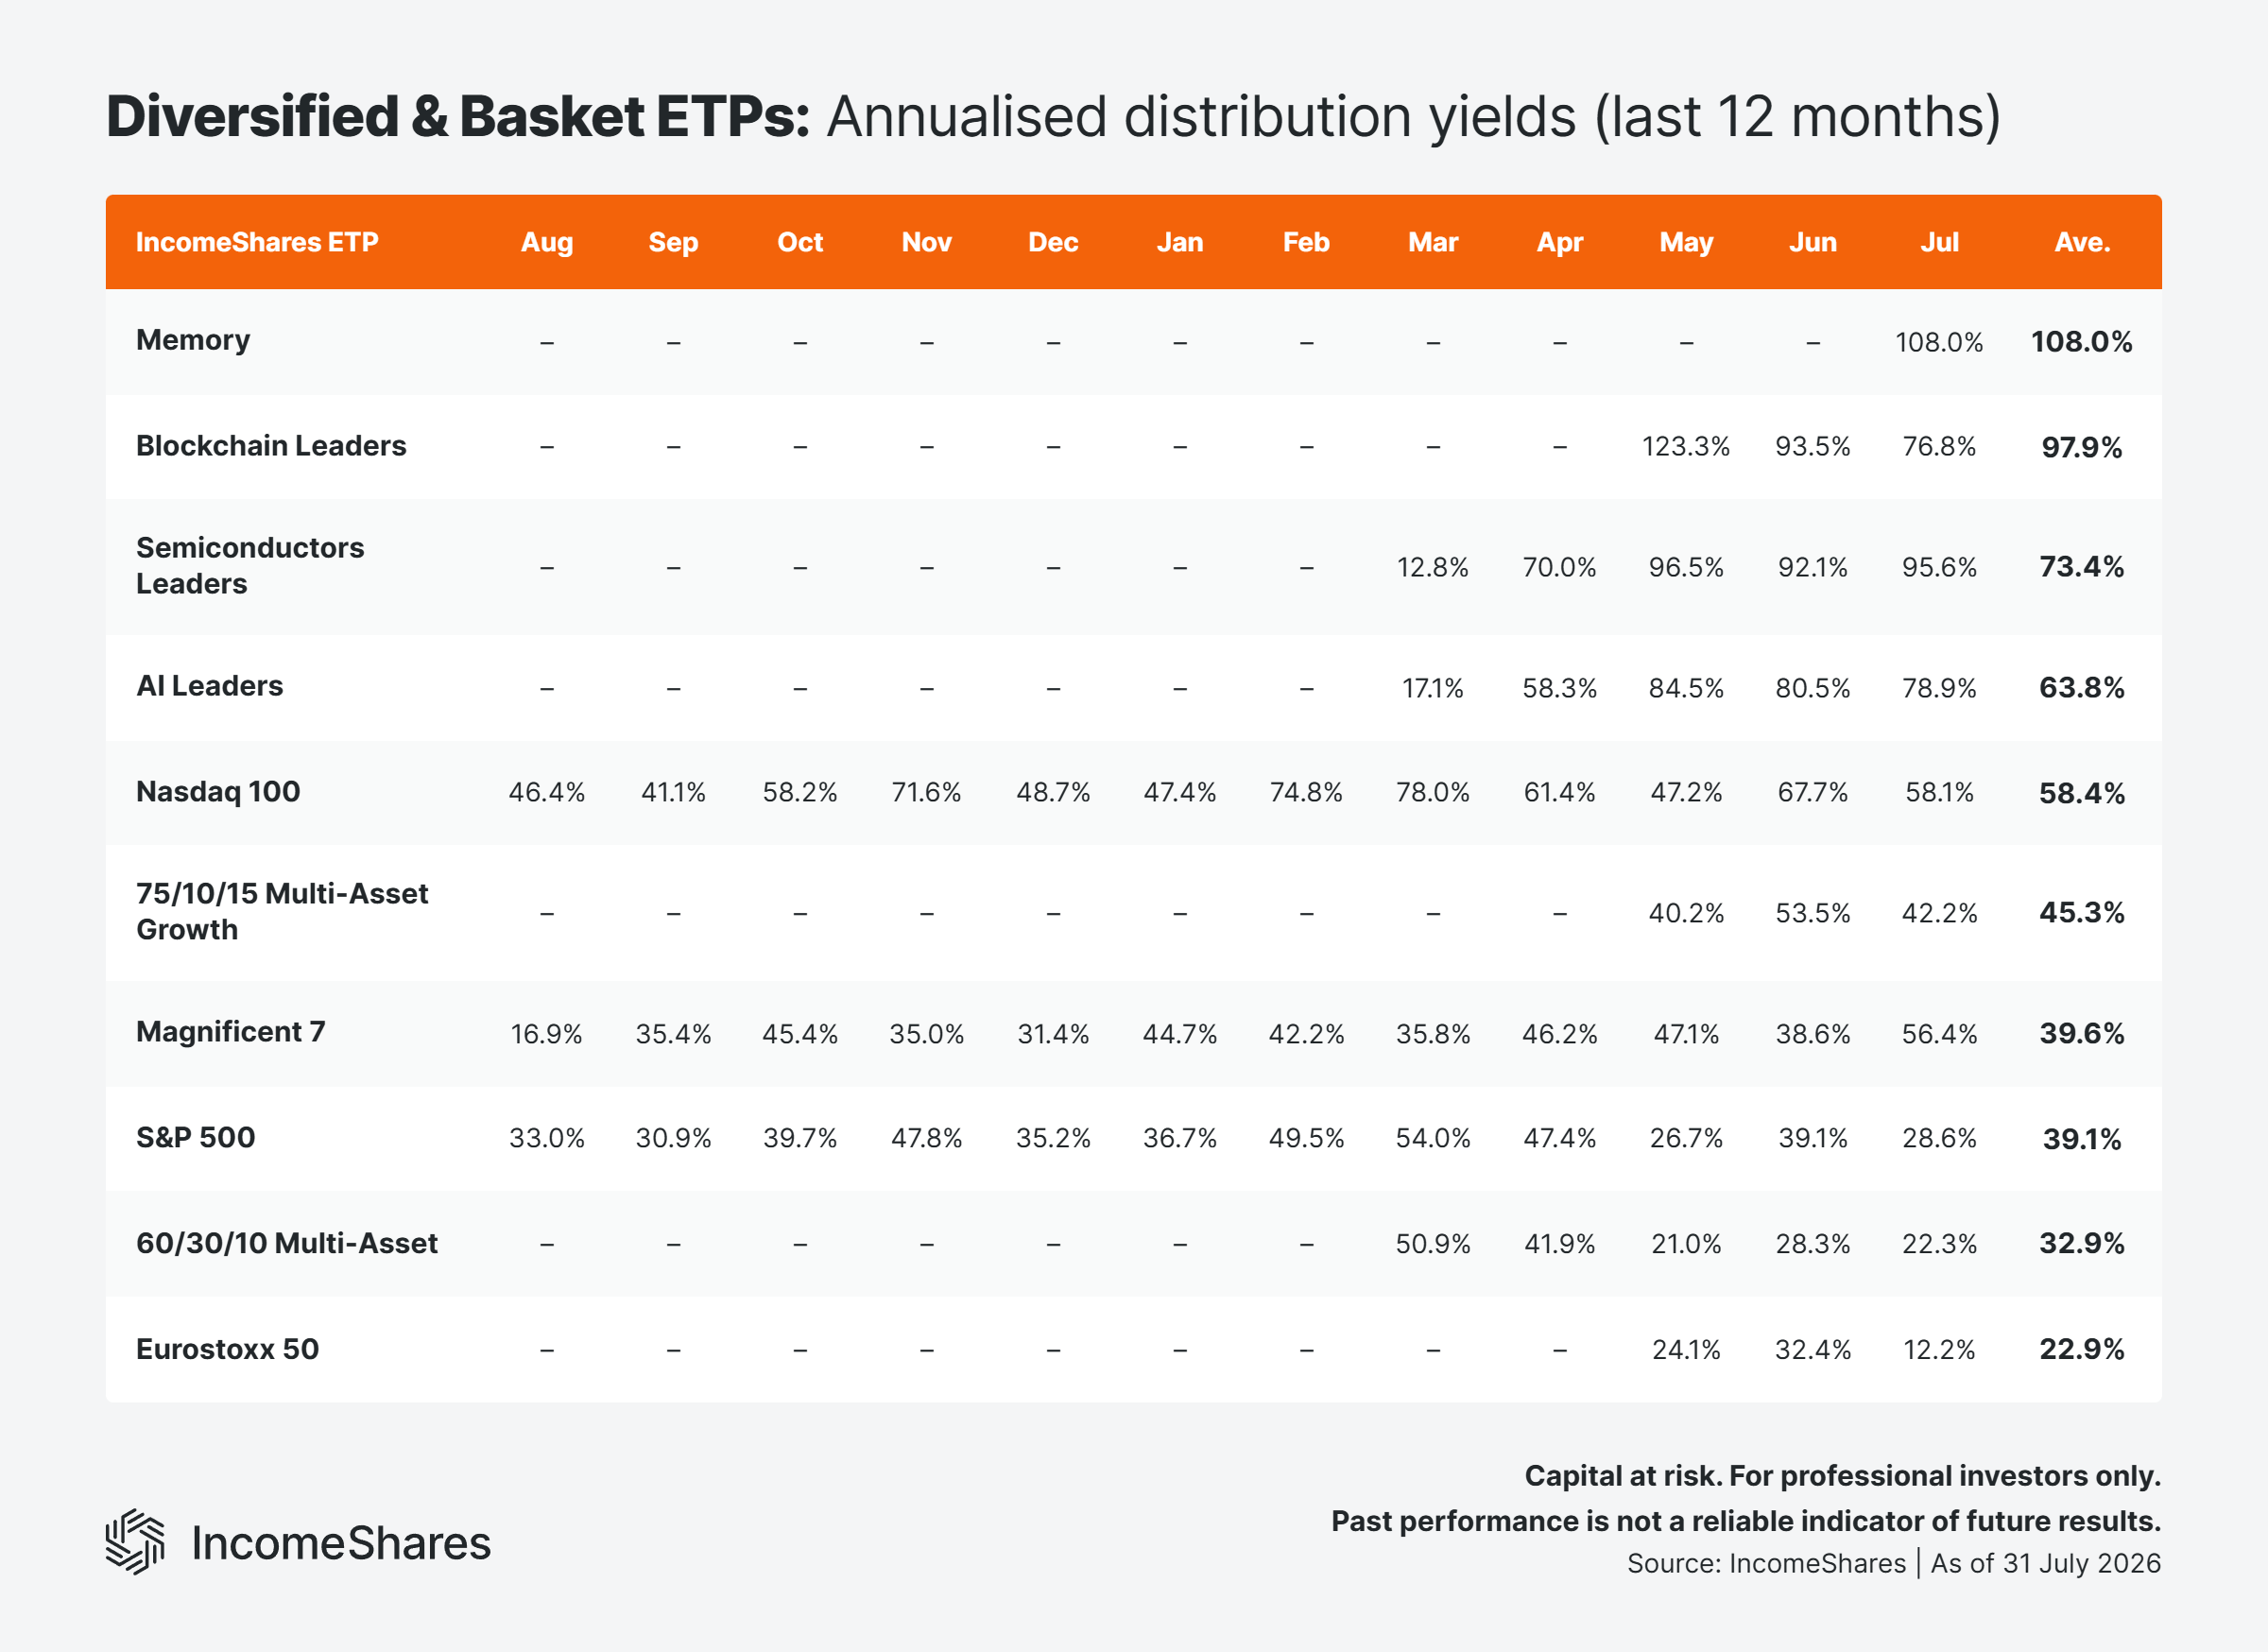
Of the 54 ETPs that paid in June and July, 25 yields rose, 26 fell, and 3 were flat. Our SpaceX and Memory (DRAM) ETPs paid their first income distributions in July, at 71% and 108% annualised.
Late July brought the peak of the quarterly earnings season, with Intel, Meta, Microsoft, Apple, and Amazon all reporting. Implied volatility has tended to rise into earnings, which can mean larger premiums for options sellers.
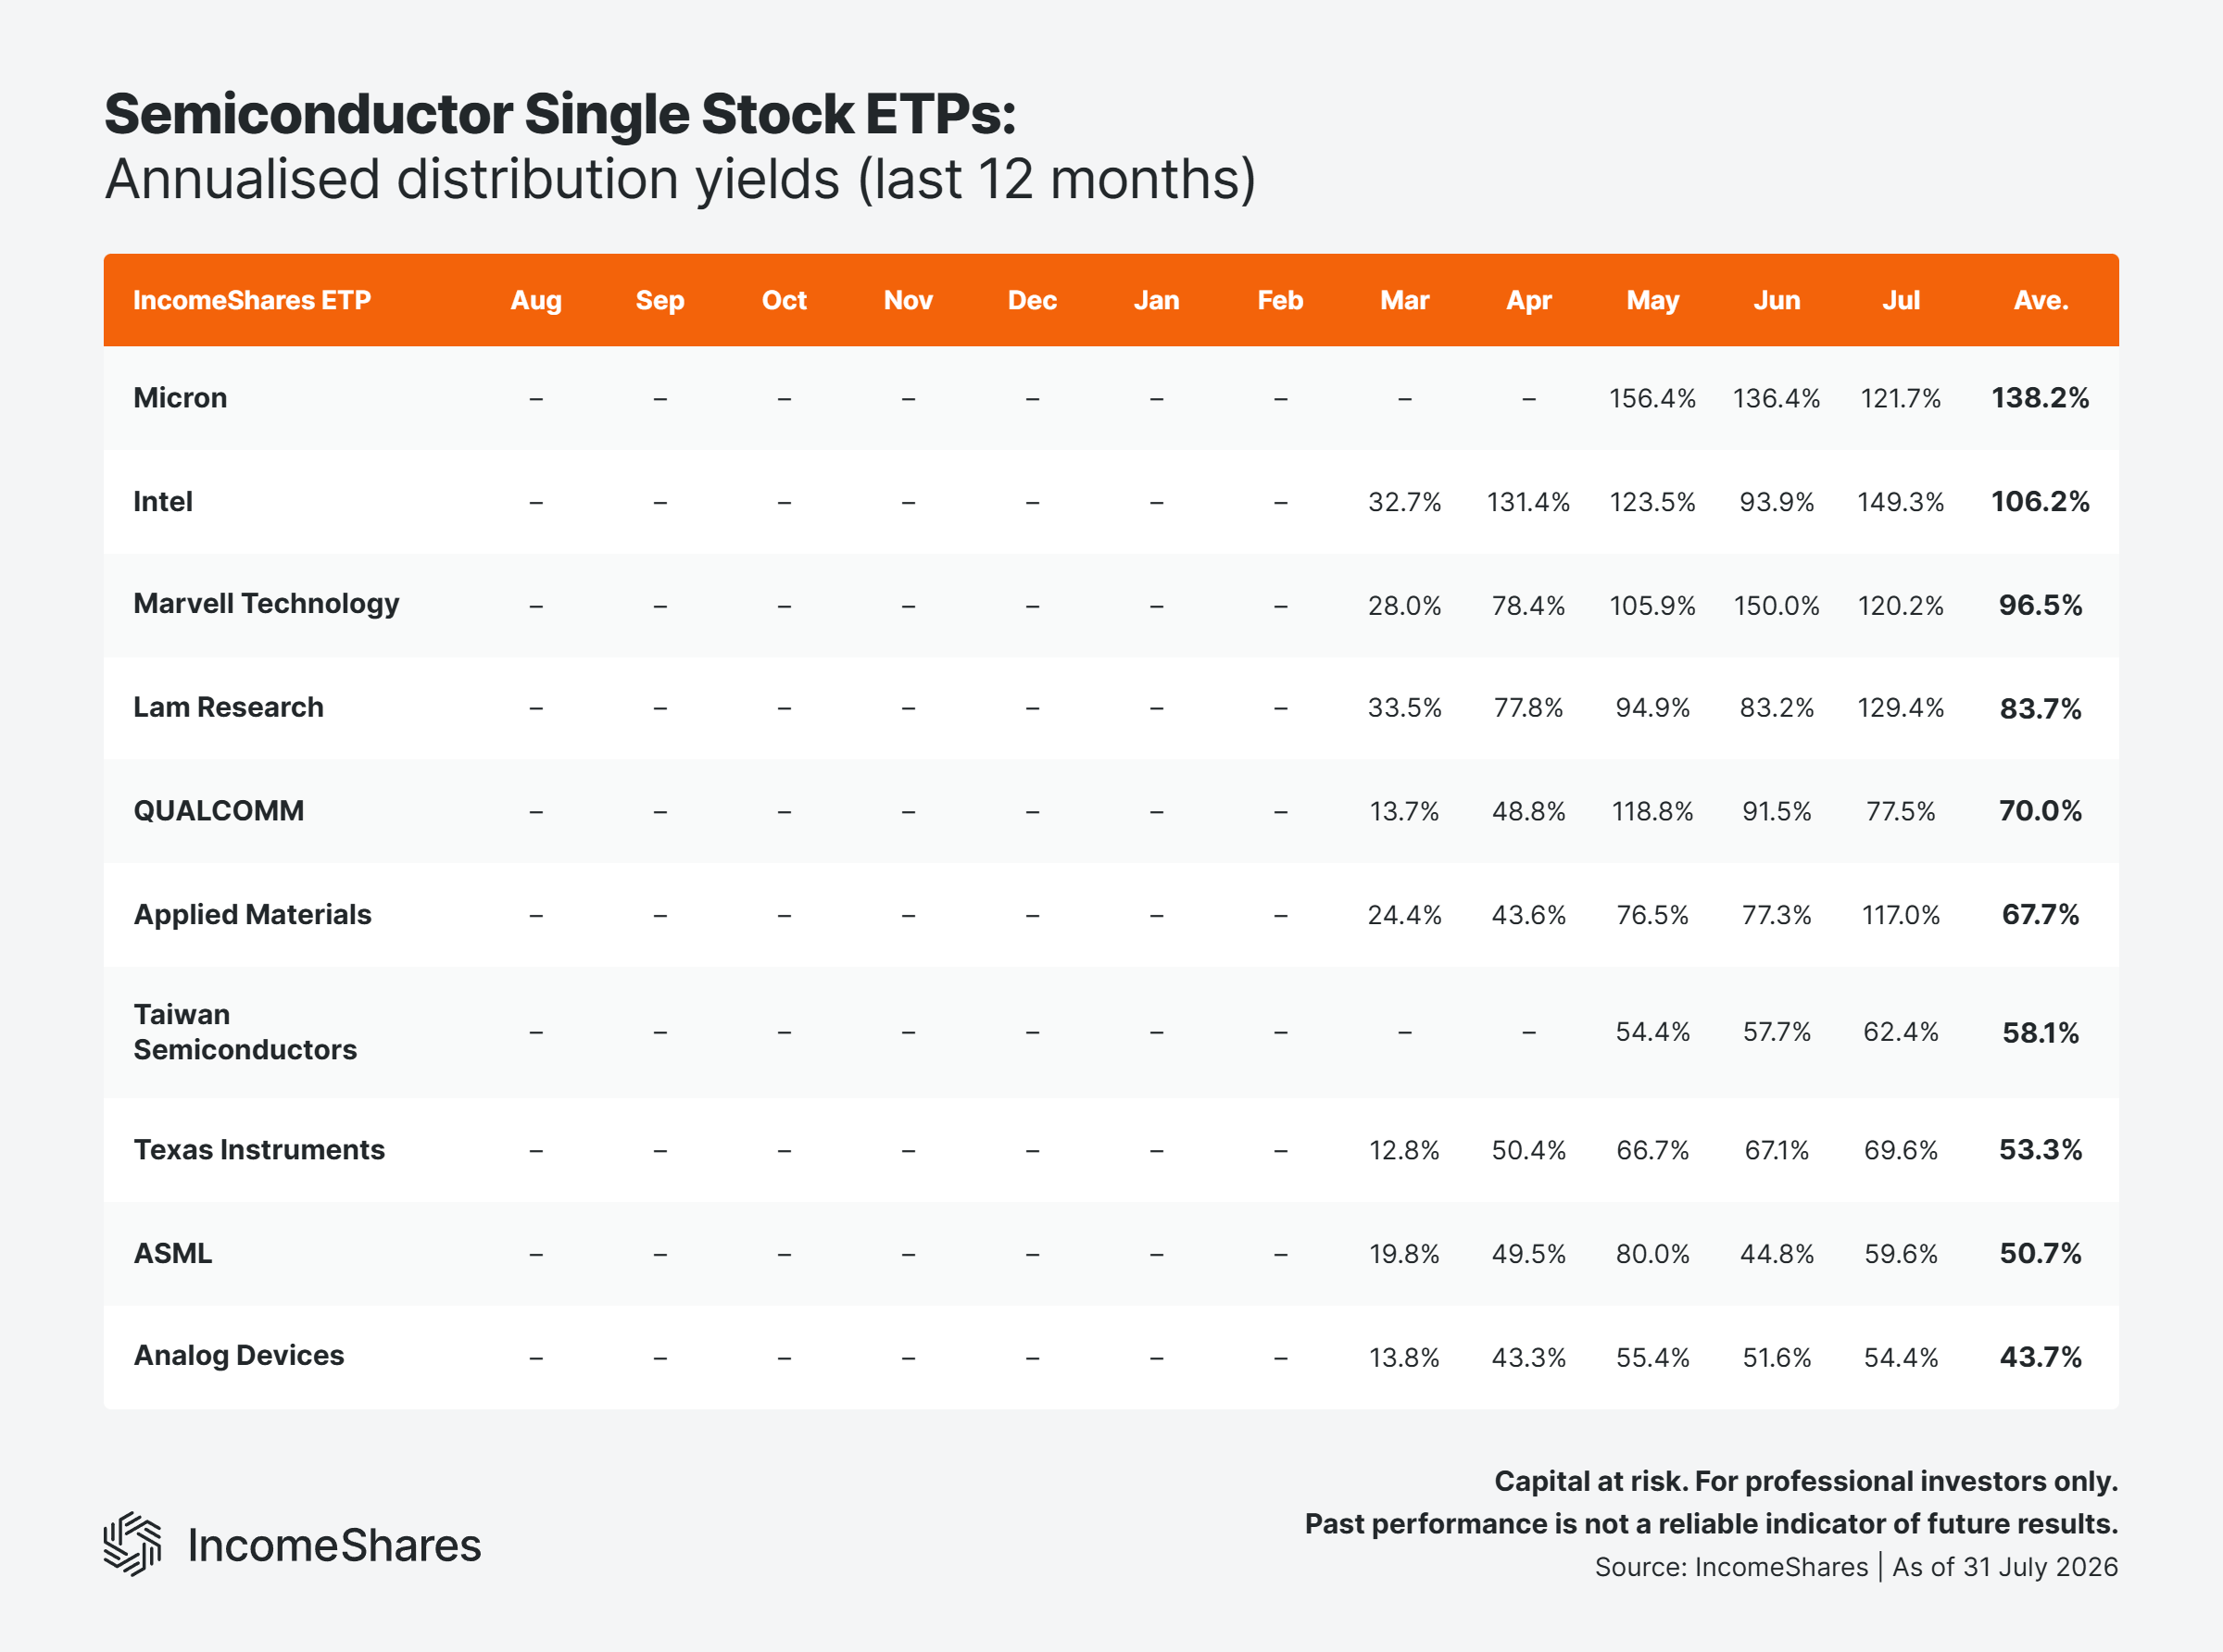
Semiconductor ETPs paid some of the highest yields of the range. Intel rose from 94% to 149% after reporting its fastest quarterly revenue growth since 2011. Lam Research rose from 83% to 129%, and Applied Materials from 77% to 117%.
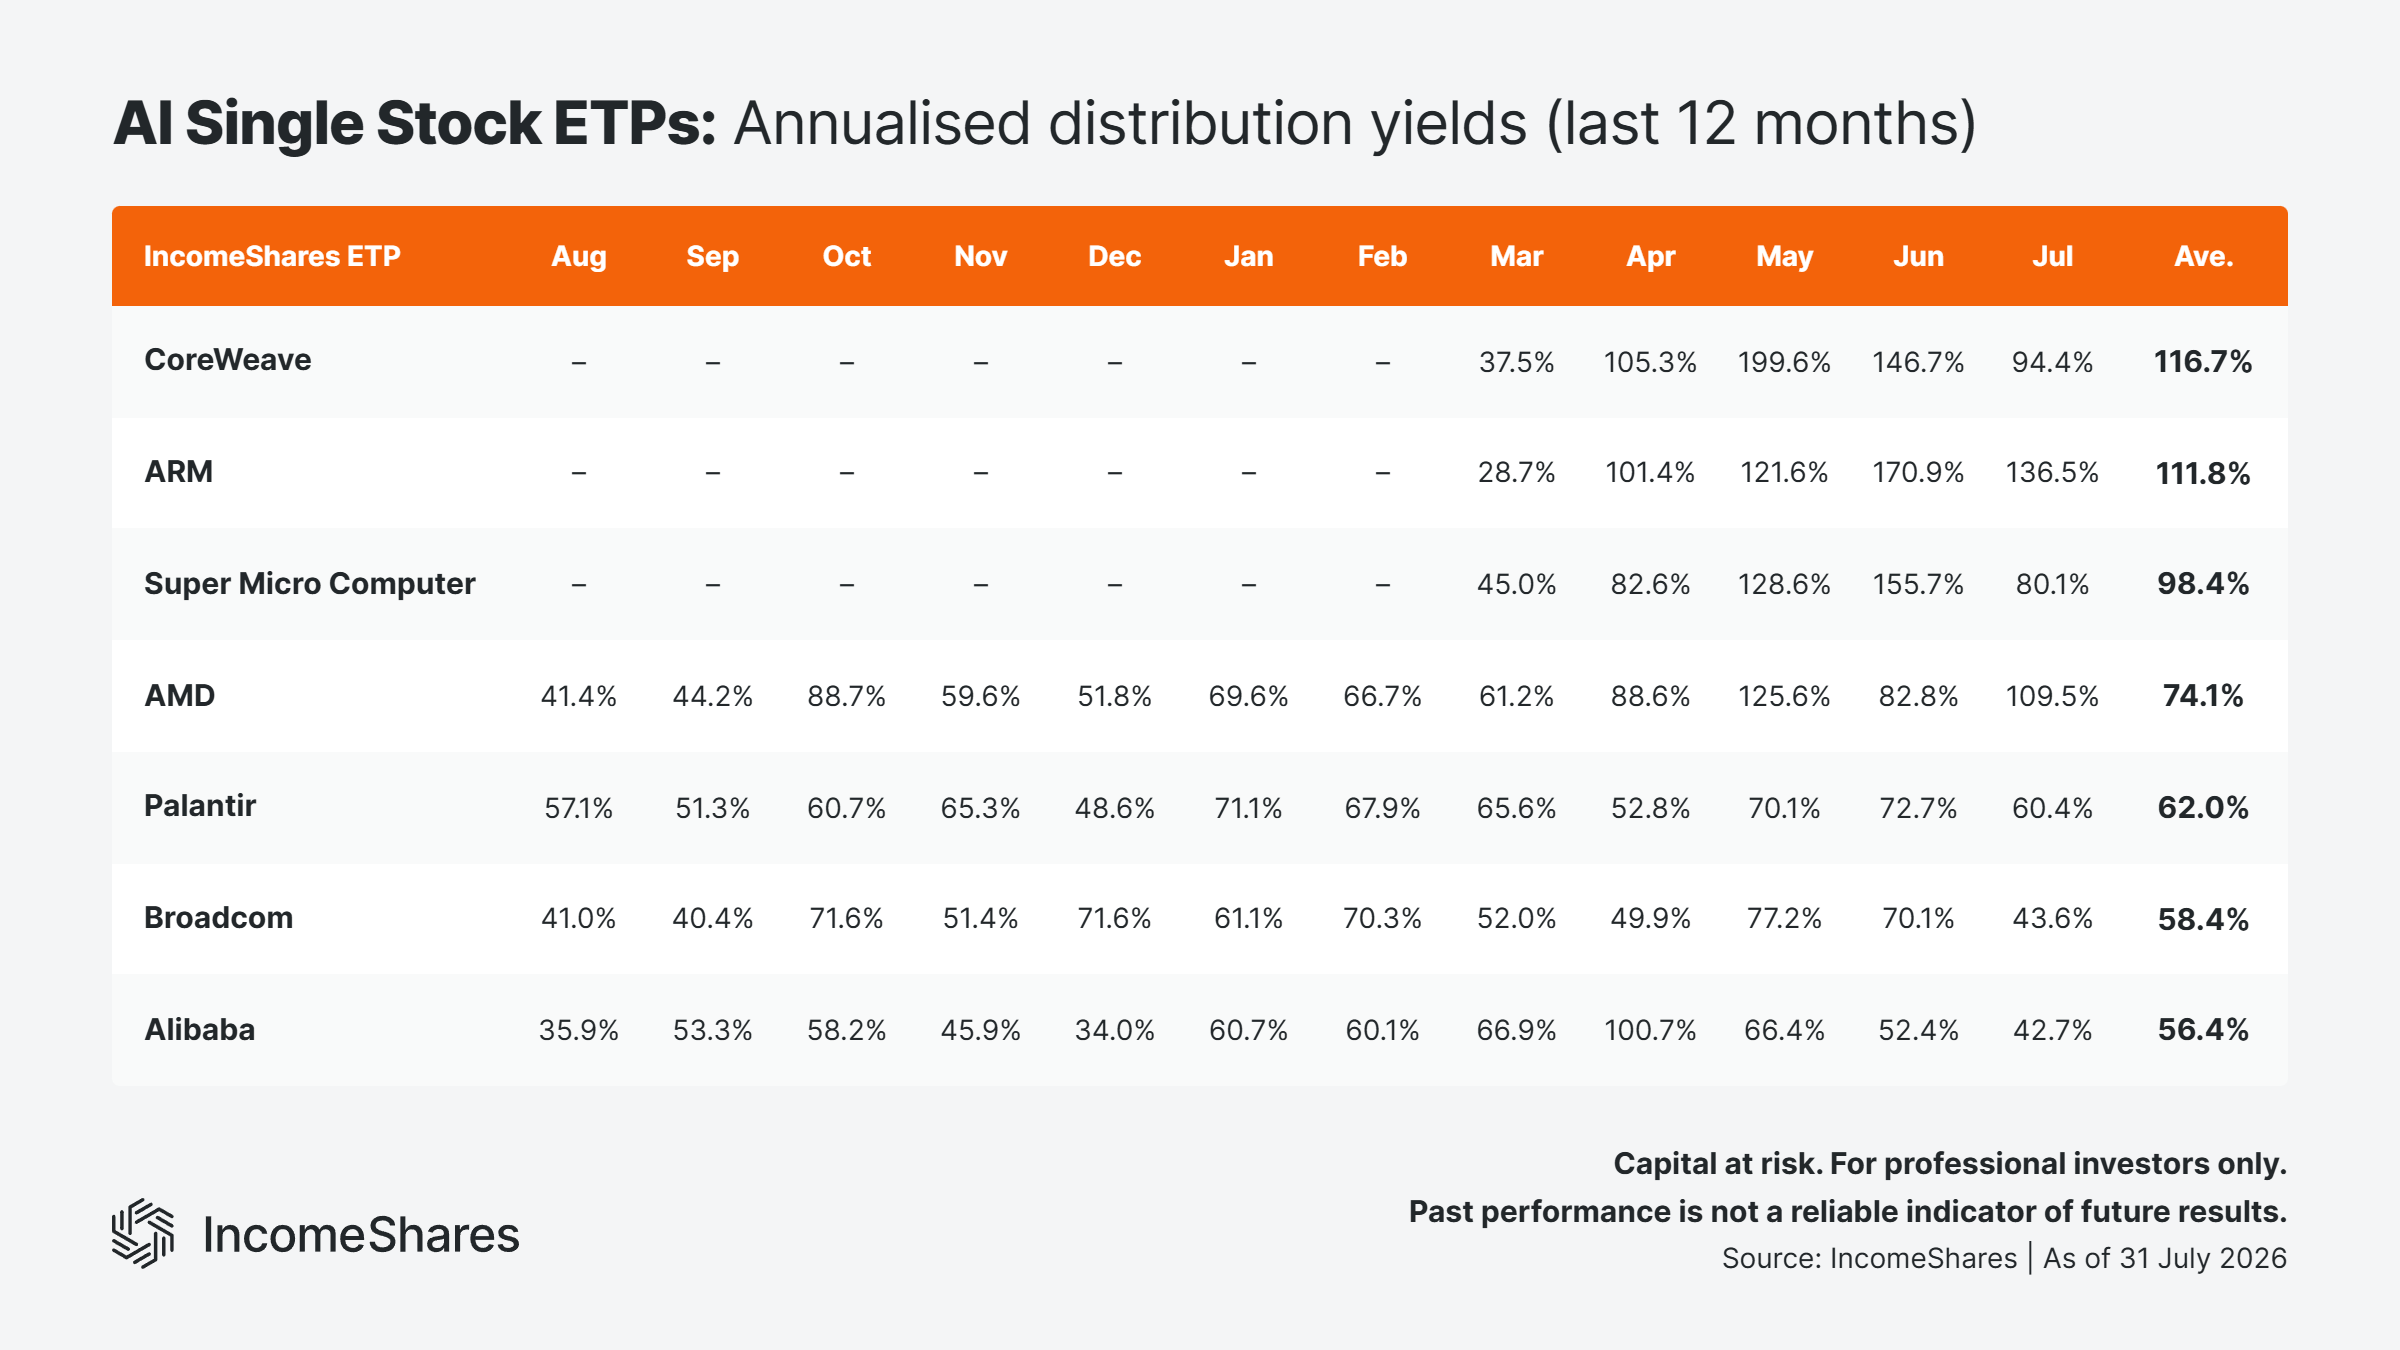
Some of June's biggest income paying ETPs went the other way. Super Micro Computer fell from 156% to 80%, CoreWeave from 147% to 94%, and ARM from 171% to 137%. ARM still paid the second-highest yield of the range.
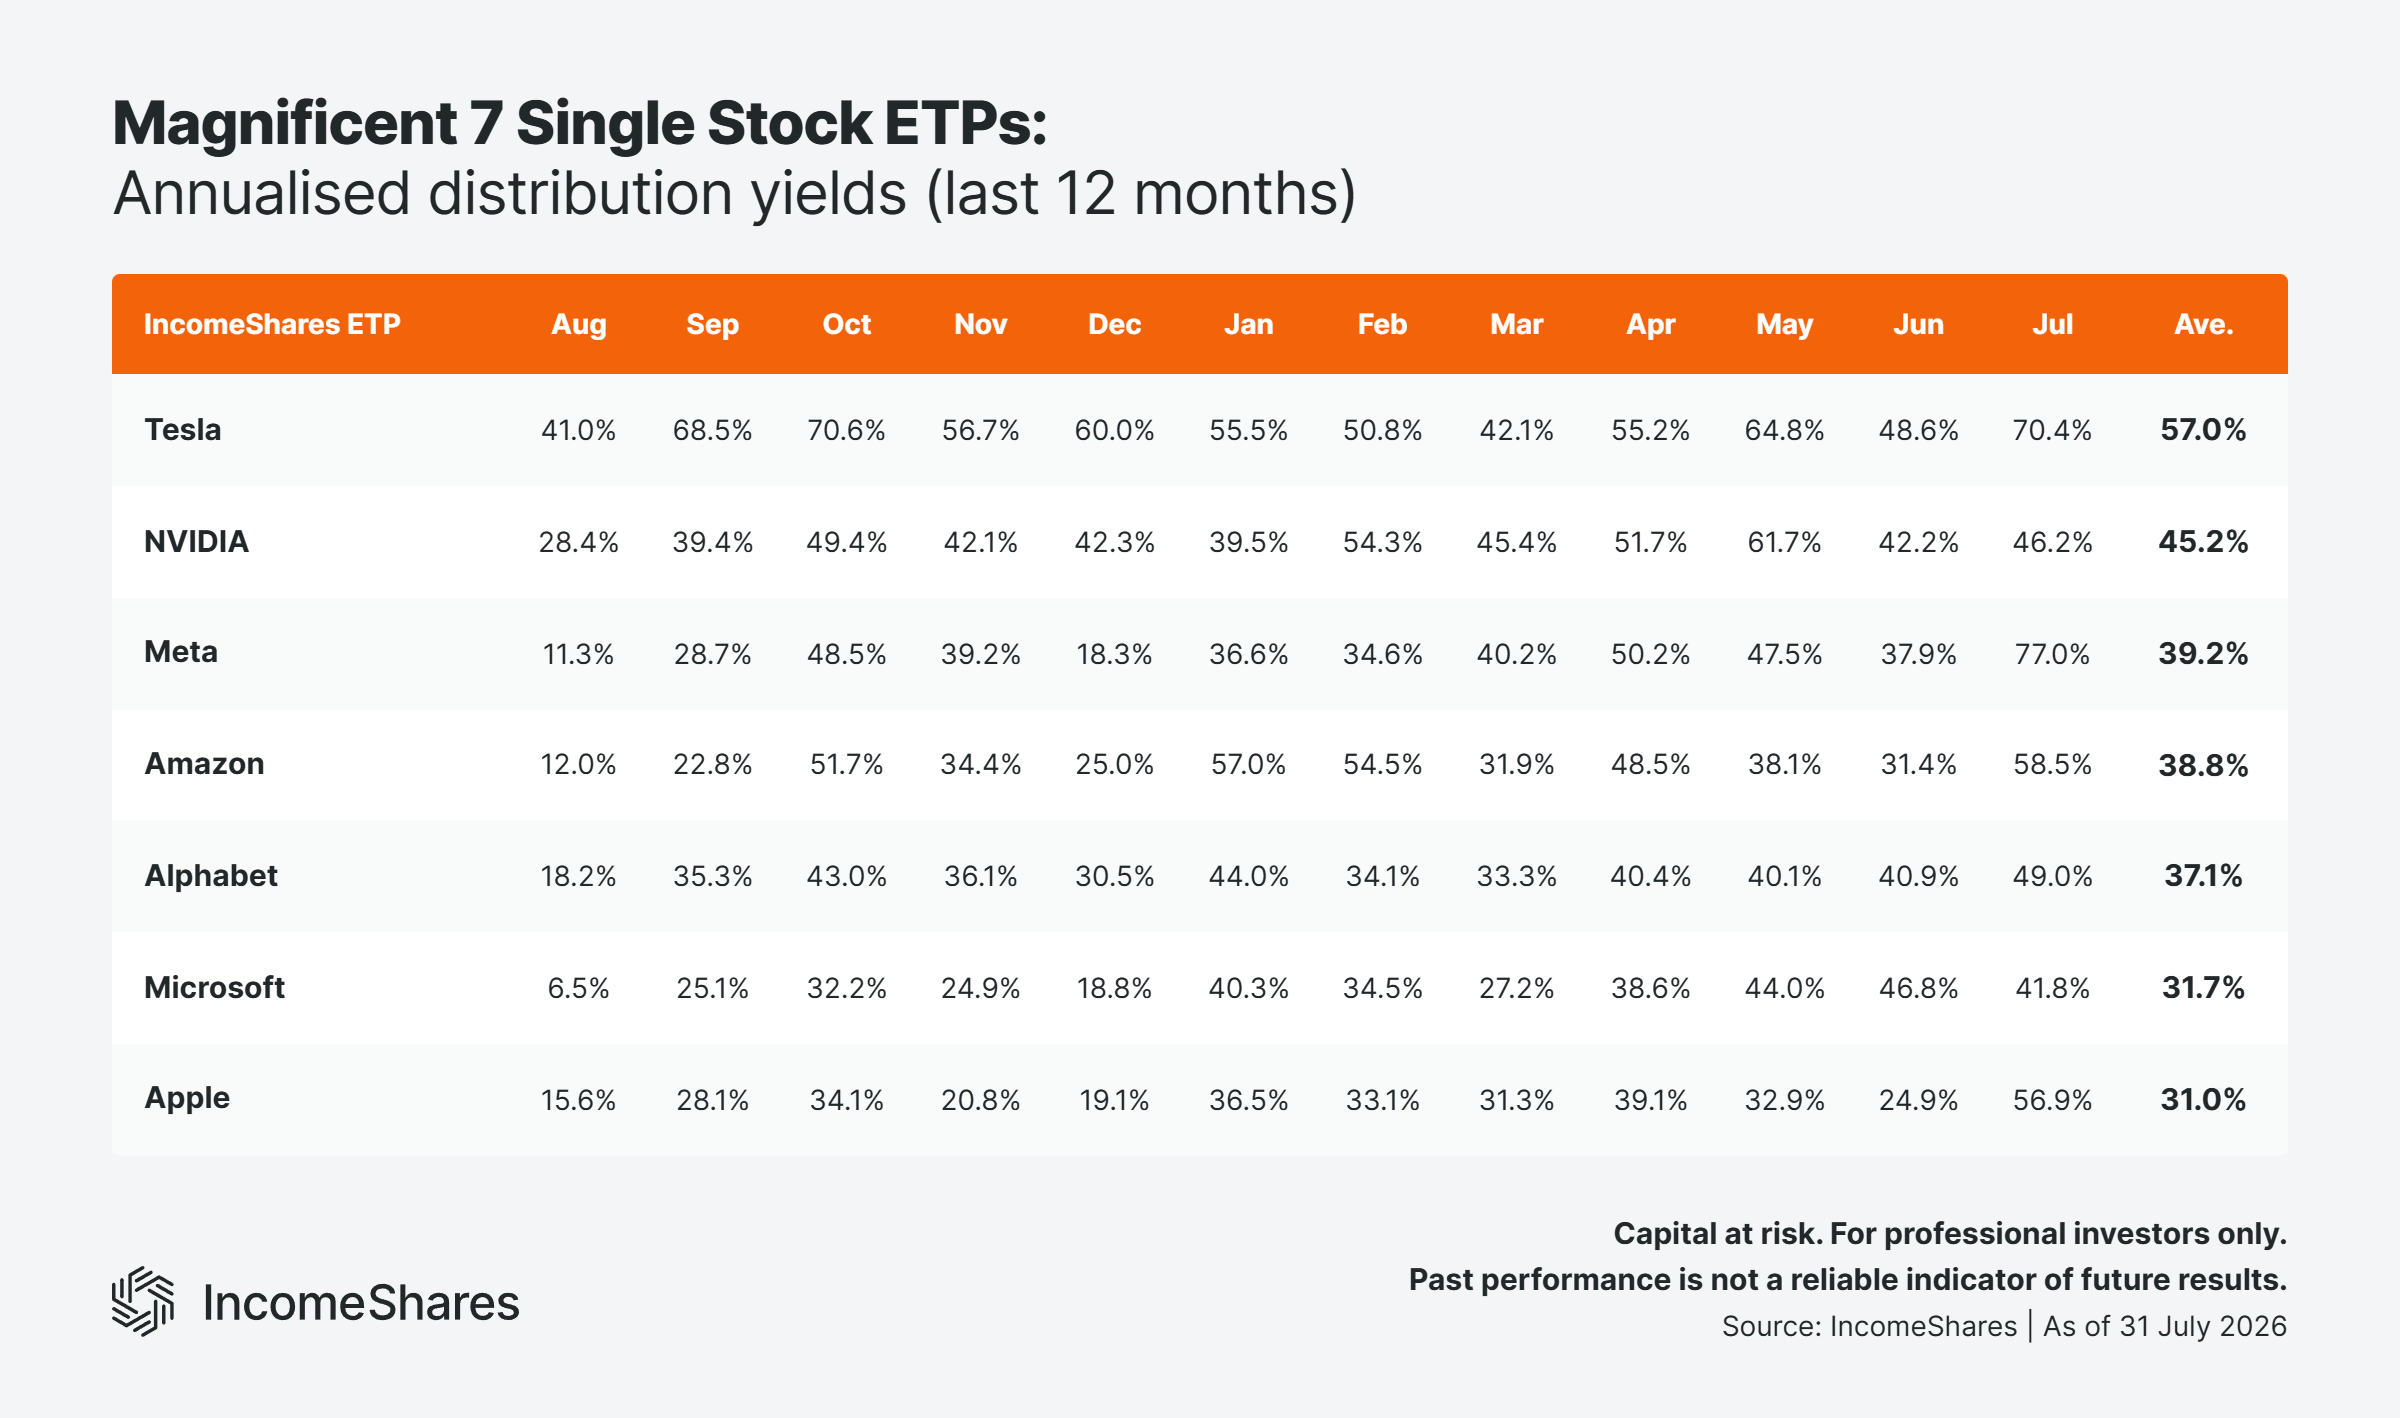
Most Magnificent 7 ETPs paid more. Meta rose from 38% to 77% and beat revenue expectations when it reported on 29 July. Apple rose from 25% to 57%, and Tesla from 49% to 70%.
All three index ETPs paid less. Nasdaq 100 fell from 68% to 58%, and S&P 500 from 39% to 29%. Eurostoxx 50 fell from 32% to 12%.
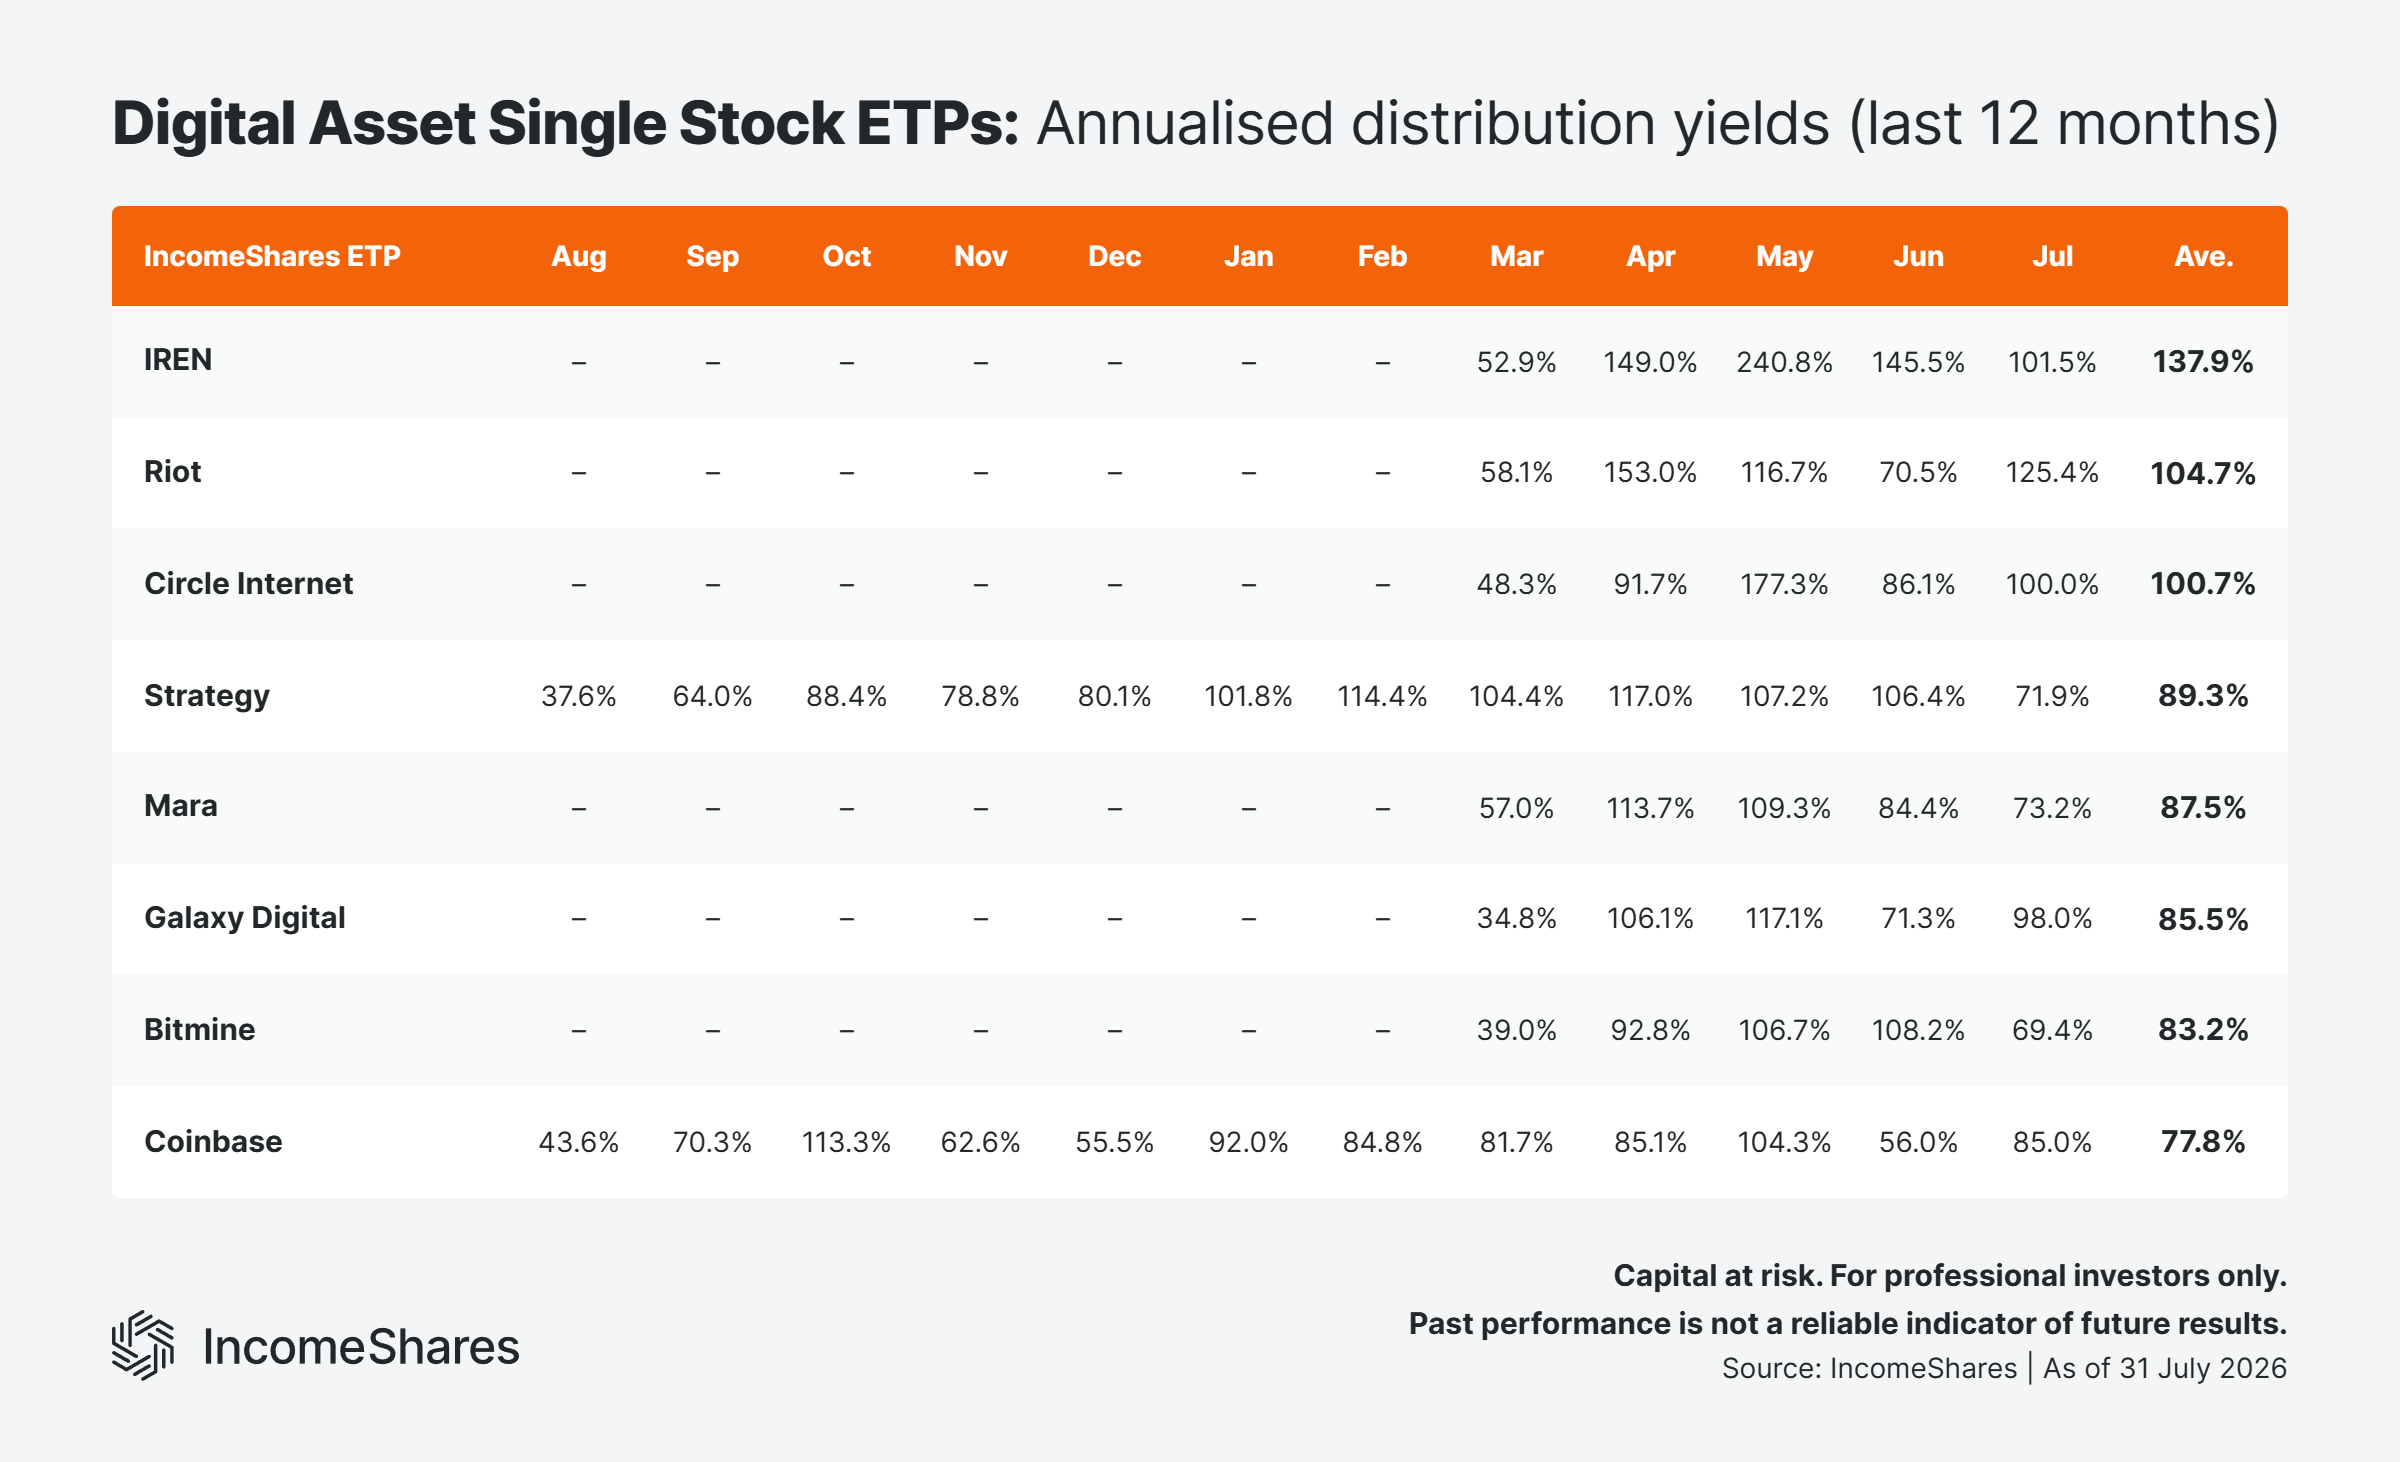
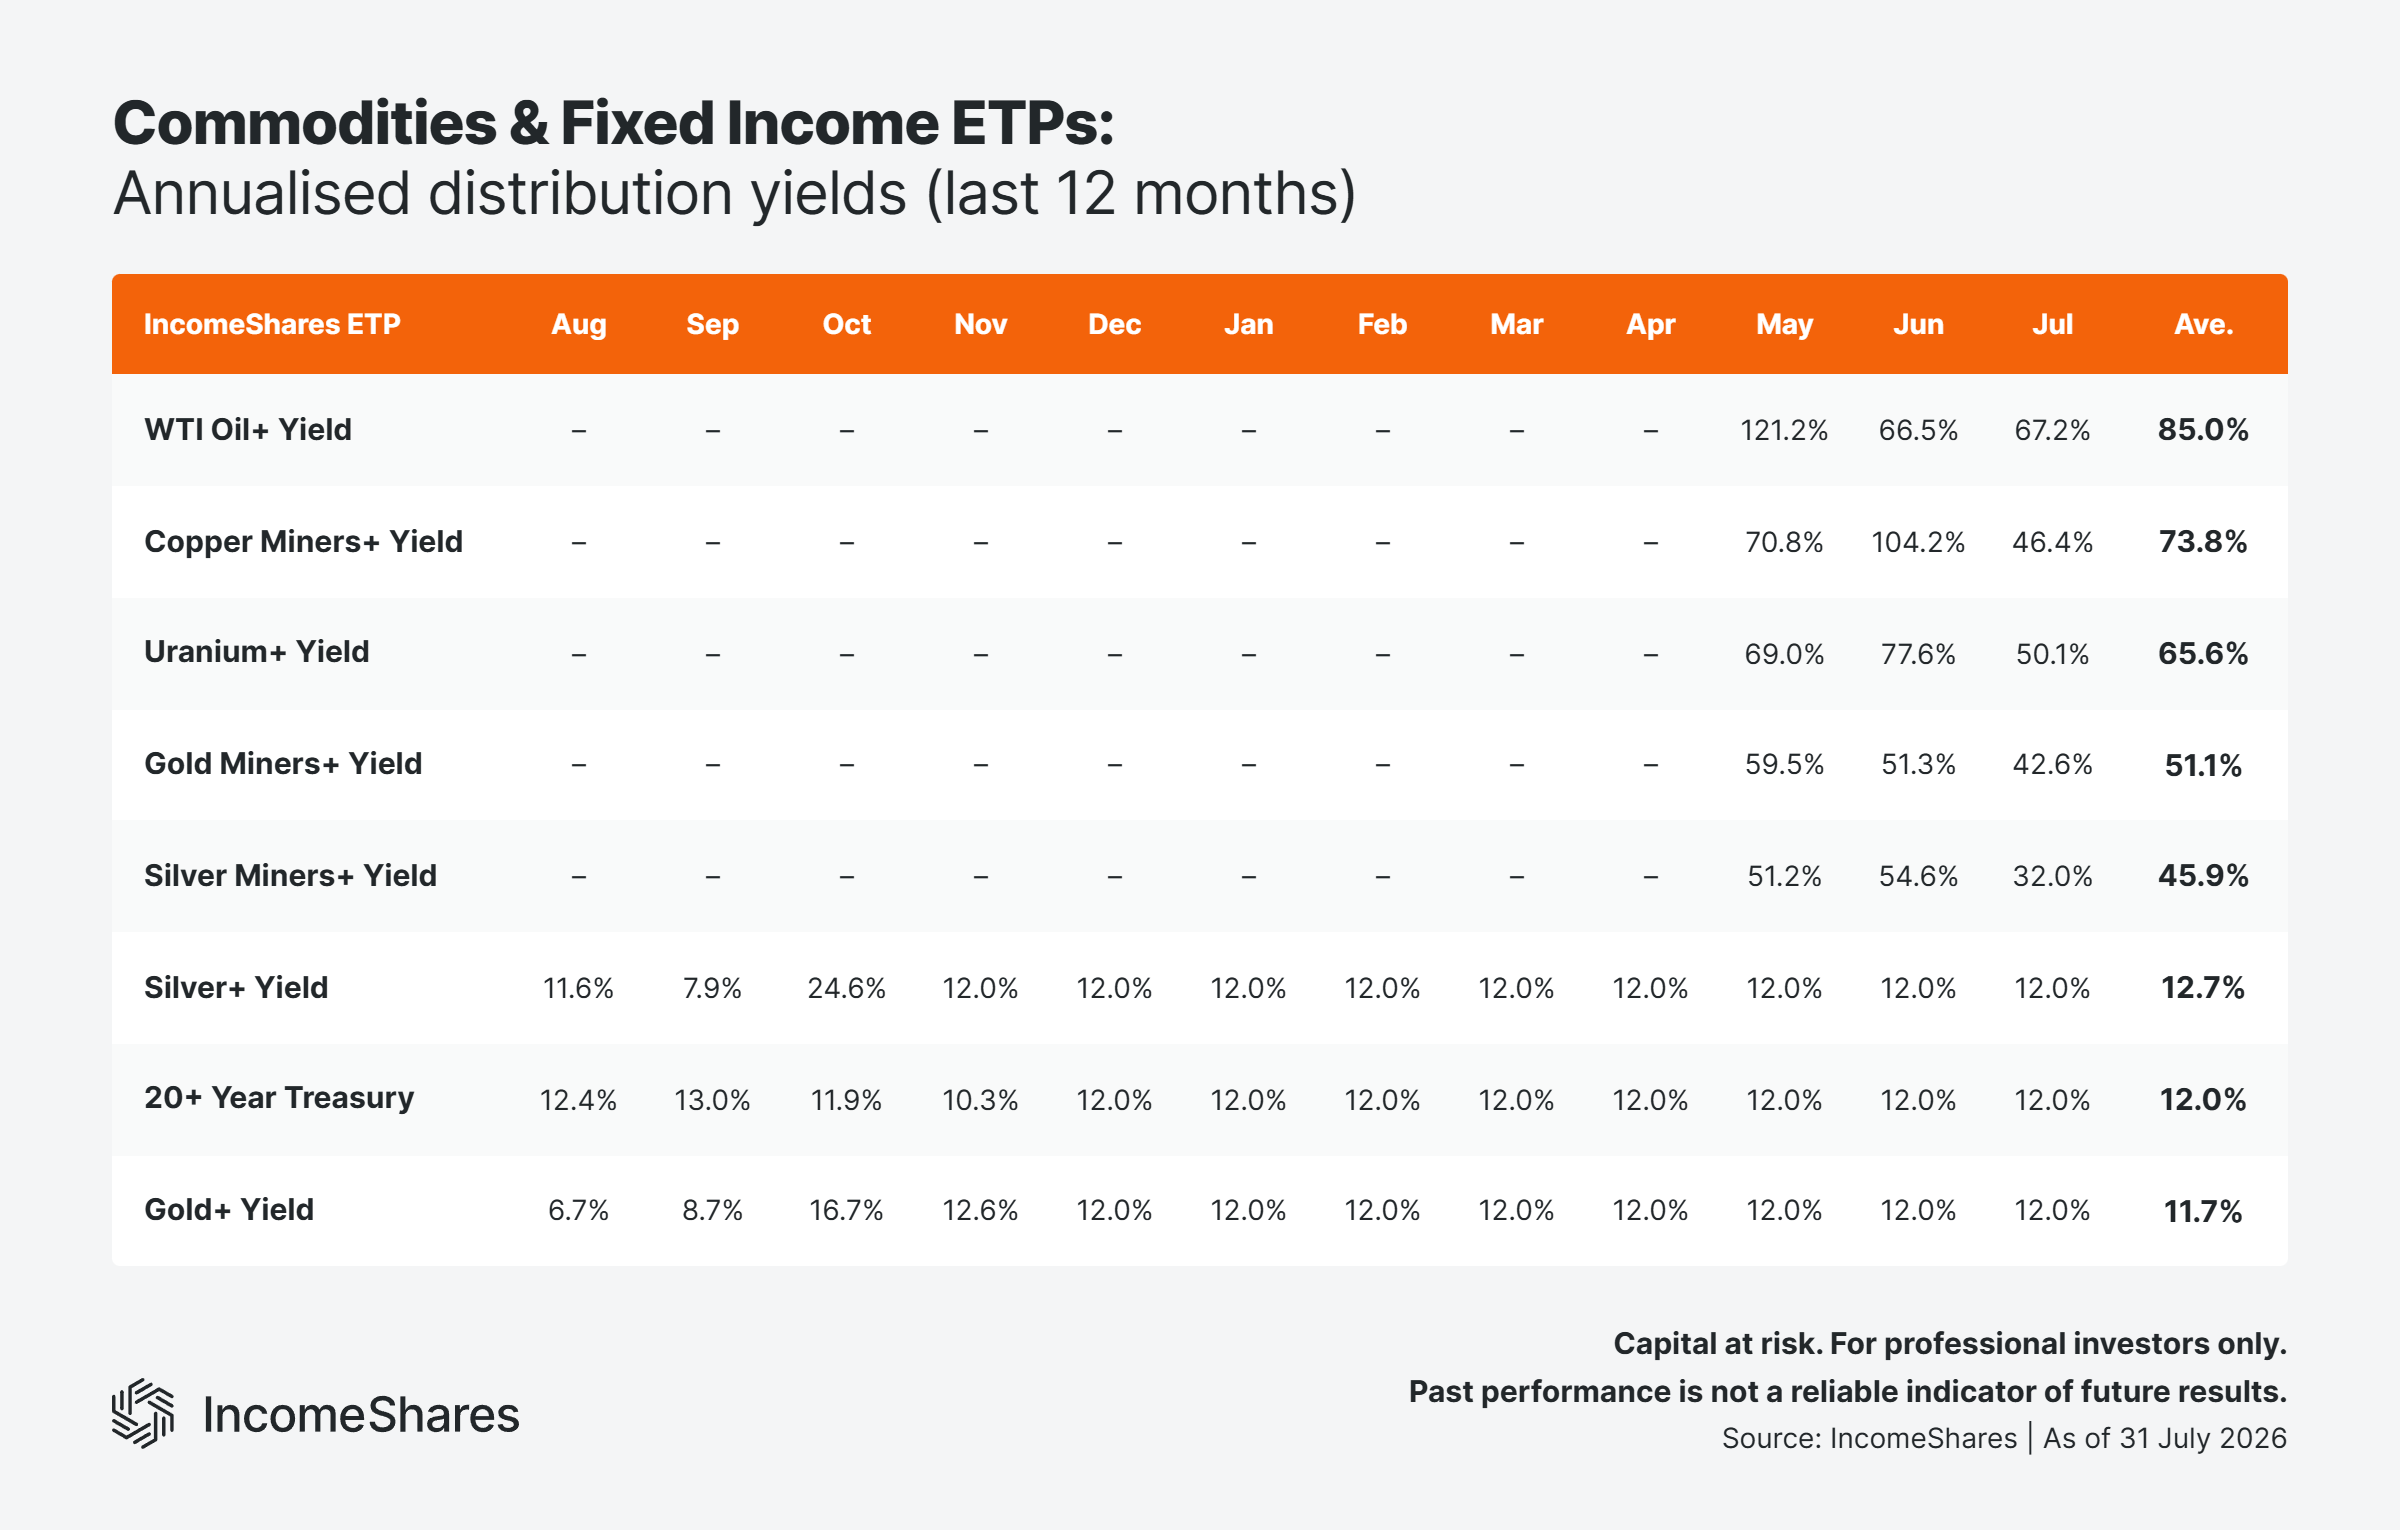
In commodities, Copper Miners+ Yield fell back from 104% to 46%. Riot rose from 70% to 125% among the digital asset names, while Coinbase paid 85% – up from 56%.
Gold+ Yield, Silver+ Yield, and 20+ Year Treasury all paid 12% annualised – that's 1% a month, unchanged. A rising yield percentage doesn't always mean a bigger payout, since the yield also depends on net asset value.
July annualised distribution yields ranked from highest to lowest:
Intel Options ETP: 149.3%
ARM Options ETP: 136.5%
Lam Research Options ETP: 129.4%
Riot Options ETP: 125.4%
Micron Options ETP: 121.7%
Marvell Technology Options ETP: 120.2%
Applied Materials Options ETP: 117.0%
AMD Options ETP: 109.5%
Memory (DRAM) Options ETP: 108.0%
IREN Options ETP: 101.5%
Circle Internet Options ETP: 100.0%
Galaxy Digital Options ETP: 98.0%
Semiconductors Leaders ETP: 95.6%
CoreWeave Options ETP: 94.4%
Coinbase Options ETP: 85.0%
Robinhood Options ETP: 84.7%
Super Micro Computer Options ETP: 80.1%
AI Leaders ETP: 78.9%
QUALCOMM Options ETP: 77.5%
META Options ETP: 77.0%
Blockchain Leaders ETP: 76.8%
Mara Options ETP: 73.2%
Strategy Options ETP: 71.9%
Oracle Options ETP: 71.4%
SpaceX Options ETP: 71.0%
Tesla Options ETP: 70.4%
Texas Instruments Options ETP: 69.6%
Bitmine Options ETP: 69.4%
Netflix Options ETP: 67.5%
WTI Oil+ Yield ETP: 67.2%
Taiwan Semiconductors Options ETP: 62.4%
Palantir Options ETP: 60.4%
ASML Options ETP: 59.6%
Amazon Options ETP: 58.5%
Nasdaq 100 Options ETP: 58.1%
Apple Options ETP: 56.9%
Magnificent 7 Options ETP: 56.4%
Analog Devices Options ETP: 54.4%
Uranium+ Yield ETP: 50.1%
Alphabet Options ETP: 49.0%
Copper Miners+ Yield ETP: 46.4%
NVIDIA Options ETP: 46.2%
UnitedHealth Options ETP: 45.9%
Broadcom Options ETP: 43.6%
Alibaba Options ETP: 42.7%
Gold Miners+ Yield ETP: 42.6%
75/10/15 Multi-Asset Growth ETP: 42.2%
Microsoft Options ETP: 41.8%
Silver Miners+ Yield ETP: 32.0%
S&P 500 Options ETP: 28.6%
Berkshire Hathaway Options ETP: 25.1%
60/30/10 Multi-Asset Balanced ETP: 22.3%
Eurostoxx 50 Options ETP: 12.2%
Silver+ Yield ETP: 12.0%
20+ Year Treasury Options ETP: 12.0%
Gold+ Yield ETP: 12.0%
The charts below show the annualised distribution yields for each group over the past 12 months.
Key takeaways
Cumulative fund flows crossed $250 million for the first time, reaching $252.4 million on net inflows of $15.2 million.
IncomeShares AUM rose from $189.1 million to $191.3 million in July. Total AUM has increased every month since inception.
Monthly turnover reached $53.7 million across exchanges. Intel, ARM, and Lam Research ETPs paid the highest distribution yields in July.
Your capital is at risk if you invest. You could lose all your investment. Please see the full risk warning here.
Related Products:

Strategy
Cash-Secured Put + Equity
Distribution Yield
27.18%

Strategy
Covered Call
Distribution Yield
12.81%

Strategy
Basket of Income-generating ETPs
Distribution Yield
36.76%

Strategy
Covered Call
Distribution Yield
12.82%

Strategy
Cash-Secured Put + Equity
Distribution Yield
136.97%

Strategy
LS SpaceX Options-Based Income Strategy
Distribution Yield
67.20%

Strategy
LS Memory Options-Based Income Strategy
Distribution Yield
74.74%