
Author
Jonathan Hobbs, CFA
Date
24 Oct 2025
Category
Market Insights
Tesla Stock Analysis: 5 Charts Post-Earnings
Your capital is at risk if you invest. You could lose all your investment. Please see the full risk warning here.
Tesla’s latest earnings results show how much the company has changed over the past five years – and its current state. Here are five charts that investors might consider when analyzing the stock, and what they mean now.
Tesla chart 1 – Revenue vs net income
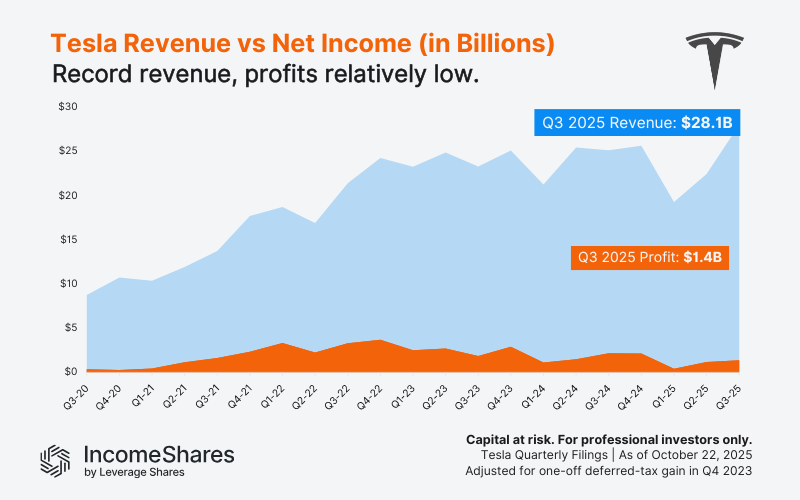
Tesla’s revenue has tripled over the past five years – from $9 billion in Q3 2020 to $28 billion last quarter. In the process, it shifted from a premium EV maker to a mass-market manufacturer.
But despite rising revenue, profit growth has been slow and volatile. Tesla now earns less on each dollar of sales than it did a few years ago. That’s common in maturing industries – more sales with lower profit conversion – once competition and pricing pressure kick in.
Chart 2 – Energy generation and storage revenue
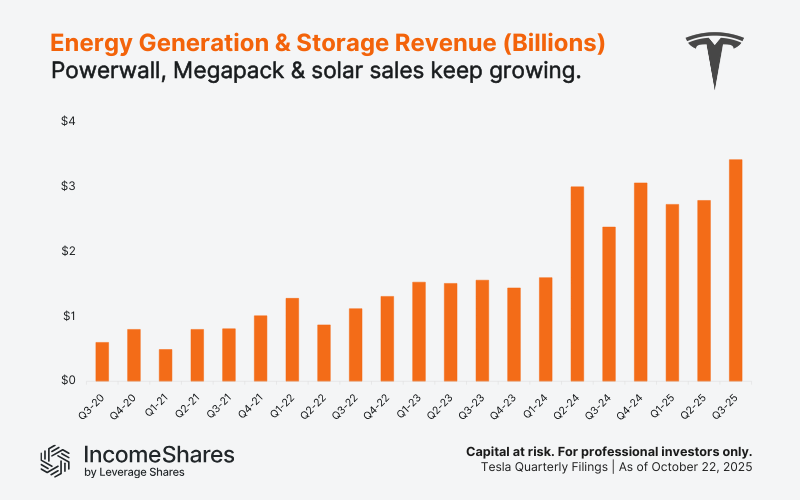
Powerwall, Megapack, and solar sales are one of Tesla’s fastest-growing segments. Energy generation and storage revenue has climbed from $0.6 billion to $3.4 billion a quarter. That’s about 12% of total revenue (that doesn't come from cars).
The Megapack has become the backbone of Tesla’s grid-scale storage sales. And Powerwall battery demand keeps rising for homes looking to store solar power. If this trend continues, energy could evolve from a side project into a meaningful contributor to Tesla’s long-term earnings.
Chart 3 – Free cash flow and liquidity growth
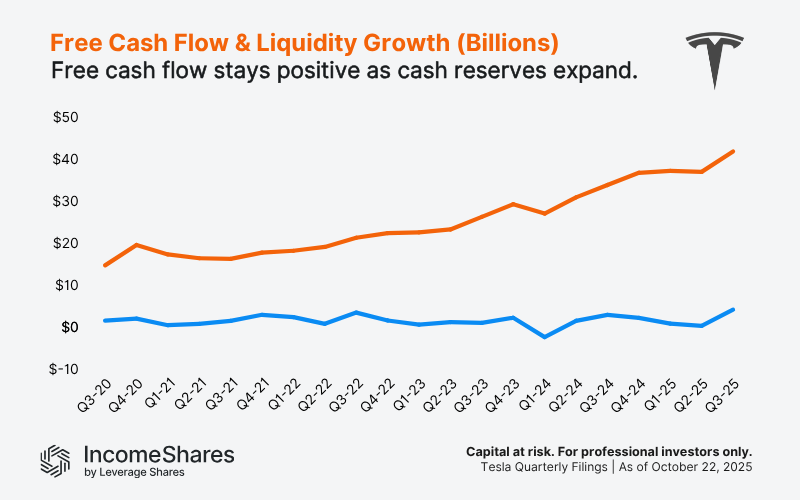
Tesla’s free cash flow hit a new quarterly record ($4B) for the third quarter of 2025. And it now has a reserve of over $40 billion in cash and investments. That gives it ample liquidity to fund new projects in AI, robotics, and batteries without needing to raise more money.
Chart 4 – Tesla Vehicle Deliveries
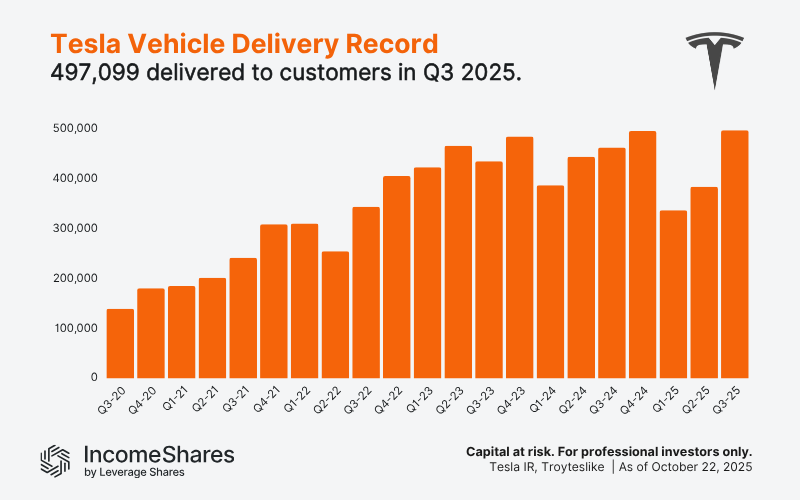
Tesla hit a new record for vehicle deliveries last quarter – 497,099 in total. That’s up from 384,122 in Q2 2025, and above the previous high of 495,570 in Q4 last year. Model 3/Y made up over 480,000 of last quarter’s deliveries.
Chart 5 – Tesla’s value vs other Mag 7 stocks
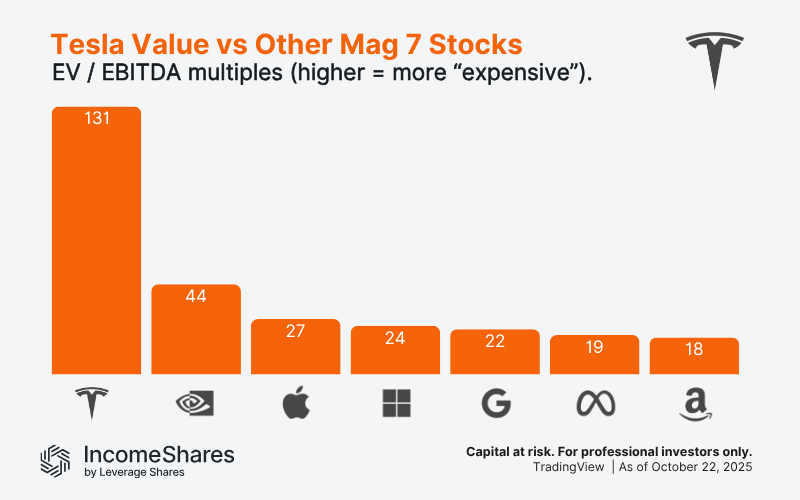
Tesla’s valuation is currently a lot higher than the rest of the Magnificent 7, according to the EV / EBITDA multiple. The ratio measures how expensive each company is compared with the cash it earns from operations.
Enterprise value adds a company’s debt to its market cap and subtracts its cash. It shows what the whole business would cost if you bought it outright.
EBITDA is earnings before interest, tax, depreciation, and amortisation — a rough measure of operating profit.
Tesla’s EV / EBITDA multiple is now around 130 – about triple Nvidia’s number at 44. Higher means “more expensive”, according to the ratio. Given Tesla’s lower profit margins, investors could be betting on Tesla’s ability to innovate in the future. In many ways, Tesla is a bet on Elon Musk himself – so there can be an “Elon Musk premium”.
Bonus chart – Tesla technical analysis
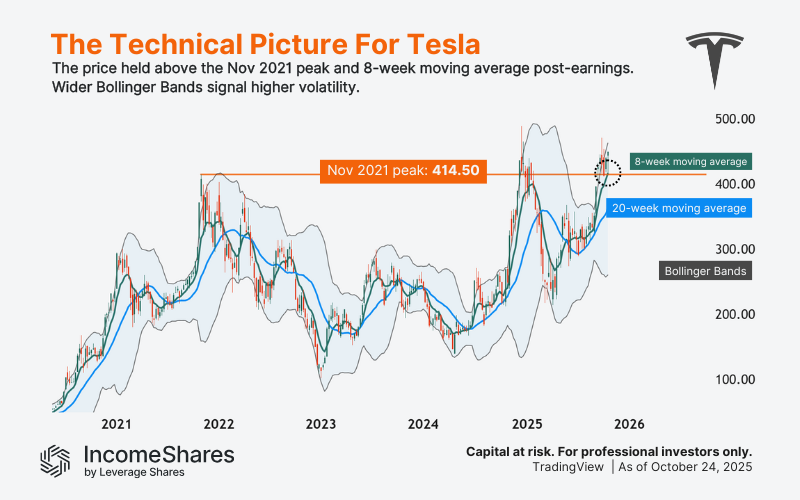
From a technical point of view, Tesla is holding above its November 2021 peak of $414.50 (orange line). Interestingly, the stock price “bounced” at this level yesterday after its initial post-earnings announcement drop. The bounce also happened to intersect with the Tesla’s 8-week moving average (green). So long as Tesla holds above it, the uptrend remains strong – a weekly close below it could signal caution.
Tesla’s weekly Bollinger Bands are fairly wide apart, meaning volatility is relatively high (while the price has trended higher). If they start contracting, it could signal more price consolidation ahead (as volatility cools off).
The IncomeShares Tesla Options ETP aims to track Tesla’s general price direction (after fees), and aims to pay monthly income from selling put options on the stock. The ETP trades in USD and GBP in the UK, and Euros in Europe.
Key Takeaways
Tesla’s revenue keeps growing, but profits haven’t kept pace.
Its energy and storage business is becoming a serious contributor.
With over $40 billion in cash, Tesla can fund future projects without raising new money.
Your capital is at risk if you invest. You could lose all your investment. Please see the full risk warning here.
Related Products:

Strategy
Cash-Secured Put + Equity
Distribution Yield
75.51%

Strategy
Basket of Income-generating ETPs
Distribution Yield
39.99%