
Author
Jonathan Hobbs, CFA
Date
05 Nov 2025
Category
Market Insights
IncomeShares Monthly Investor Update – October 2025
Your capital is at risk if you invest. You could lose all your investment. Please see the full risk warning here.
IncomeShares hit new highs across every major metric in October. Assets under management climbed to $87.5 million, cumulative fund flows reached $91.6 million, and total trading turnover jumped to a record $42.2 million. Our Coinbase ETP had the highest annualised distribution yield again in October at 113.28%.
This update covers fund flows, turnover, assets under management, and distribution yields for October 2025.
Cumulative fund flows above $90 million
Cumulative fund flows track the total amount of money investors put into or take out of IncomeShares ETPs. Positive flows mean more money coming in than going out – a sign of growing demand for the products.
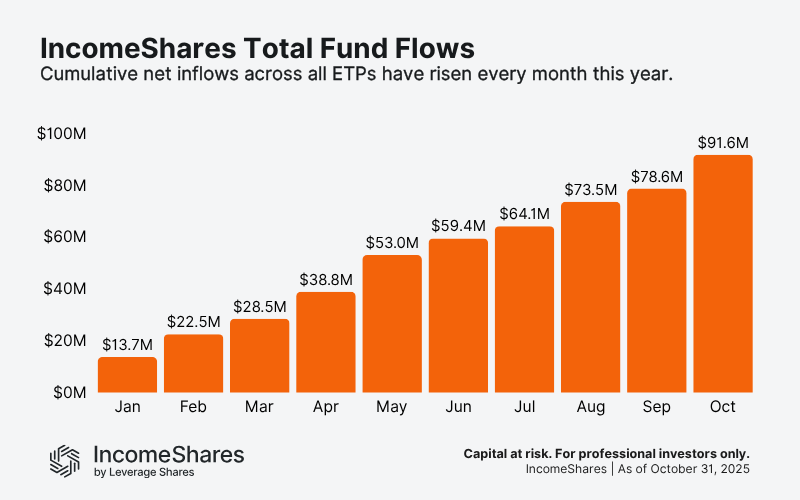
October was the strongest month of new inflows since May. Cumulative flows rose from $78.6 million in September to $91.6 million in October – an increase of $13.0 million for the month. Our Magnificent 7 and Gold+ Yield ETPs saw the strongest inflows of the group, with around $1.6 million each.
Coinbase was next in line with roughly $1.2 million of net new investment, with Silver+ Yield taking in about $1.1 million. These numbers suggest that investors are using IncomeShares products more actively across a broad range of underlying asset types: tech leaders, metals, and crypto companies.
Trading turnover is up 60% across exchanges
Turnover is the total dollar value of IncomeShares ETPs bought and sold on exchanges. Higher turnover means more activity and liquidity for investors.
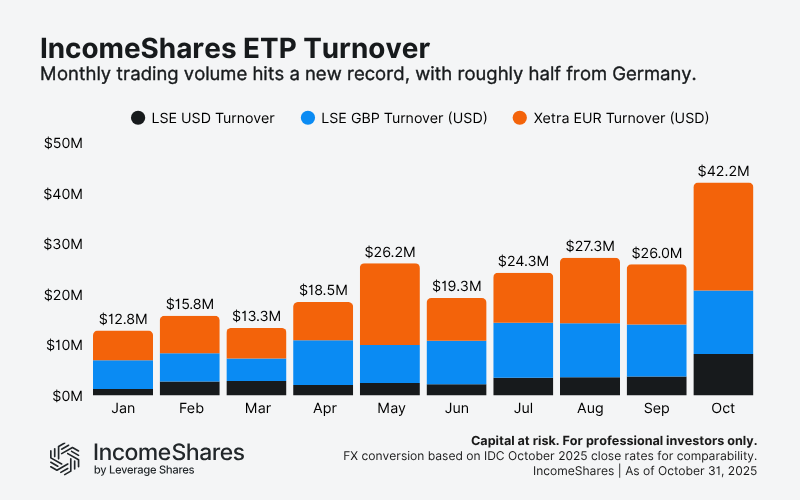
Trading turnover climbed roughly 62% in October – the biggest monthly percent increase this year – to reach $42.2 million. Around half came from Xetra (circa $21.4 million when converted from euros). London listings made up the balance, with both USD and GBP listings seeing new turnover records. Our products also launched on Euronext Amsterdam on 15 October. These have not yet been included in the figures due to not having a full trading month yet.
Note: Figures use IDC FX rates as of the October month-end to convert GBP and EUR into USD for comparison.
Assets under management (AUM) increase
AUM is the total value of assets held across all IncomeShares ETPs. It grows when new investors buy in, or when the underlying assets rise in value.
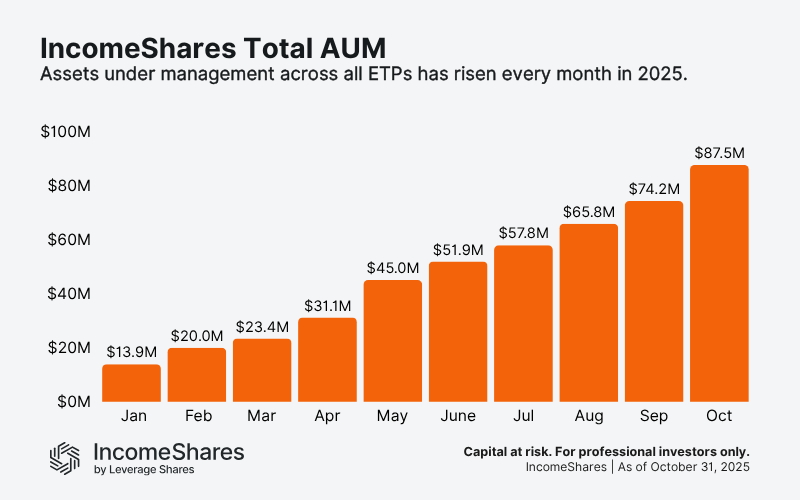
AUM rose approximately 18% ($13.3 million) in October to reach $87.5 million – the biggest percentage and dollar value increase since May. Growth has now been consistent for nine months in a row, supported by stronger inflows.
Distribution yields
Distribution yields represent the annualised income paid to investors as a percentage of an ETP’s net asset value, based on the latest month’s yield. IncomeShares ETPs aim to generate this income from selling options. Yields change each month depending on strategy performance and market volatility.
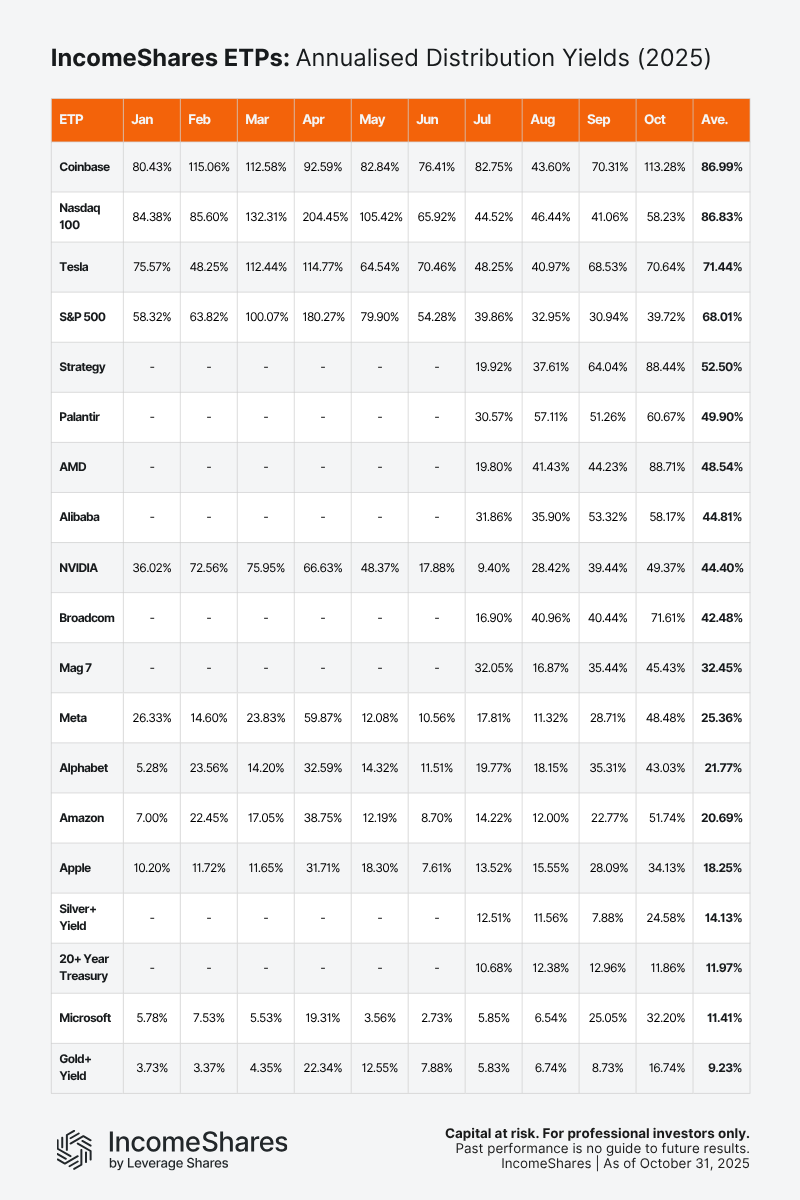
October annualised distribution yields ranked from highest to lowest:
Coinbase Options ETP (COIY): 113.28%
AMD Options ETP (AMDY): 88.71%
MicroStrategy Options ETP (MSTY): 88.44%
Broadcom Options ETP (AVGY): 71.61%
Tesla Options ETP (TSLI): 70.64%
Palantir Options ETP (PLTY): 60.67%
Nasdaq 100 Options ETP (QQQY): 58.23%
Alibaba Options ETP (BABY): 58.17%
Amazon Options ETP (AMZI): 51.74%
NVIDIA Options ETP (NVDI): 49.37%
Meta Options ETP (METY): 48.48%
Magnificent 7 Options ETP (MAGO): 45.43%
Alphabet Options ETP (GOOI): 43.03%
S&P 500 Options ETP (SPYY): 39.72%
Apple Options ETP (AAPY): 34.13%
Microsoft Options ETP (MSFY): 32.20%
Silver+ Yield ETP (SLVY): 24.58%
Gold+ Yield ETP (GLDI): 16.74%
20+ Year Treasury Options ETP (TLTY): 11.86%
Coinbase led the product range with yields above 100%, while AMD and MicroStrategy both delivered close to 90%. Equity yields stayed high, helped by elevated volatility through earnings season. At the lower end, gold and Treasuries continued to offer steadier, lower-volatility income.
The table below shows the annualised distribution yields for all 19 IncomeShares ETPs since the start of the year. Coinbase has now overtaken our Nasdaq 100 product, with an average annualised yield of 86.99% for the year.
Key takeaways
Fund flows: up $13.0 m in October to reach $91.6 m total.
Turnover: Record $42.2 m, with roughly half from Xetra.
AUM: $87.5 m – ninth consecutive month of growth.
Yields: Coinbase led the range with 113.28%, annualised. AMD and MicroStrategy followed close behind.
Your capital is at risk if you invest. You could lose all your investment. Please see the full risk warning here.
Related Products:

Strategy
Cash-Secured Put + Equity
Distribution Yield
133.67%

Strategy
Covered Call
Distribution Yield
13.57%

Strategy
Basket of Income-generating ETPs
Distribution Yield
53.65%

Strategy
Cash-Secured Put + Equity
Distribution Yield
139.31%