
Author
Jonathan Hobbs, CFA
Date
05 Aug 2025
Category
Market Insights
IncomeShares Monthly Investor Update – August 2025
Your capital is at risk if you invest. You could lose all your investment. Please see the full risk warning here.
IncomeShares passed three milestones in August. Assets under management climbed to almost $66 million, cumulative fund flows topped $72 million, and turnover across London and Xetra listings reached over $27 million. Palantir paid the highest annualised distribution yield at 57.11%. The sections below break the numbers down in more detail.
Cumulative fund flows
Fund flows track how much money investors put into or take out of IncomeShares ETPs. Positive flows mean more money coming in than going out – a sign of demand for the products.
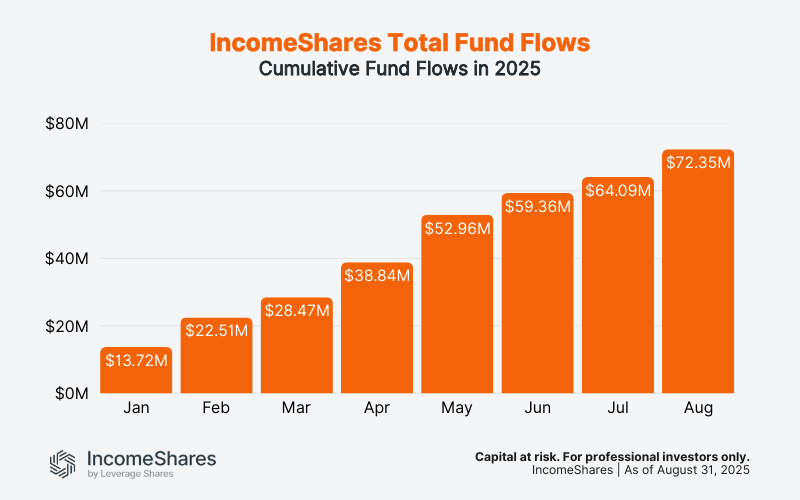
Flows have risen every month this year. In January, they stood at $13.7 million. By the end of August, they reached $72.4 million. That’s over $8 million of new money added in August alone – the biggest increase since May.
Trading turnover
Turnover is the total dollar value of IncomeShares ETPs bought and sold on the exchanges. Higher turnover means more activity and liquidity for investors.
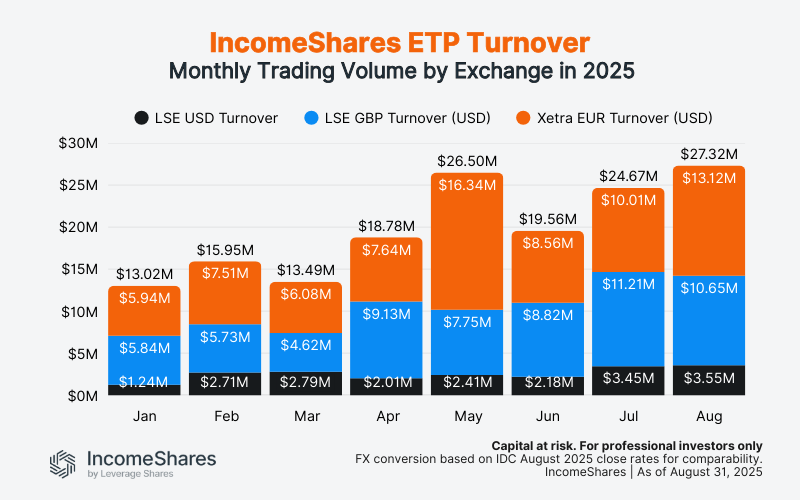
Turnover reached $27.3 million in August – the highest on record and more than double January’s $13.0 million. London listings (USD and GBP combined) made up $14.2 million, with Xetra listings close behind at $13.1 million. Both exchanges have seen steady increases through 2025, showing rising interest in income options strategies across the board.
Note: Figures use IDC FX rates as of the August month-end to convert GBP and EUR into USD. We apply the same August rates to all prior months to compare turnover on a like-for-like basis.
Assets under management (AUM)
AUM is the total value of assets held across all IncomeShares ETPs. It grows when new investors buy in, or when the underlying assets rise in value.
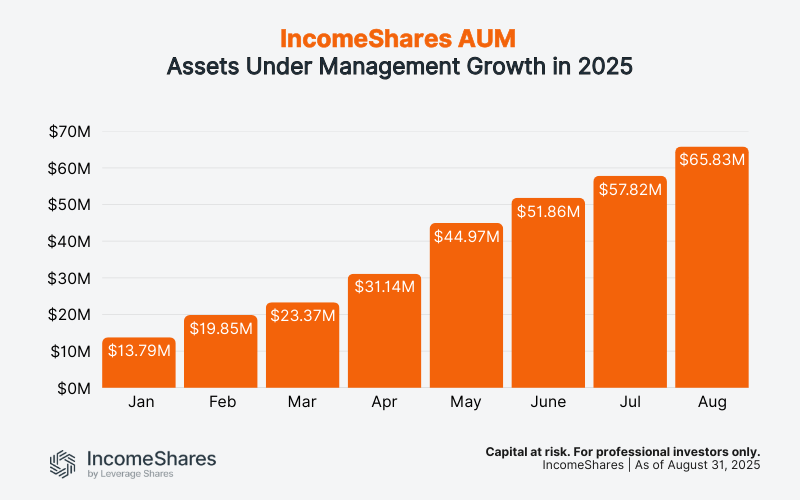
AUM grew from $13.8 million in January to $65.8 million at the end of August. It was also $8 million more than in July. Steady inflows and consistent income distributions are helping the product range build scale.
Distribution yields
Distribution yields represent the annualised income paid to investors as a percentage of the current NAV (net asset value), based on the latest month’s yield. IncomeShares ETPs aim to generate this income from selling options. Yields change each month depending on strategy performance and market volatility.
Annualised August yields (ranked highest to lowest):
Palantir Options ETP (PLTY): 57.11%
Nasdaq 100 Options ETP (QQQY): 46.44%
Coinbase Options ETP (COIY): 43.60%
AMD Options ETP (AMDY): 41.43%
Tesla Options ETP (TSLI): 40.97%
Broadcom Options ETP (AVGY): 40.96%
MicroStrategy Options ETP (MSTY): 37.61%
Alibaba Options ETP (BABY): 35.90%
S&P 500 Options ETP (SPYY): 32.95%
NVIDIA Options ETP (NVDI): 28.42%
Alphabet Options ETP (GOOI): 18.15%
Magnificent 7 Options ETP (MAGO): 16.87%
Apple Options ETP (AAPPY): 15.55%
20+ Year Treasury Options ETP (TLTY): 12.38%
Amazon Options ETP (AMZI): 12.00%
Silver+ Yield Options ETP (SLVY): 11.56%
Meta Options ETP (METY): 11.32%
Gold+ Yield Options ETP (GLDI): 6.74%
Microsoft Options ETP (MSFY): 6.54%
Our Palantir ETP topped the list with an annualised yield of 57.11% for August, up from 30.57% in July. The stock was volatile in August, trading between $142 and $190. That wider range increased option premiums, which boosted the ETP’s yield. The ETP sells put options on Palantir stock and holds shares – the strategy used for all our single stock ETPs and the Magnificent 7 product.
The Nasdaq 100 ETP paid an annualised yield of 46.44% in August, up slightly from 44.52% in July. At the other end, Gold+ and Microsoft stayed below 7%, reflecting relatively calmer conditions in their underlying assets.
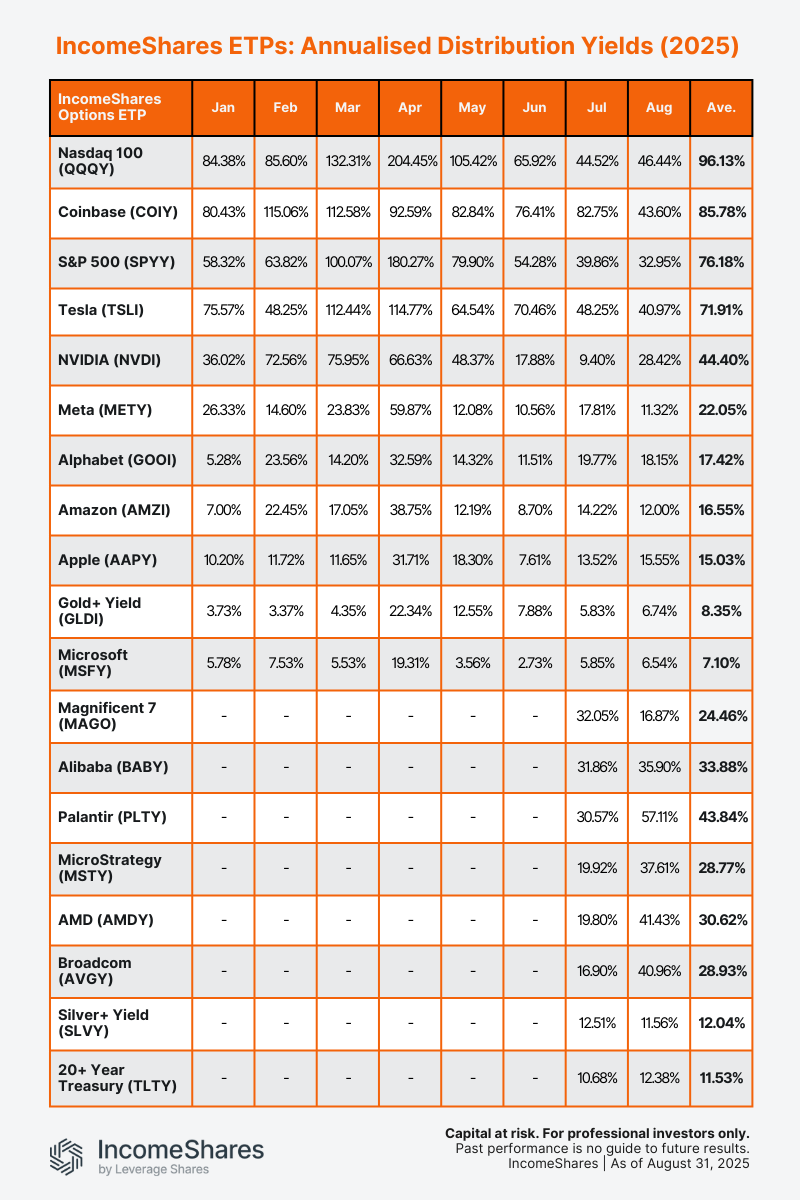
The table below shows the annalised distribution yields for all IncomeShares ETPs so far this year. Note that the bottom eight ETPs launched in late June, so they only have yields for July and August.
Key takeaways
Fund flows climbed to $72.4 million, with August adding more than $8 million.
Turnover hit a record $27.3 million, split almost evenly between London and Xetra.
Palantir topped the yield table at 57%, with Nasdaq 100 and Coinbase also paying above 40%
Your capital is at risk if you invest. You could lose all your investment. Please see the full risk warning here.
Related Products:

Strategy
Cash-Secured Put + Equity
Distribution Yield
50.34%

Strategy
Cash-Secured Put + Equity
Distribution Yield
54.31%

Strategy
Cash-Secured Put + Equity
Distribution Yield
72.13%

Strategy
Covered Call
Distribution Yield
12.33%

Strategy
Covered Call
Distribution Yield
12.71%

Strategy
Cash-Secured Put + Equity
Distribution Yield
67.30%

Strategy
Cash-Secured Put + Equity
Distribution Yield
94.05%