
Author
Jonathan Hobbs, CFA
Date
16 Jan 2026
Category
Market Insights
IncomeShares ETP Performance vs Underlying Assets in 2025
Your capital is at risk if you invest. You could lose all your investment. Please see the full risk warning here.
This article looks at how IncomeShares’ options ETPs performed in 2025 compared with their underlying assets. The comparison focuses on total returns, Sharpe ratios, and drawdowns across our 19 exchange-traded products.
How IncomeShares ETPs work (high level)
IncomeShares ETPs use a two-part strategy:
First, they hold an underlying asset via an ETF or single stock. This gives the ETP some exposure to the price moves of that asset.
Second, they sell options on their respective underlying asset. This can generate option premiums, which may be paid out to investors as income.
Overall, this approach could mean capped upside in strong rallies, with regular income that may help smooth returns.
IncomeShares performance vs underlying assets in 2025
The table below compares each IncomeShares ETP with its underlying asset using three measures.
Total return: the full return an investor would have earned over the period, assuming they reinvest all income back into the ETP.
Annualised Sharpe ratio: return relative to risk. A higher Sharpe ratio means the investor earned more return per unit of risk (volatility) taken.
Maximum drawdown: the biggest peak-to-trough drop over the period. Essentially, the worst-case loss if an investor bought at the worst possible time – and then later sold at the worst possible time over the period.
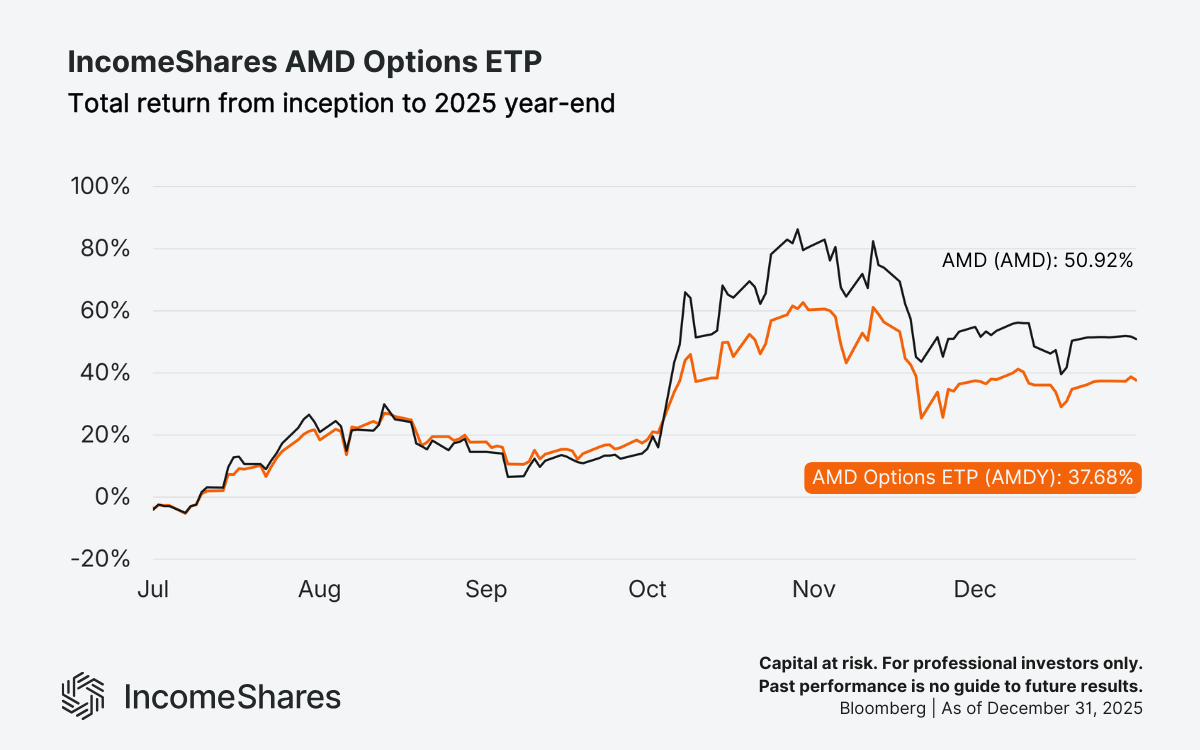
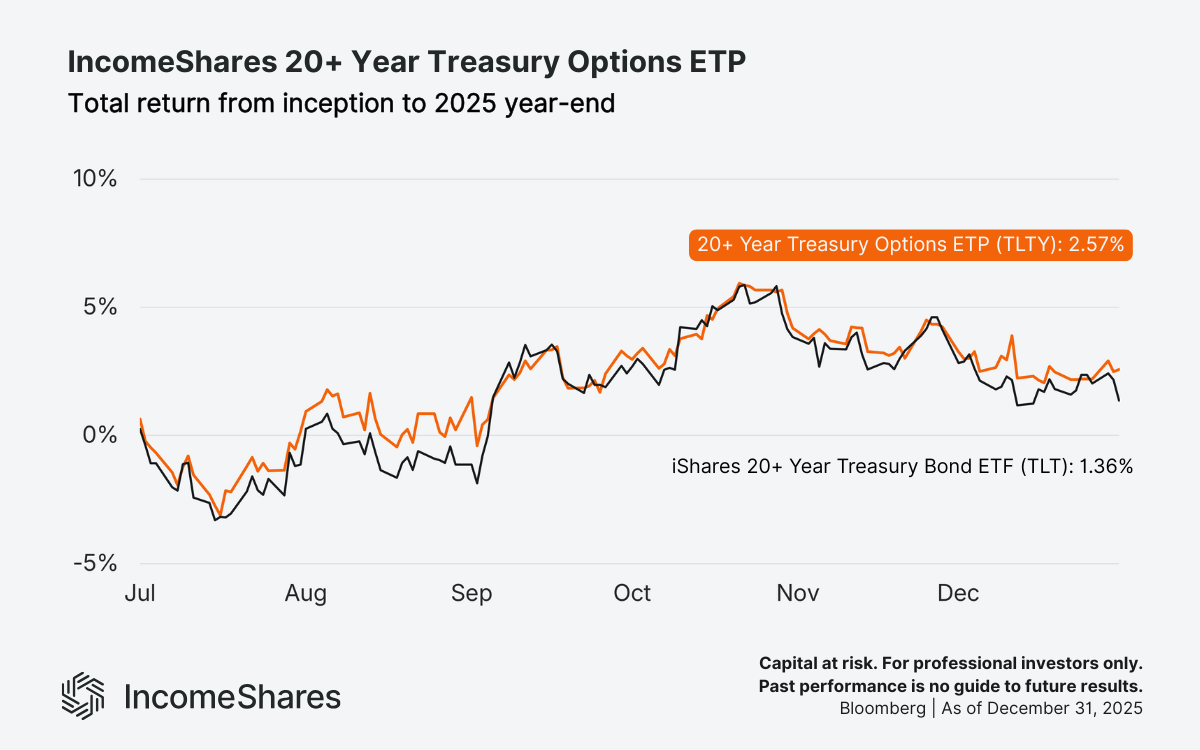
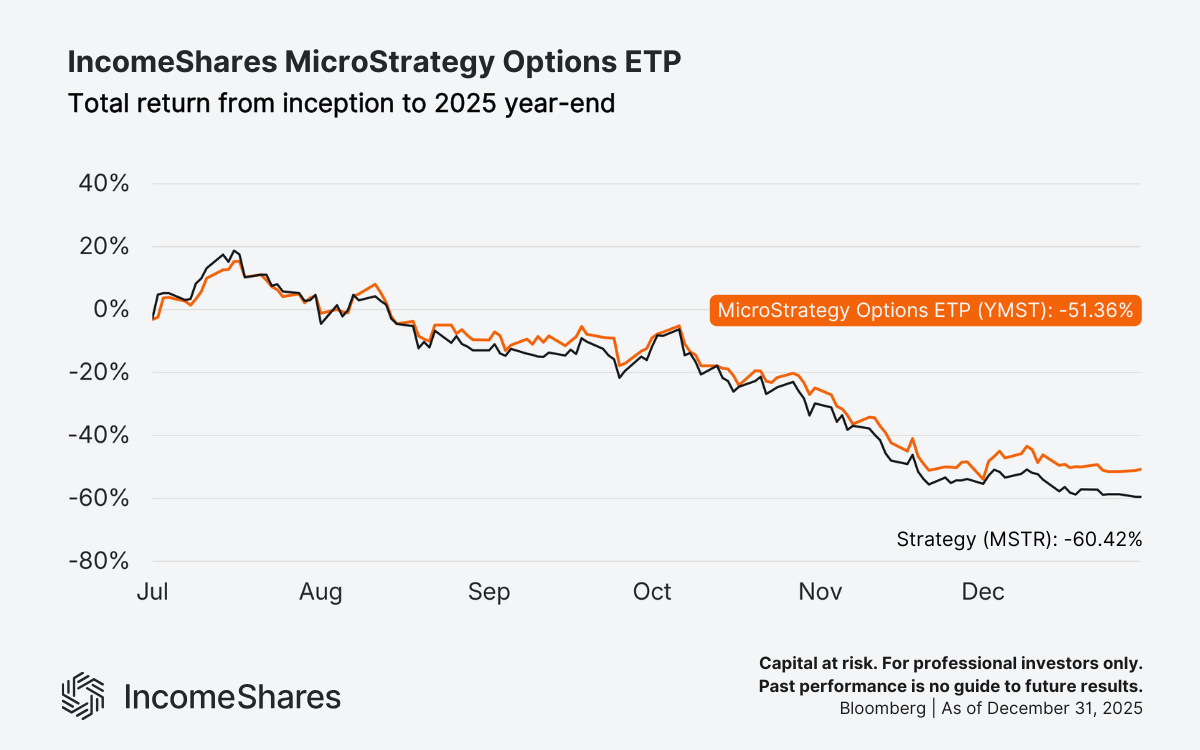
Note: several ETPs launched on 27 June 2025, so they don’t have a full 12 months of performance data. These include AMD, Broadcom, Palantir, Magnificent Seven, Alibaba, MicroStrategy, and Silver+ Yield, and the 20+ Year Treasury ETP.
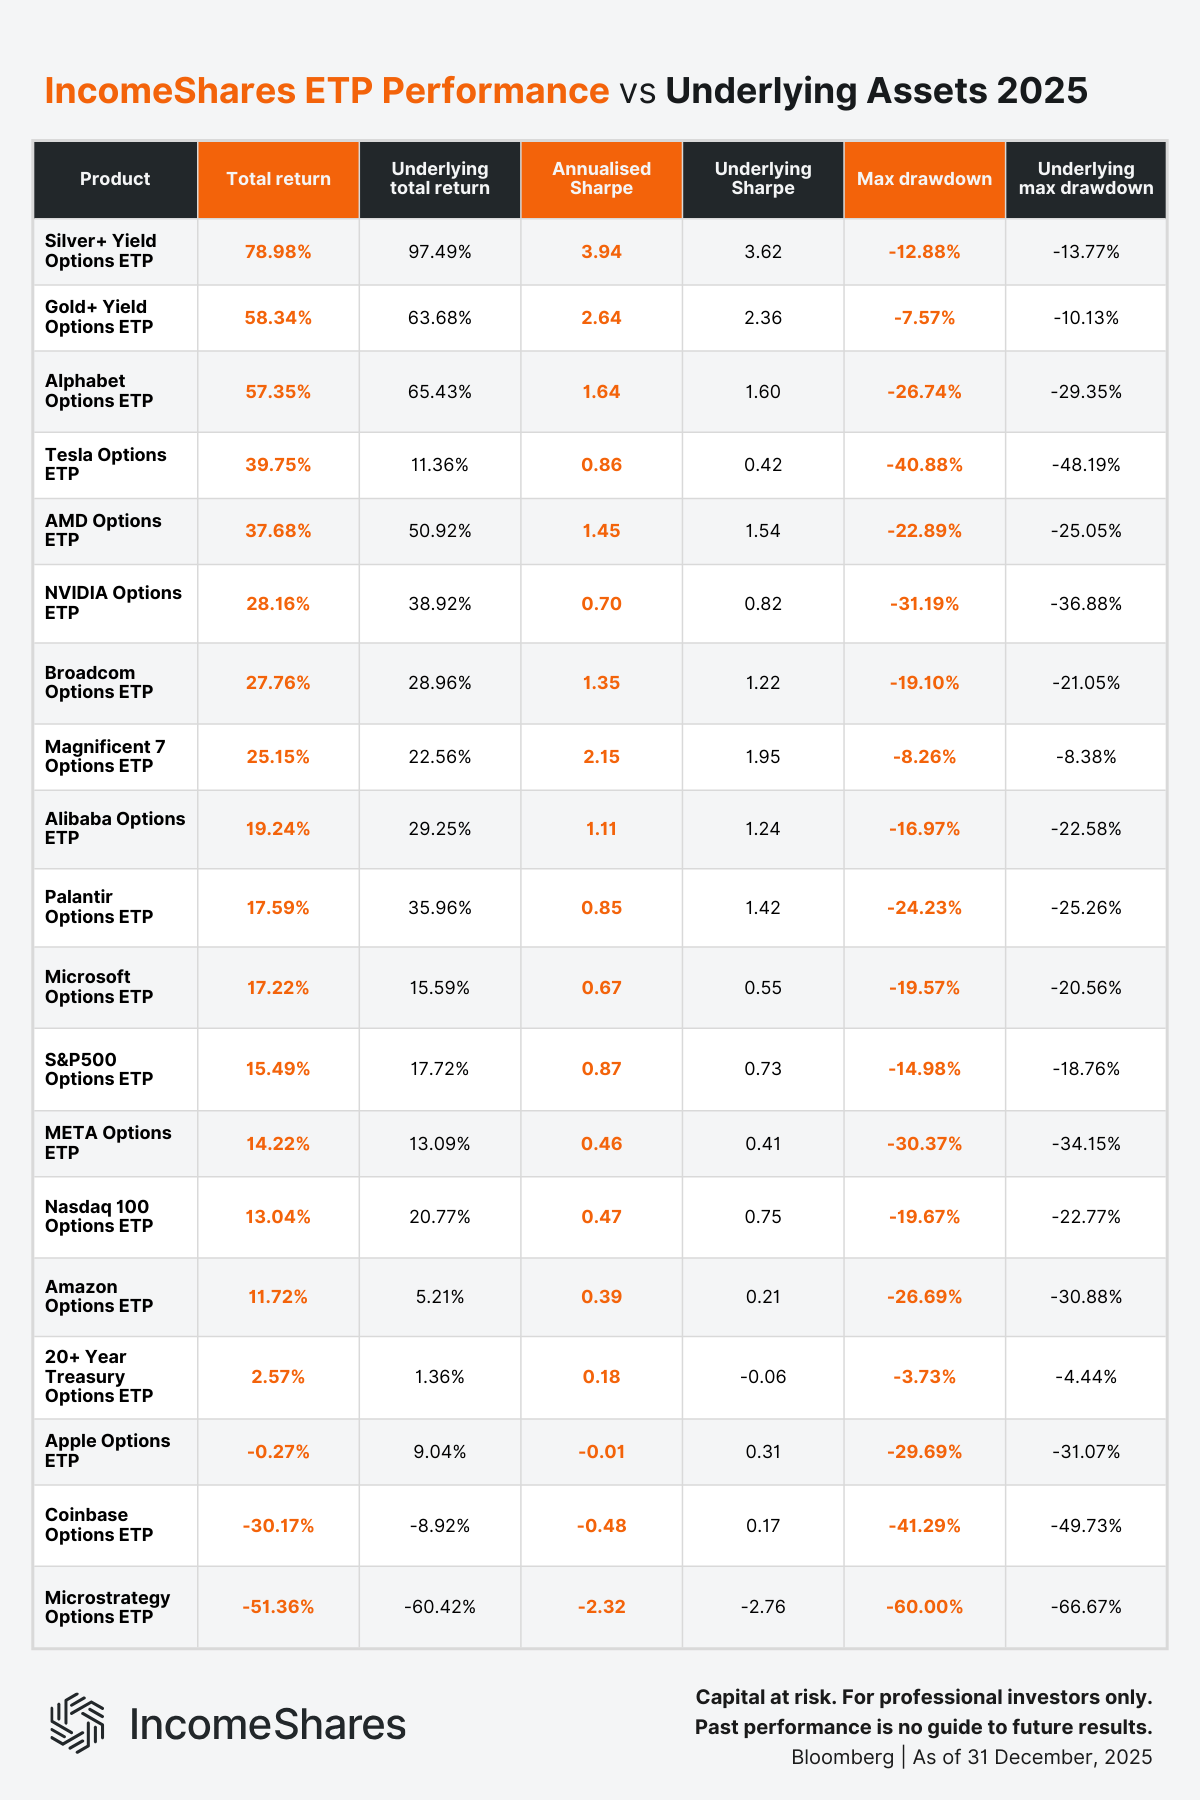
Total return figures include reinvested distributions. Sharpe ratios are calculated using the 3-month U.S. Treasury yield (US03MY) of 3.59% as of 31 December 2025. All figures are based on USD returns.
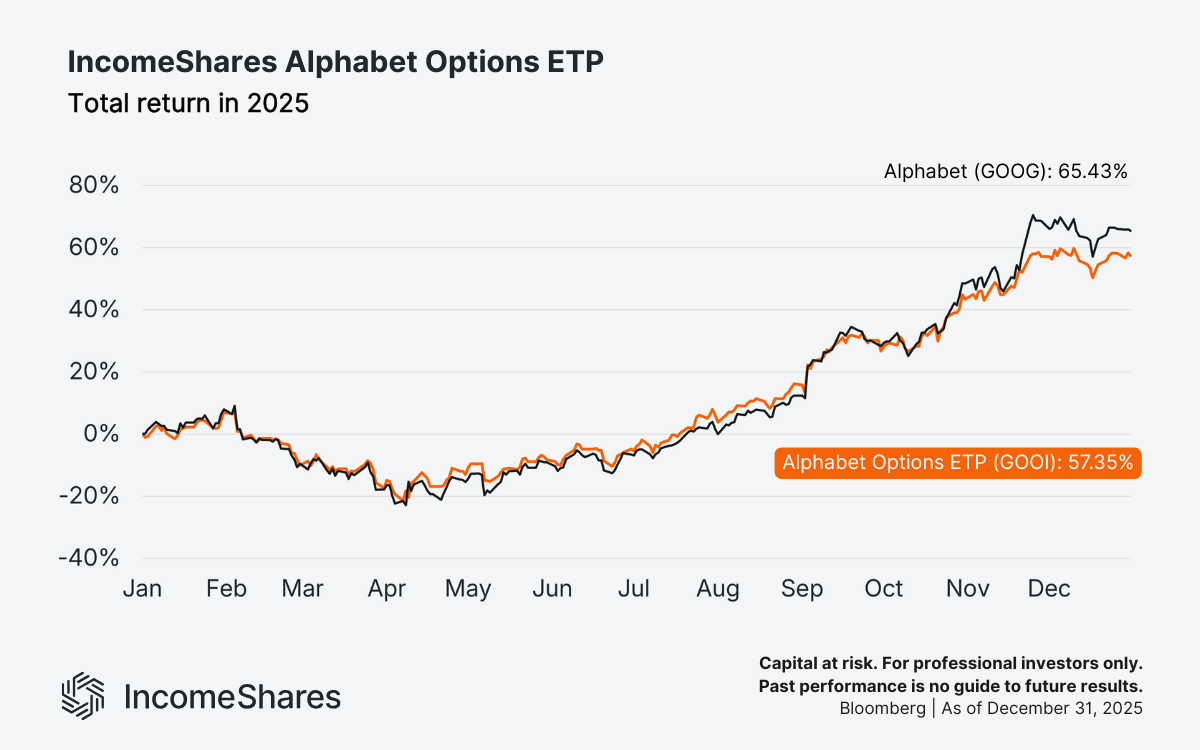
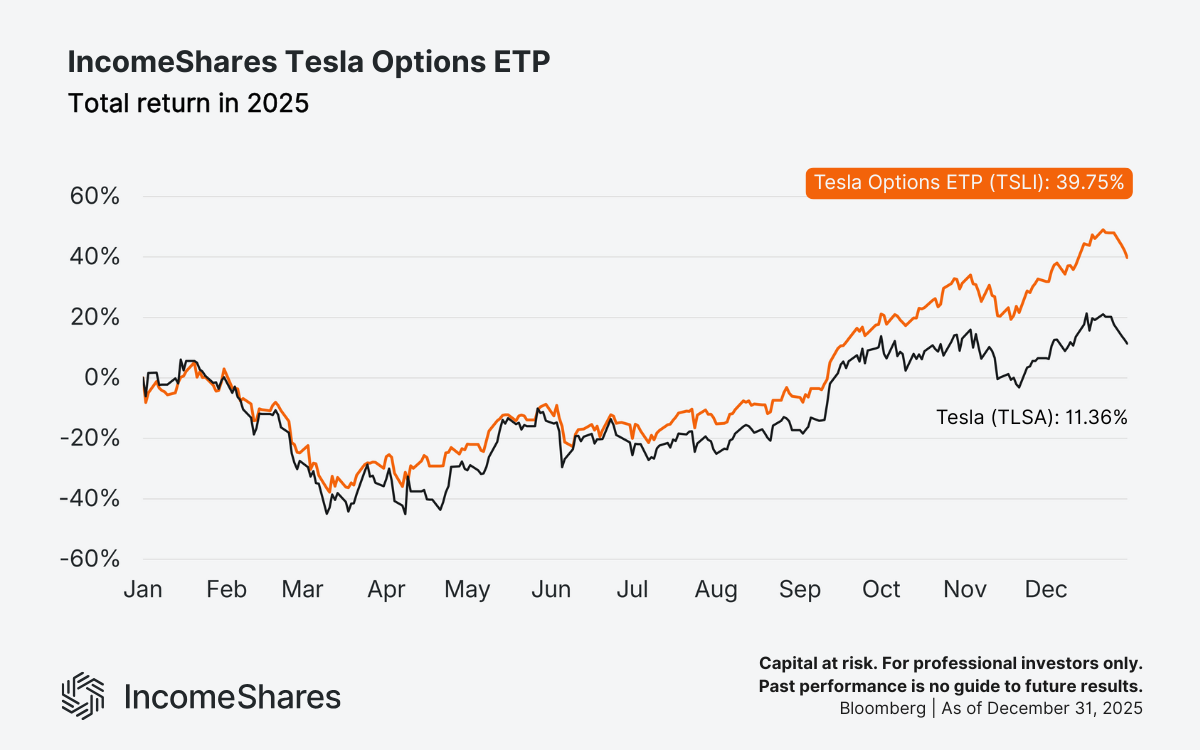
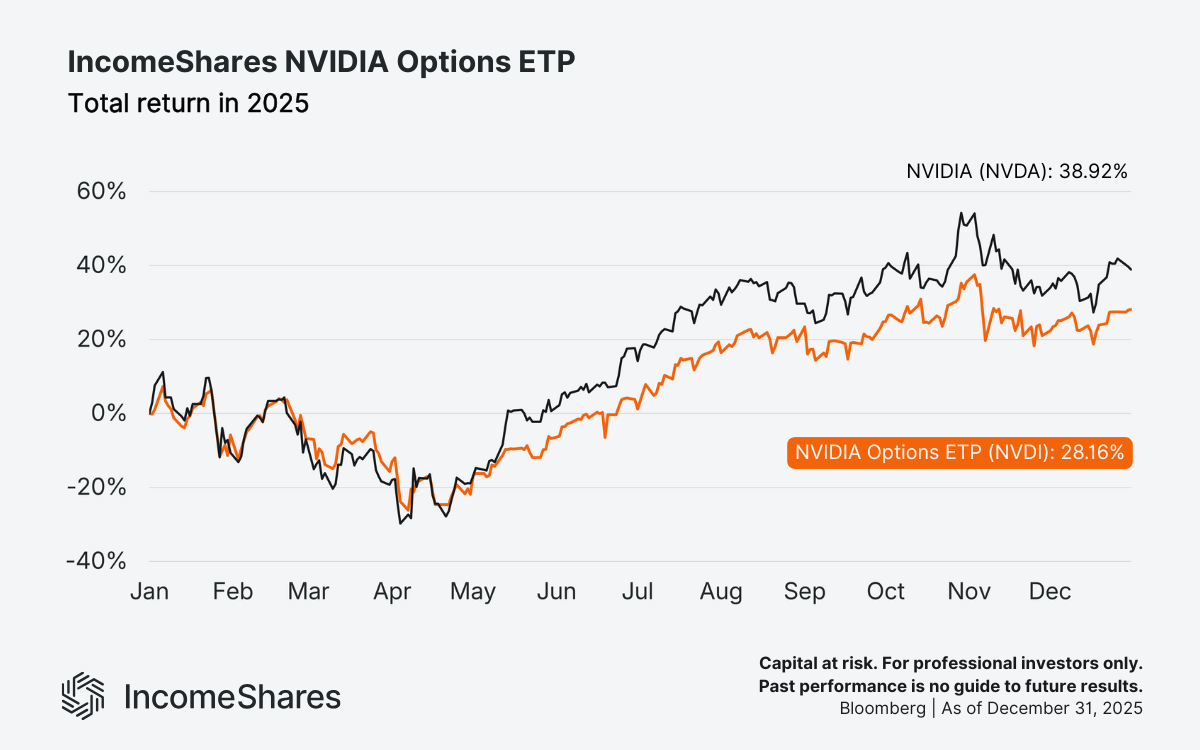
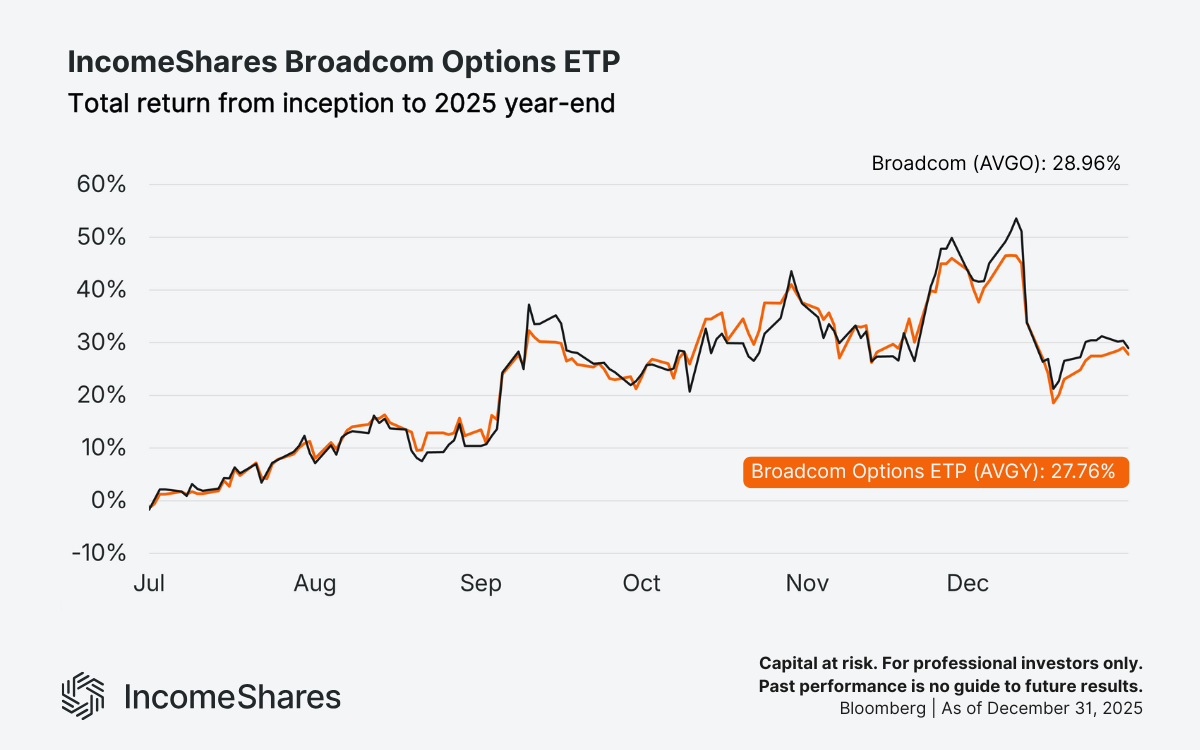
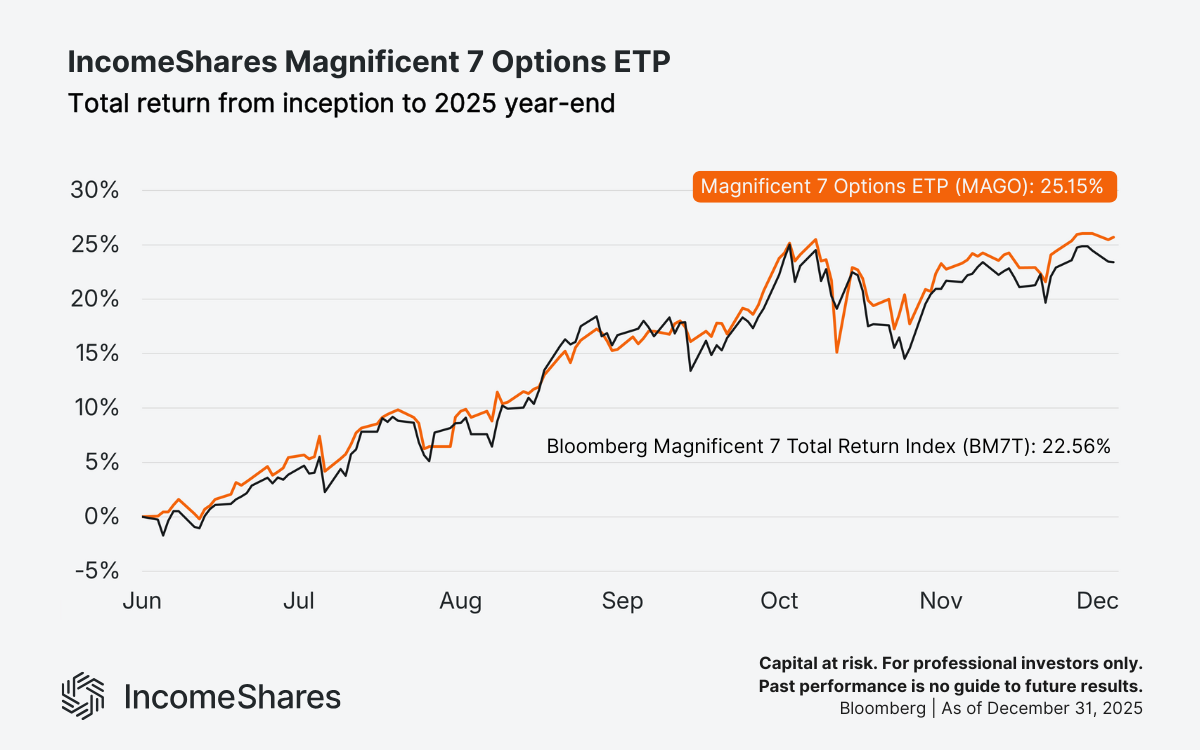
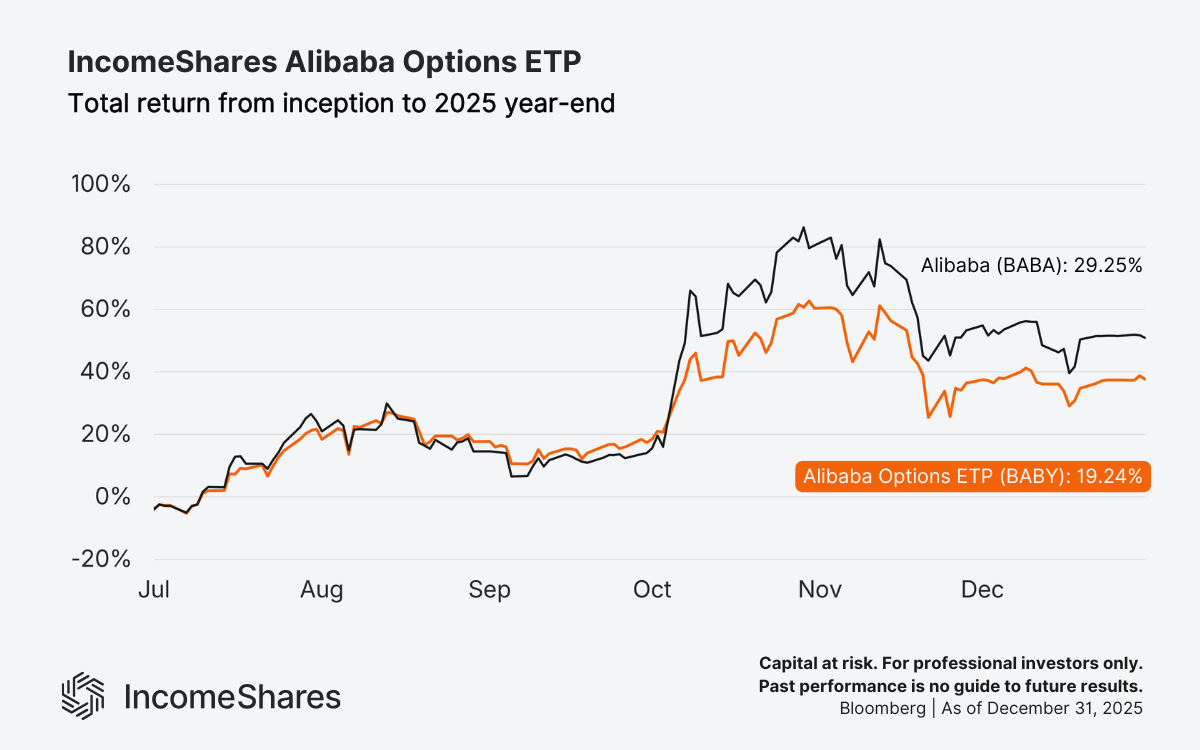
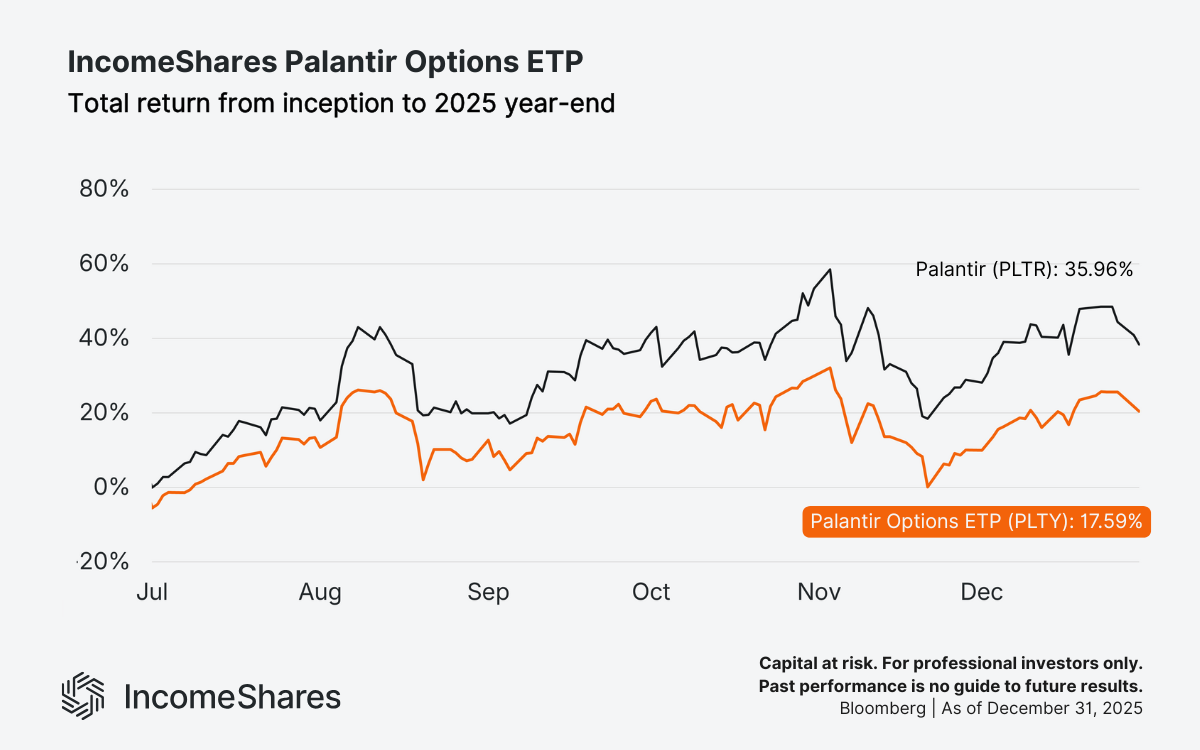
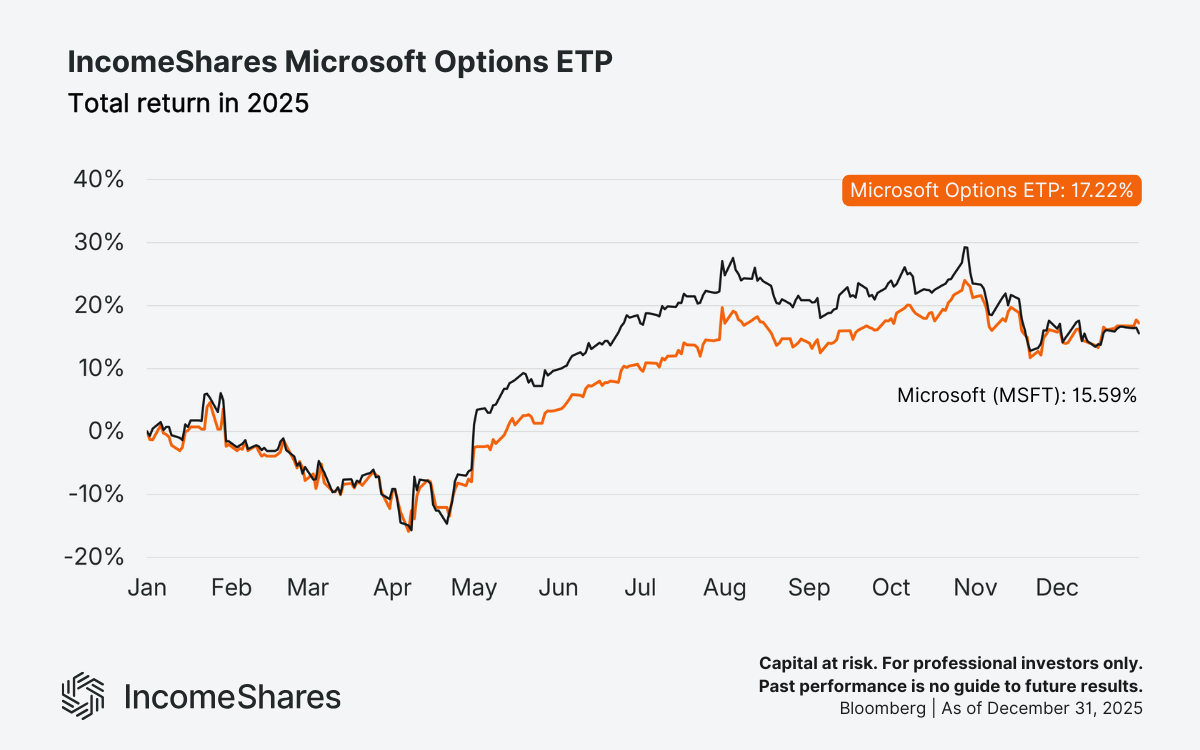
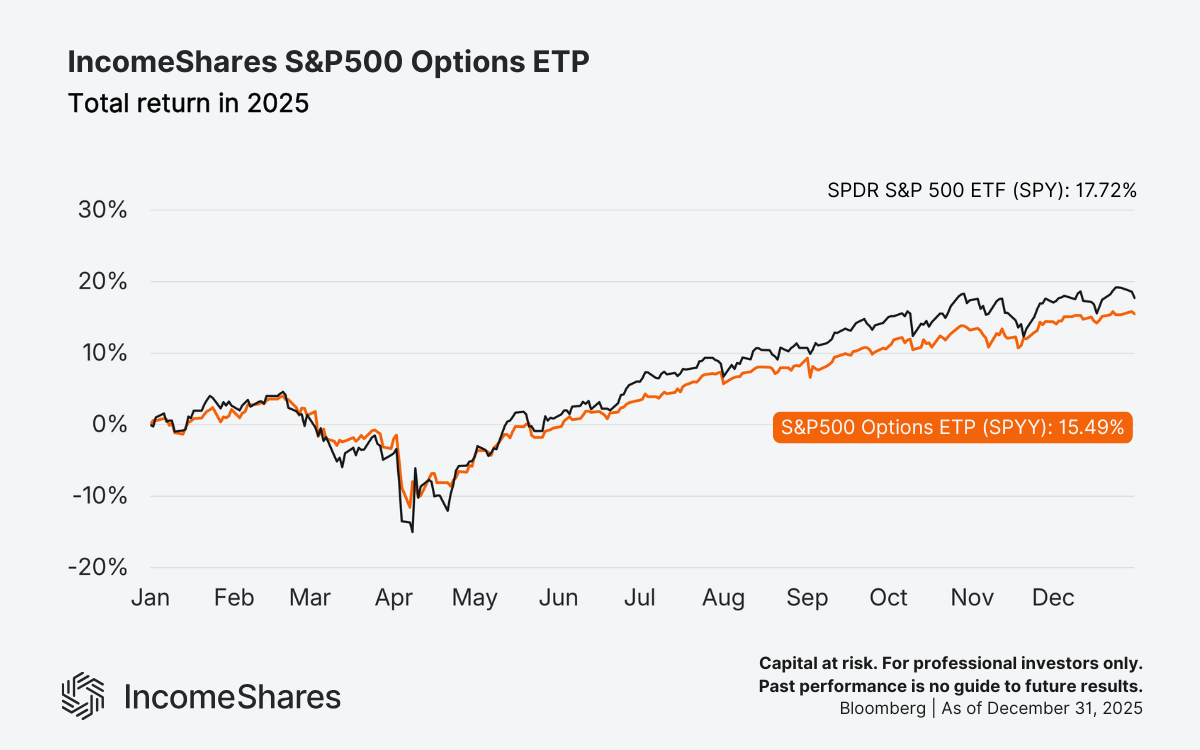
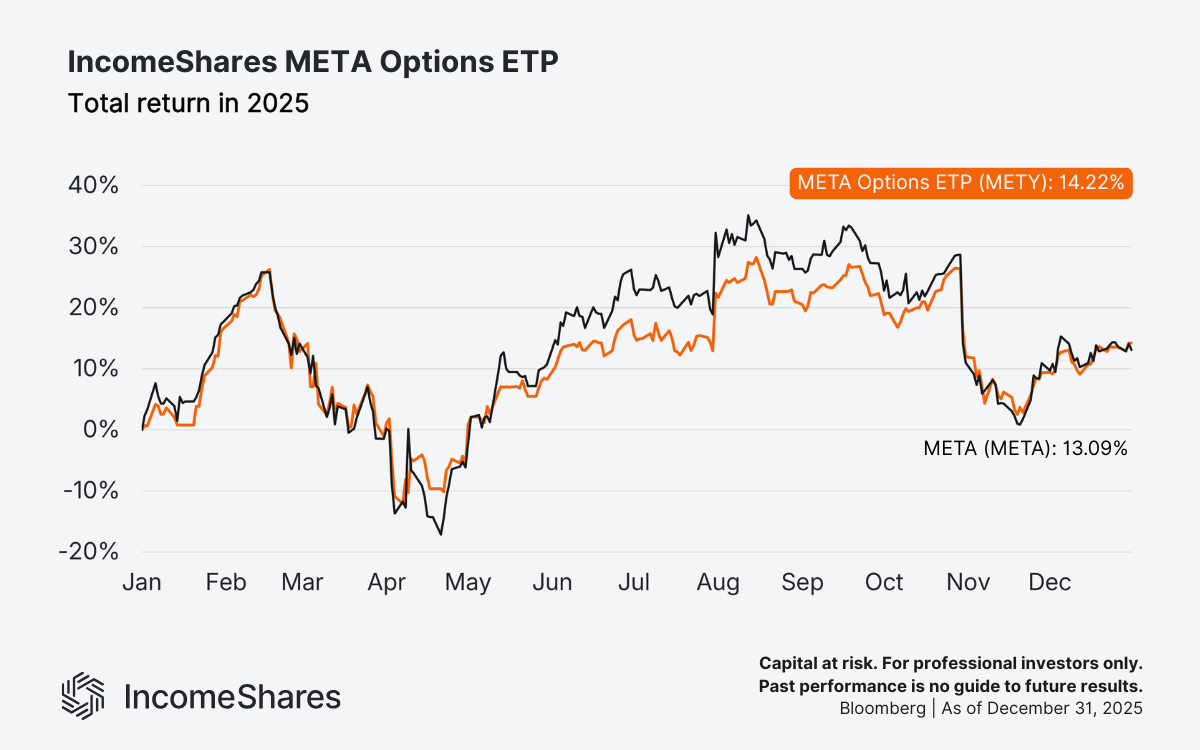
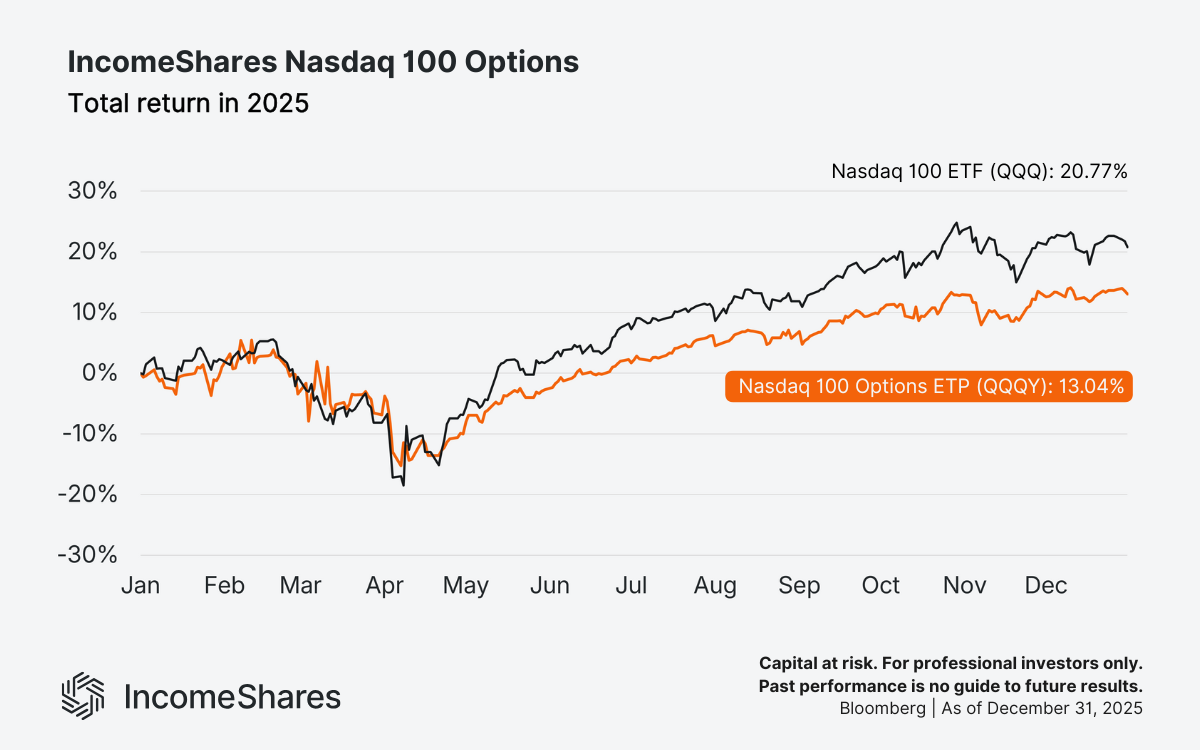
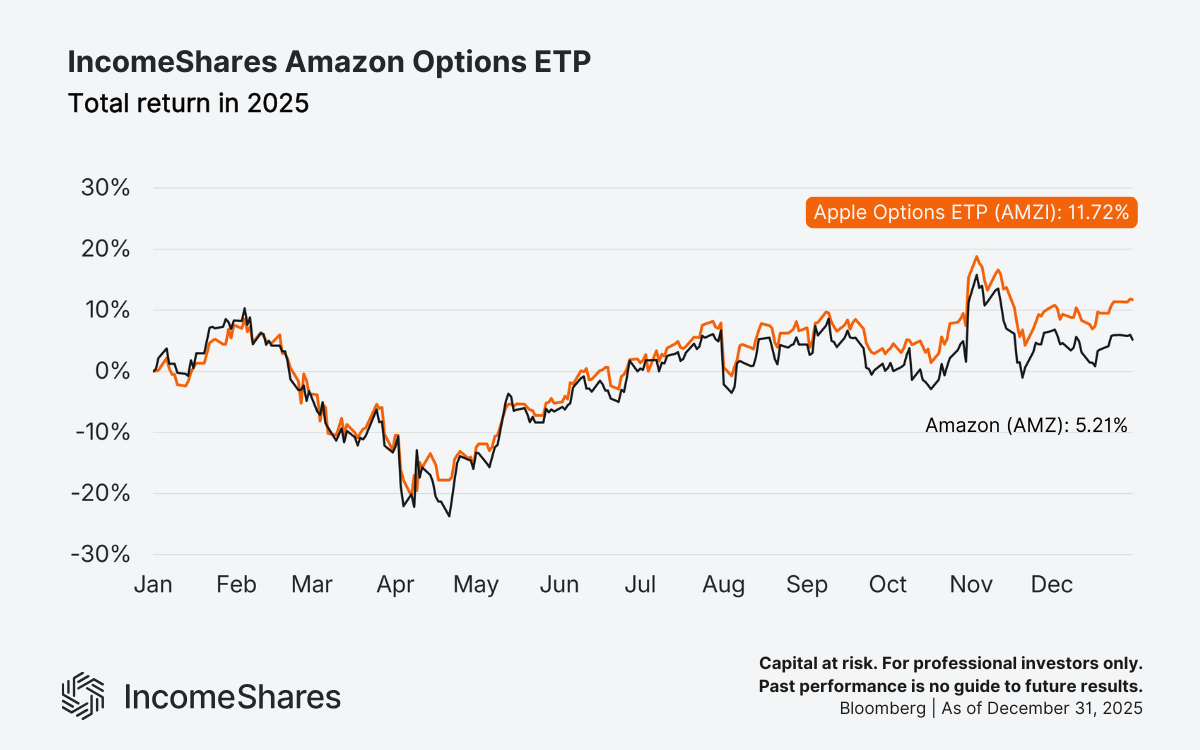
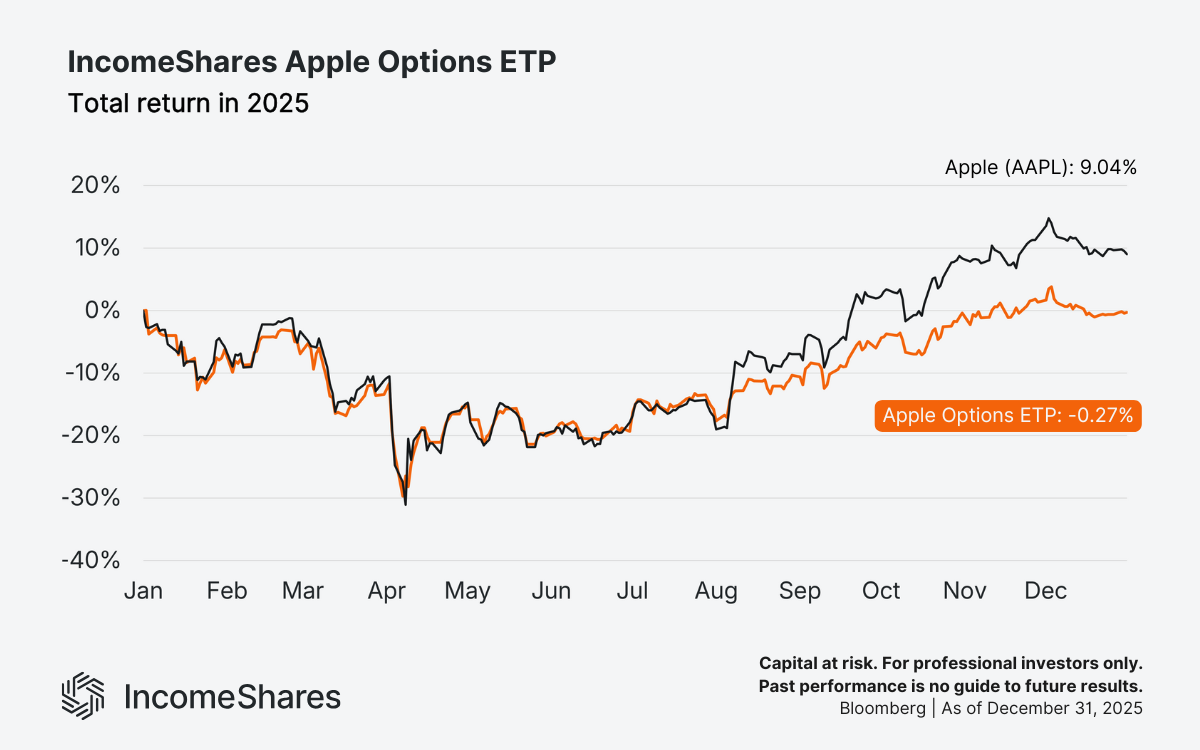
Across the 19 products, IncomeShares ETPs outperformed the underlying asset on total returns in seven cases. Keep in mind, these strategies aren’t designed to maximise upside in rising markets. Instead, they may trade upside participation in exchange for income and reduced downside risk.
And that seems to be the pattern when we compare risk-adjusted returns over the year. Twelve of the 19 IncomeShares ETPs had higher Sharpe ratios than their underlying assets. And they all had smaller drawdowns than the underlying.
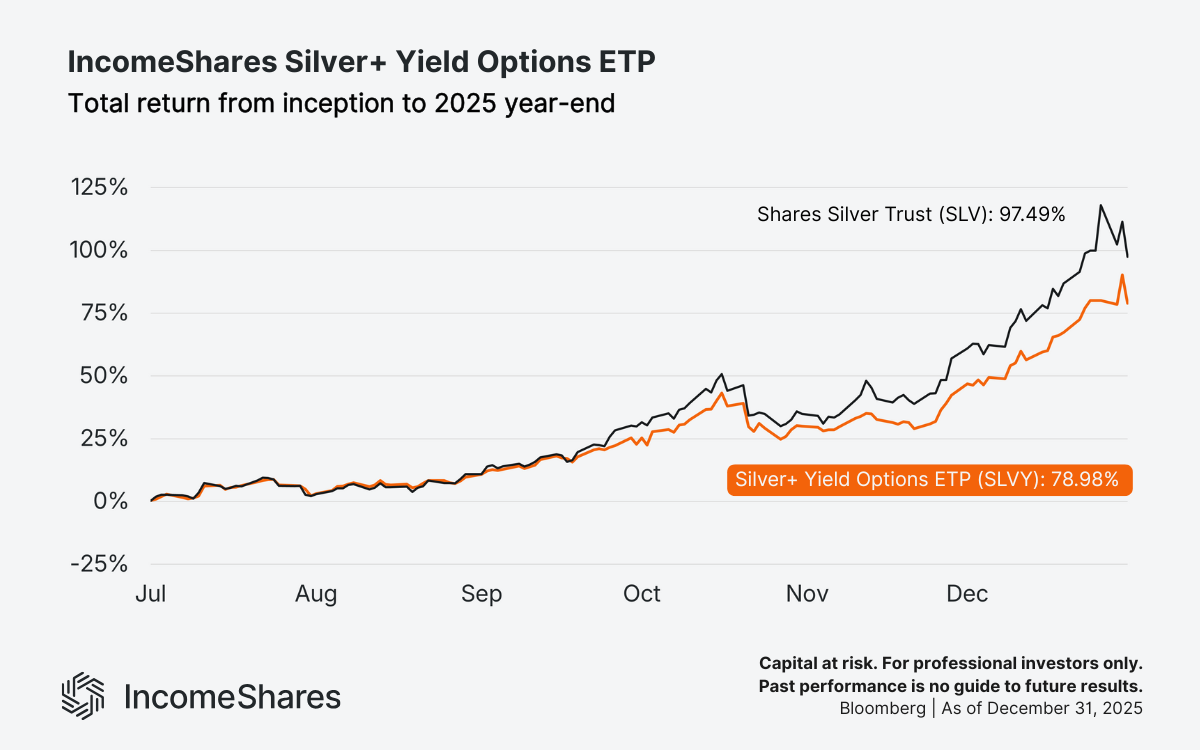
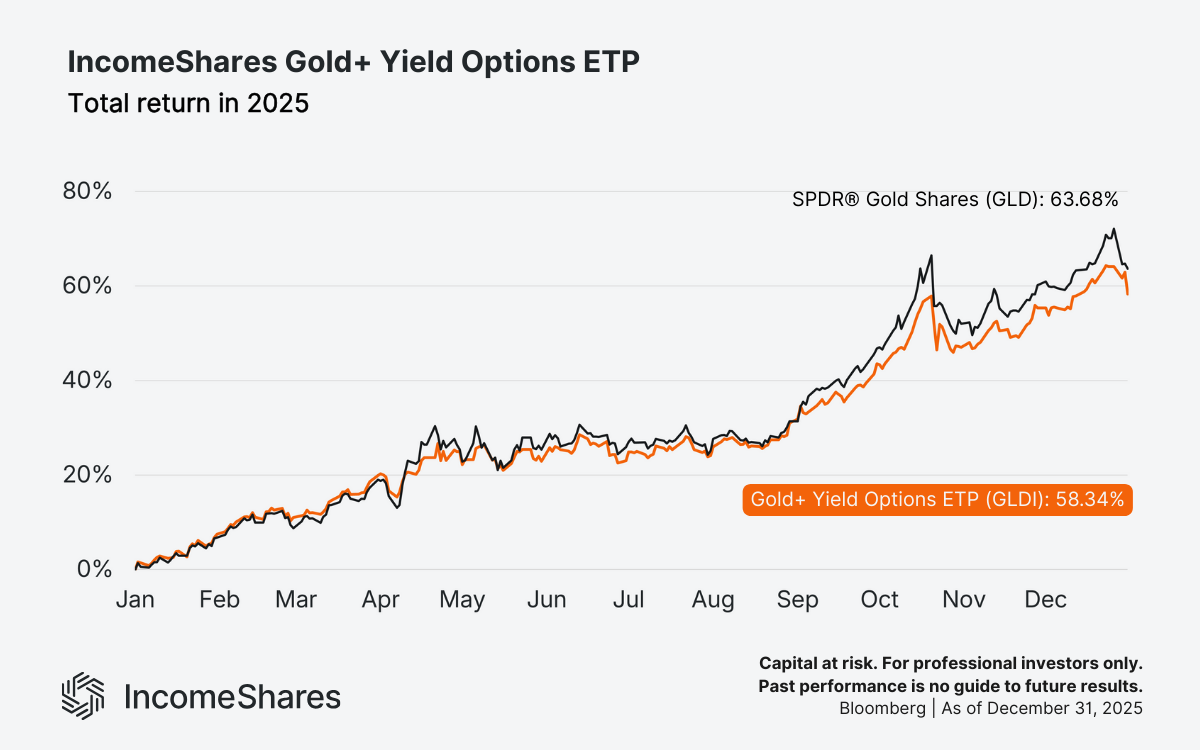
Total return charts for each IncomeShares ETP vs underlying asset

Your capital is at risk if you invest. You could lose all your investment. Please see the full risk warning here.
Related Products:

Strategy
Cash-Secured Put + Equity
Distribution Yield
49.92%

Strategy
Cash-Secured Put + Equity
Distribution Yield
39.57%

Strategy
Cash-Secured Put + Equity
Distribution Yield
38.37%

Strategy
Covered Call
Distribution Yield
12.10%

Strategy
Basket of Income-generating ETPs
Distribution Yield
36.59%

Strategy
Covered Call
Distribution Yield
12.30%

Strategy
Cash-Secured Put + Equity
Distribution Yield
87.96%

Strategy
Cash-Secured Put + Equity
Distribution Yield
68.56%