
Author
Jonathan Hobbs, CFA
Date
20 Mar 2026
Category
Education
IncomeShares 60/30/10 Multi-Asset Balanced ETP Explained
Your capital is at risk if you invest. You could lose all your investment. Please see the full risk warning here.
The traditional 60/40 portfolio splits exposure between stocks and bonds. The IncomeShares 60/30/10 Multi-Asset Balanced ETP (MLTY) takes a similar idea – but with a basket of individual options income ETPs. It covers four asset classes: Nasdaq stocks (60%), Long-dated Treasury bonds (30%), gold (5%), and silver (5%).
Options strategies on each individual ETP aim to generate monthly income while investors keep exposure to the underlying assets. MLTY is set to start trading on the London Stock Exchange next week.
Here’s how the strategy works, with backtested performance results.
How the 60/30/10 Multi-Asset Balanced ETP works
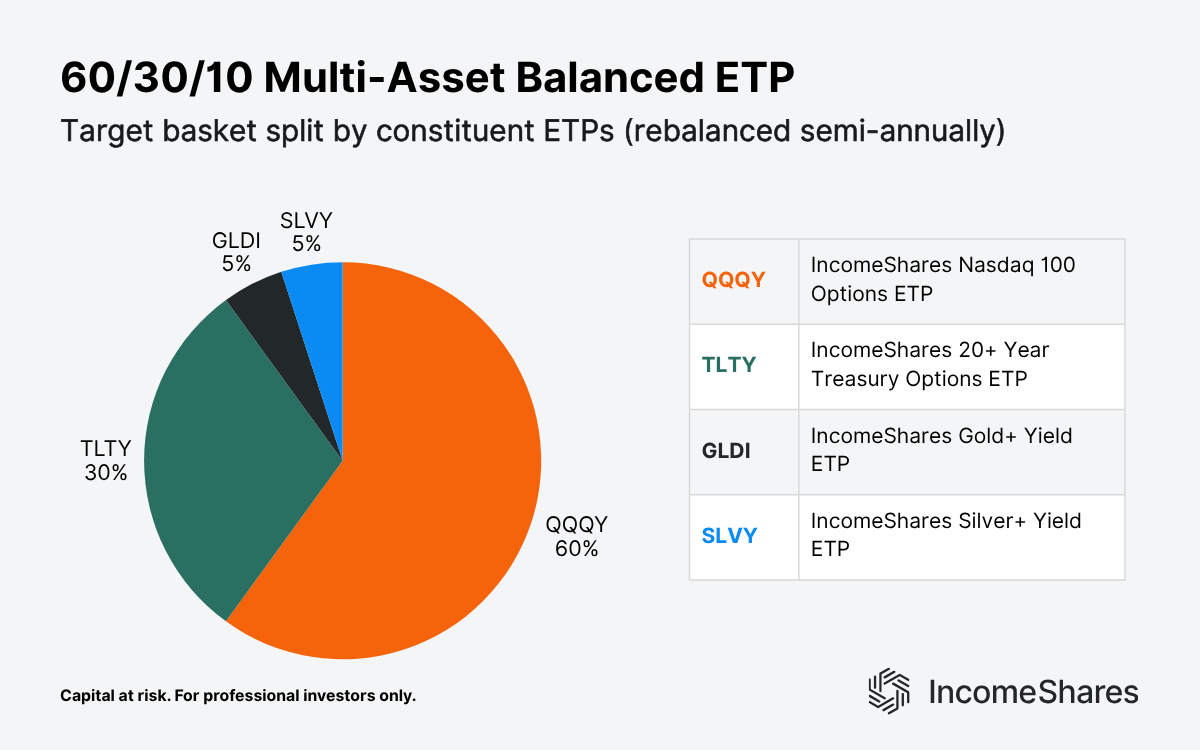
The IncomeShares 60/30/10 Multi-Asset Balanced ETP is one of our basket ETP products. Each constituent ETP covers a different asset class and sells options on that exposure, aiming to generate monthly income.
60% QQQY – IncomeShares Nasdaq 100 Options ETP. It holds roughly 25% in the Invesco QQQ Trust (QQQ), and sells put options on QQQ with the rest.
30% TLTY – IncomeShares 20+ Year Treasury Options ETP. It holds the iShares 20+ Year Treasury Bond ETF (TLT) and sells call options on that exposure.
5% GLDI – IncomeShares Gold+ Yield ETP. This uses the same covered call strategy as TLTY, but with SPDR® Gold Shares (GLD) as the underlying asset.
5% SLVY – IncomeShares Silver Yield ETP. Also a covered call strategy, but with the iShares Silver Trust (SLV)
QQQY sells puts with an equity sleeve, while TLTY, GLDI, and SLVY each use a covered call strategy. So the basket may offer diversification across both asset classes and income strategies.
The weights of each individual ETP can drift over time as the market moves. For example, if TLTY outperforms, it could take up more than the original 30%. To stop the percentages from drifting too far, we aim to rebalance it every six months back to its original split. In this simplified example, that would mean selling some TLTY shares to top up on the rest.
Backtested results vs the S&P 500
The chart and table below show a hypothetical backtest of the 60/30/10 allocation against the S&P 500 (SPY). This is not live performance data. It uses actual total returns from each of the four constituent ETPs, with income reinvested, and doesn't account for tax or transaction costs.
The allocation was rebalanced once – on 31 December 2025 – back to the original 60/30/10 split. This is roughly in line with the strategy's target rebalancing schedule. The period runs from 27 June 2025 to the end of February 2026. This is the furthest back the test could reasonably go, since two of the constituent ETPs – SLVY and TLTY – launched on that date.
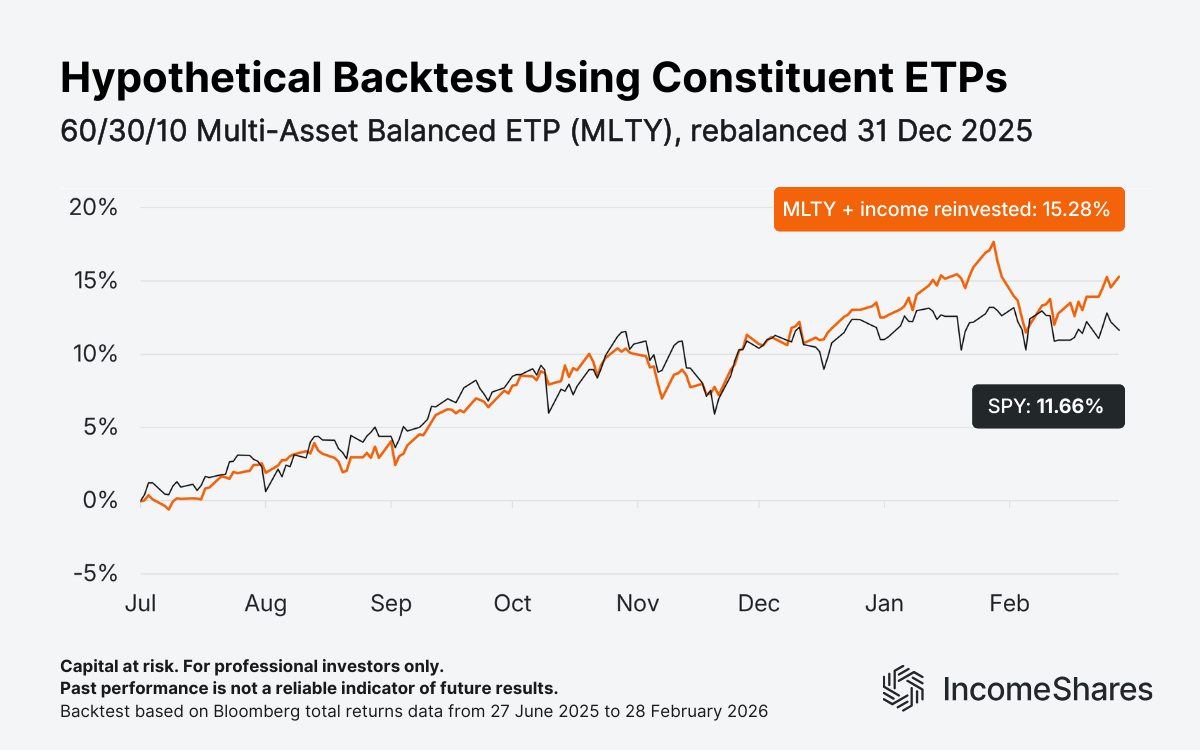
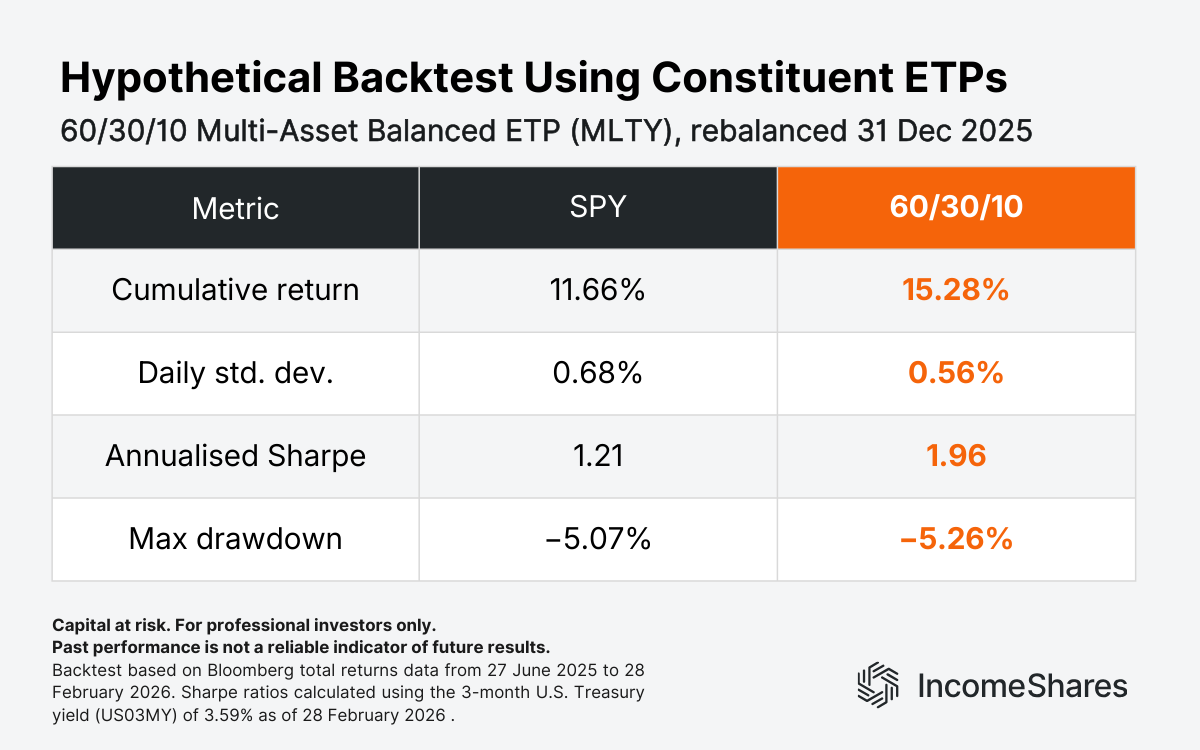
Over this period, the backtested 60/30/10 allocation generated a higher cumulative return than SPY, with lower daily volatility. Its Sharpe ratio – a measure of return per unit of risk – was higher at 1.96 vs 1.21. Its max drawdown – the largest peak-to-trough fall over the period – was minus 5.26%. That was slightly deeper than the minus 5.07% drawdown for SPY.
These figures are based on a short backtest period. They don't represent actual returns and don't guarantee future performance.
Three things to remember
The IncomeShares 60/30/10 Multi-Asset Balanced ETP (MLTY) combines four options income ETPs across Nasdaq stocks, long-dated Treasuries, gold and silver. Options strategies on each one aim to generate monthly income while investors keep exposure to the underlying assets.
The allocation targets a 60/30/10 split and aims to rebalance every six months. It may offer diversification across both asset classes and income strategies.
The backtested data covers a short period and doesn't represent actual returns. Past performance is not a reliable indicator of future results.
Your capital is at risk if you invest. You could lose all your investment. Please see the full risk warning here.
Related Products:

Strategy
Cash-Secured Put + Equity
Distribution Yield
60.68%

Strategy
Covered Call
Distribution Yield
12.27%

Strategy
Covered Call
Distribution Yield
12.19%

Strategy
Covered Call
Distribution Yield
12.36%