

Author
Jonathan Hobbs, CFA
Date
11 Aug 2026
Category
Education
IncomeShares Gold+ Yield Performance: Bull vs Bear Market
Your capital is at risk if you invest. You could lose all your investment. Please see the full risk warning here.
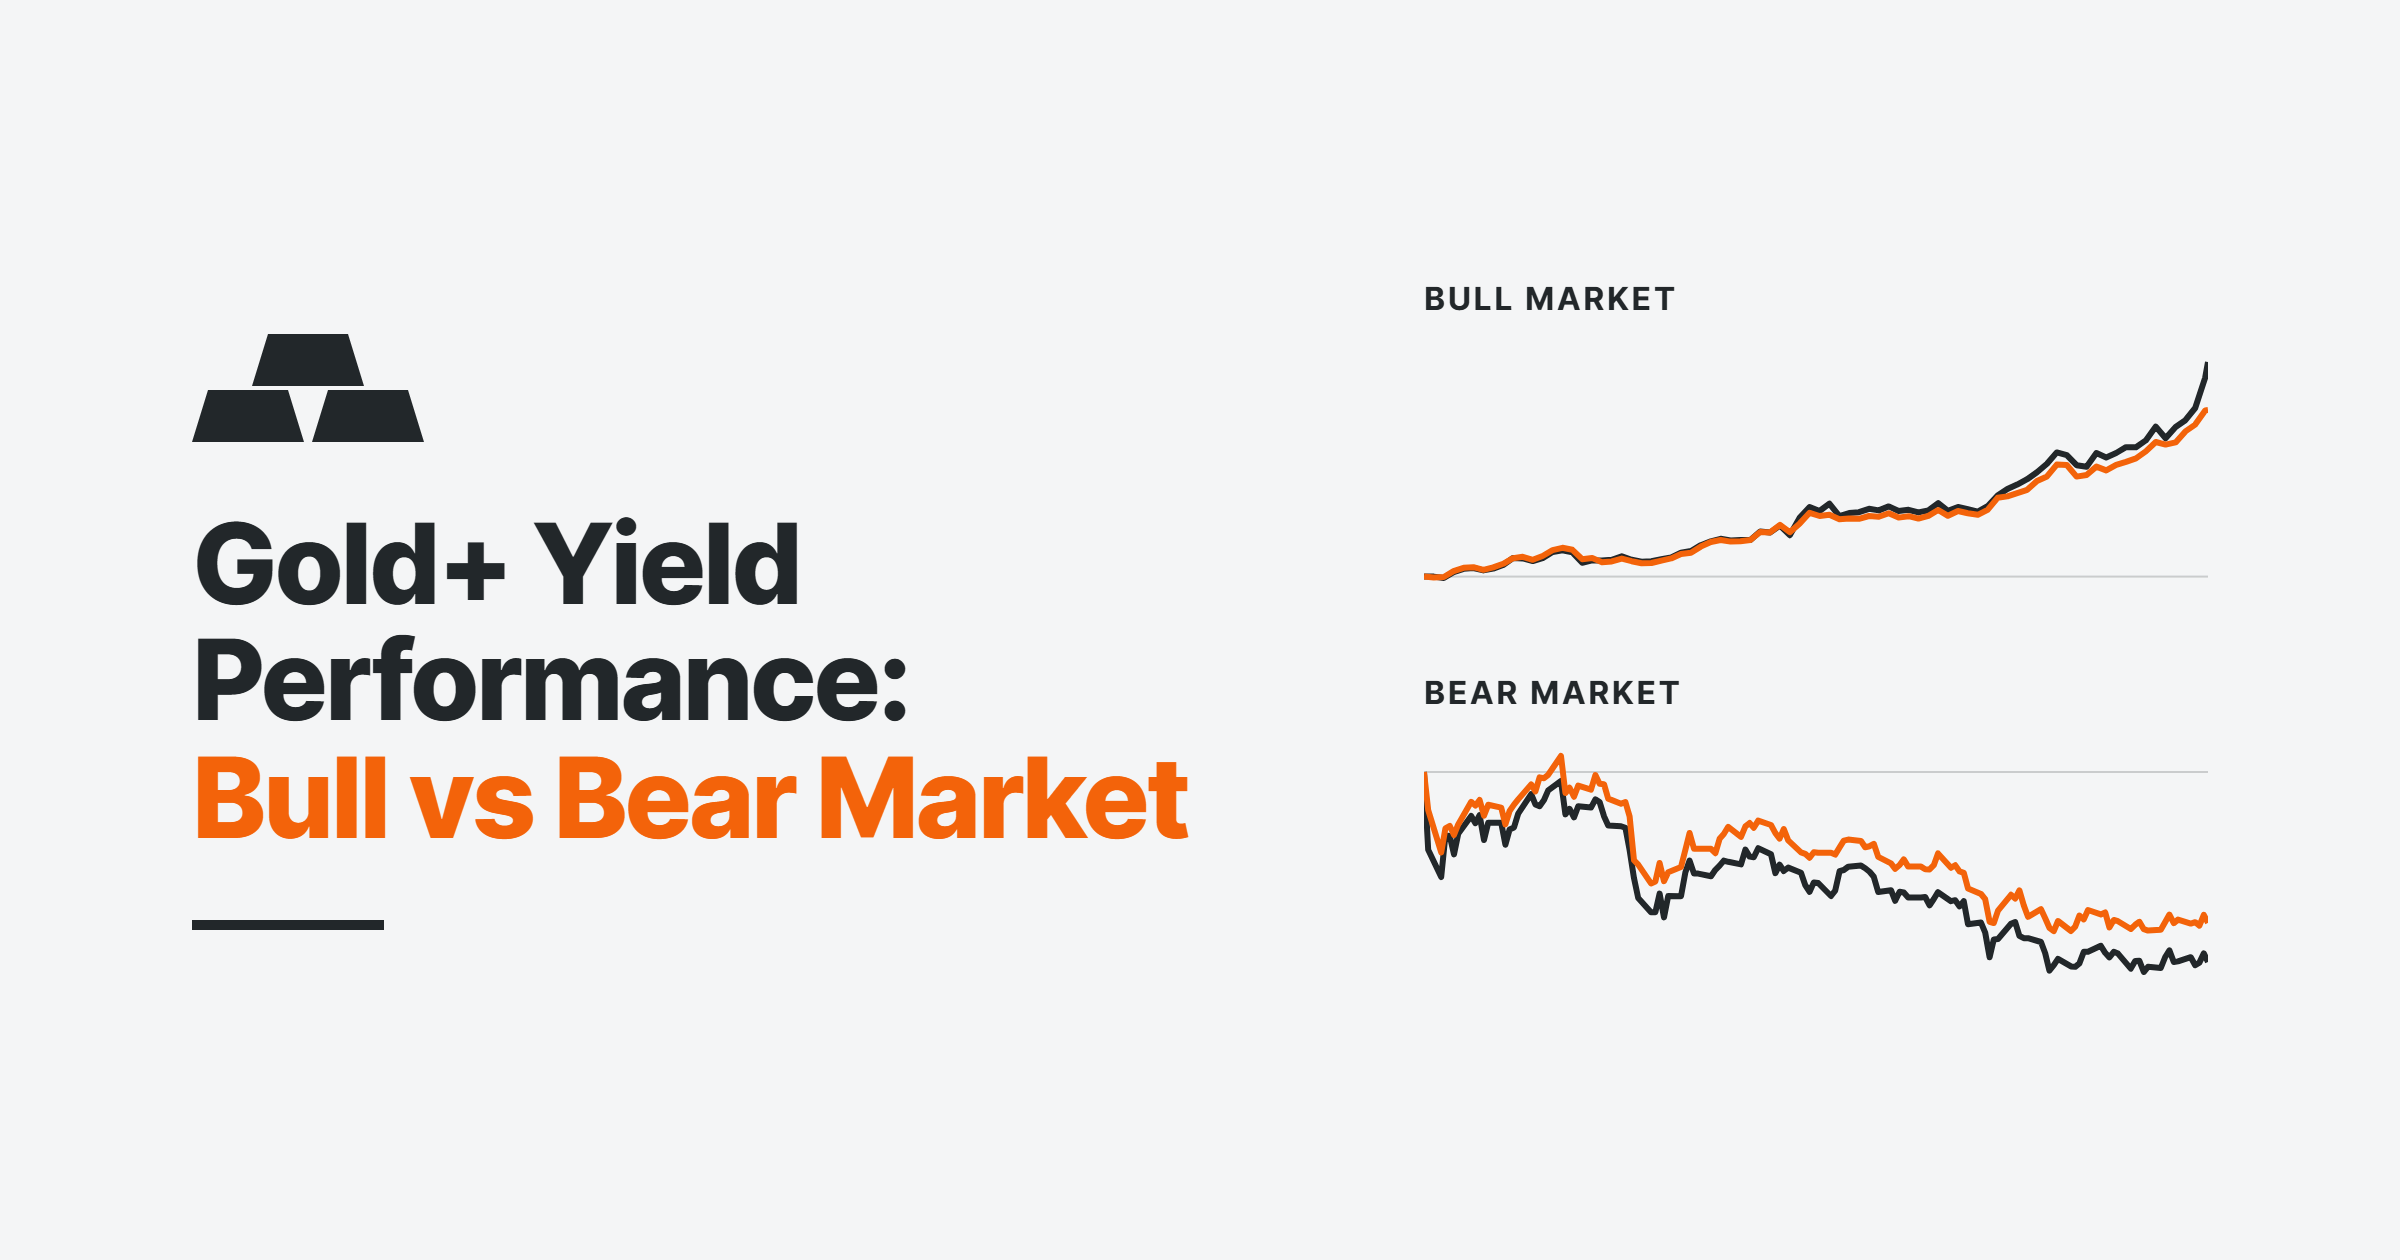
Gold had a parabolic run until it peaked on 29 January this year – then it went into a bear market. Our IncomeShares Gold+ Yield ETP (GLDI) traded through both market environments with the same covered call strategy. This article explains how it performed in the bull market, the bear market, and since launching in July 2024.
How the GLDI covered call strategy works
GLDI holds gold exposure through SPDR® Gold Shares (GLD), so its value moves with the gold price. Each week, we sell call options on that exposure and collect an upfront fee, called a premium. We pool those premiums and aim to pay them to investors as monthly income distributions. We aim to size that distribution at around 1% of the ETP's NAV each month. Any extra premium income stays in the ETP. That can help protect the NAV at times, so investors may earn income from a larger base.
Keep in mind, the income can still have a cost. If gold moves above the call option strike price, we're obligated to sell GLD shares at that strike price. That can cap the strategy's upside in strong rallies. If gold drops instead, the options can expire worthless. In that case, we don't need to sell any shares, and the ETP still keeps the premium income.
GLDI performance in gold's bull market
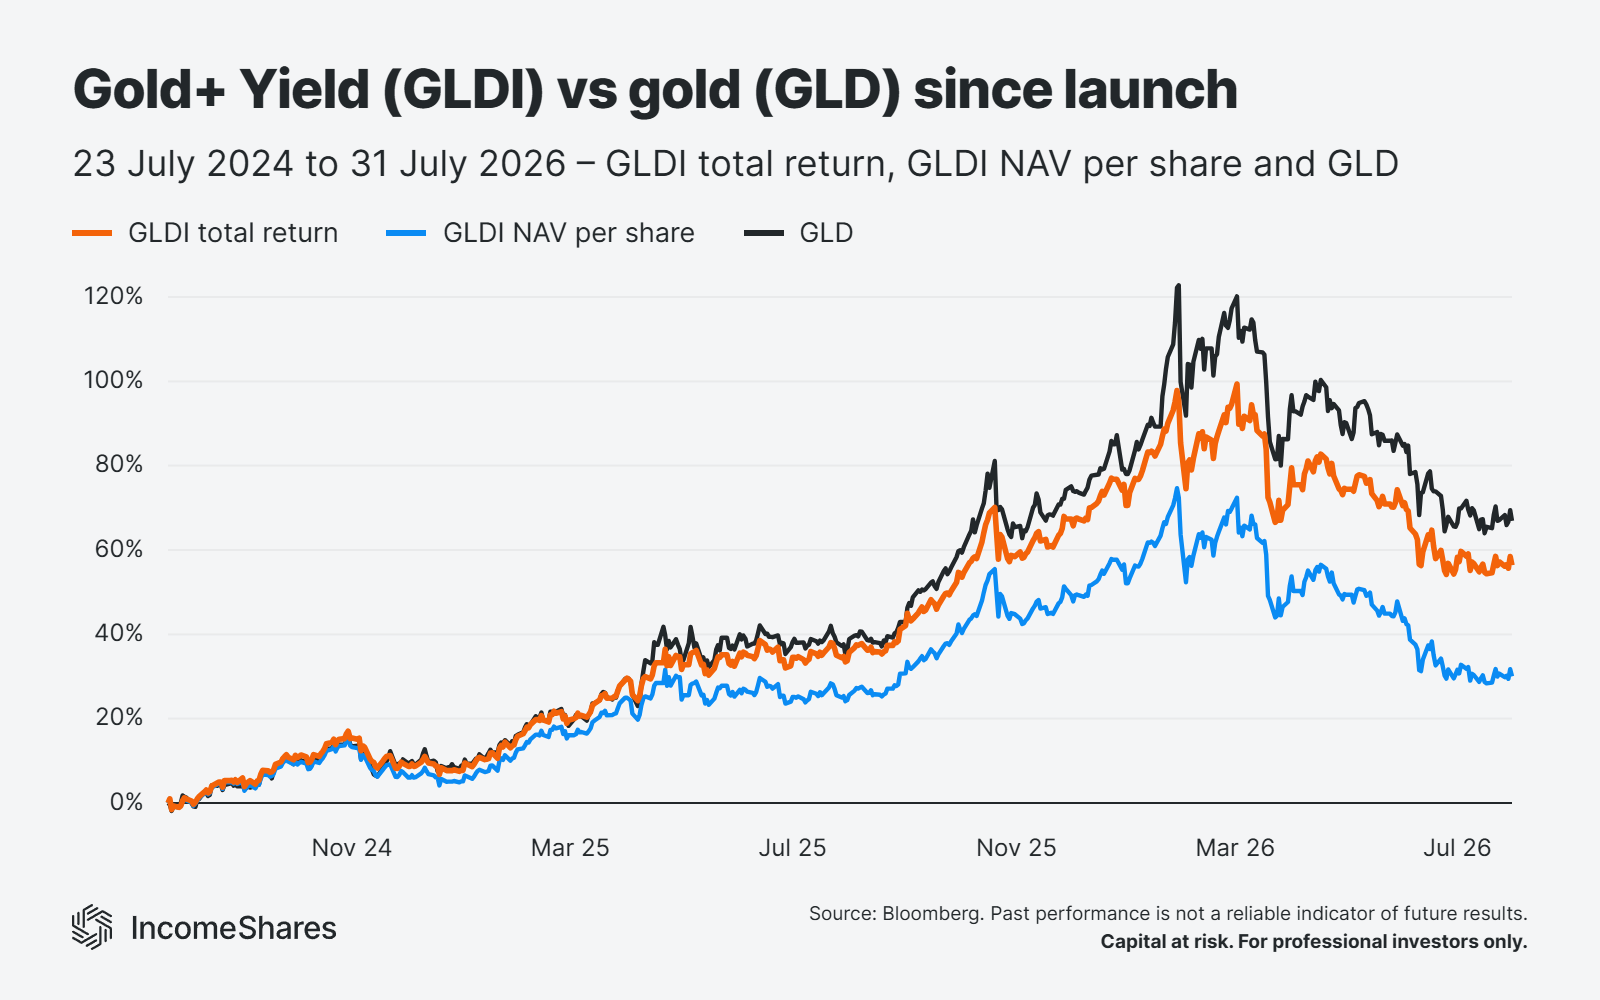
We officially launched GLDI on the London Stock Exchange on 23 July 2024. It trades in US dollars (just like the underlying GLD shares), but we also have pound and euro versions with different tickers. All performance data comes from Bloomberg.
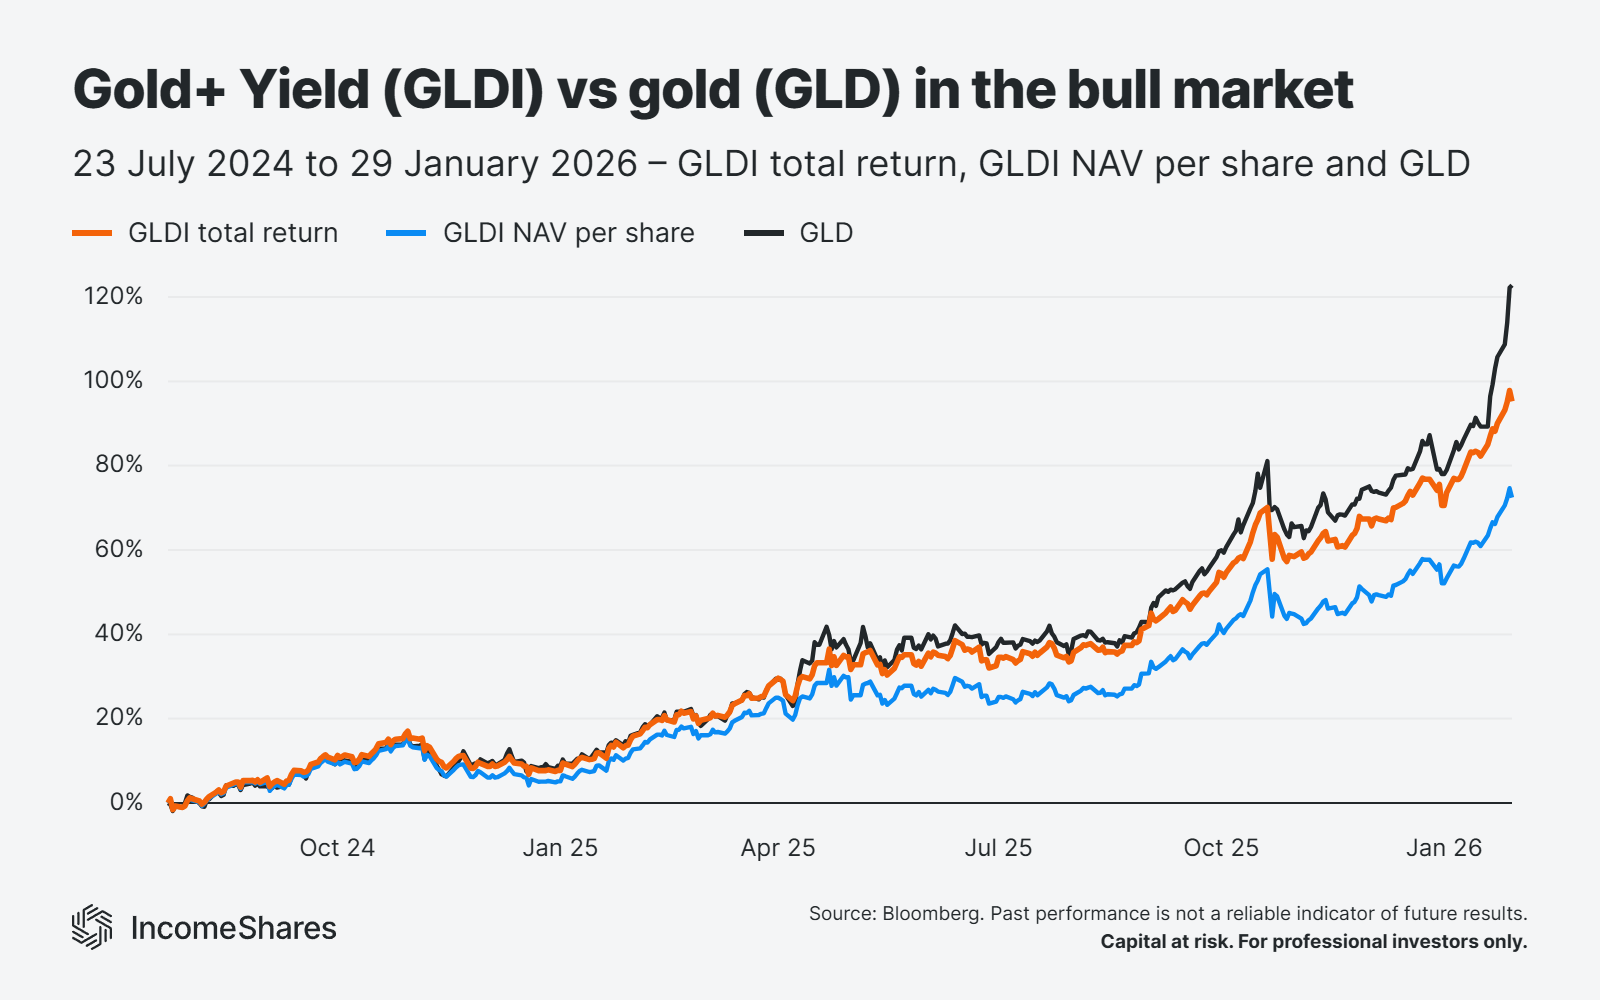
Gold then rose for the next 18 months, and GLD peaked at $495.90 on 29 January 2026. It gained 122.8% over that stretch. The fund holds physical gold and pays no income, so its price return is also its total return.
GLDI's total return was 95.3% over the same period. Total return counts the share price change plus the income distributions paid, with that income reinvested. Without counting income, GLDI's net asset value (NAV) per share rose 72.4%. In other words, GLDI took part of that rise as price gains and paid income as it went. Selling call options capped some of the upside.
The table below adds the risk stats. Here, the Sharpe ratio measures return per unit of risk (volatility), and maximum drawdown is the worst peak-to-trough loss.
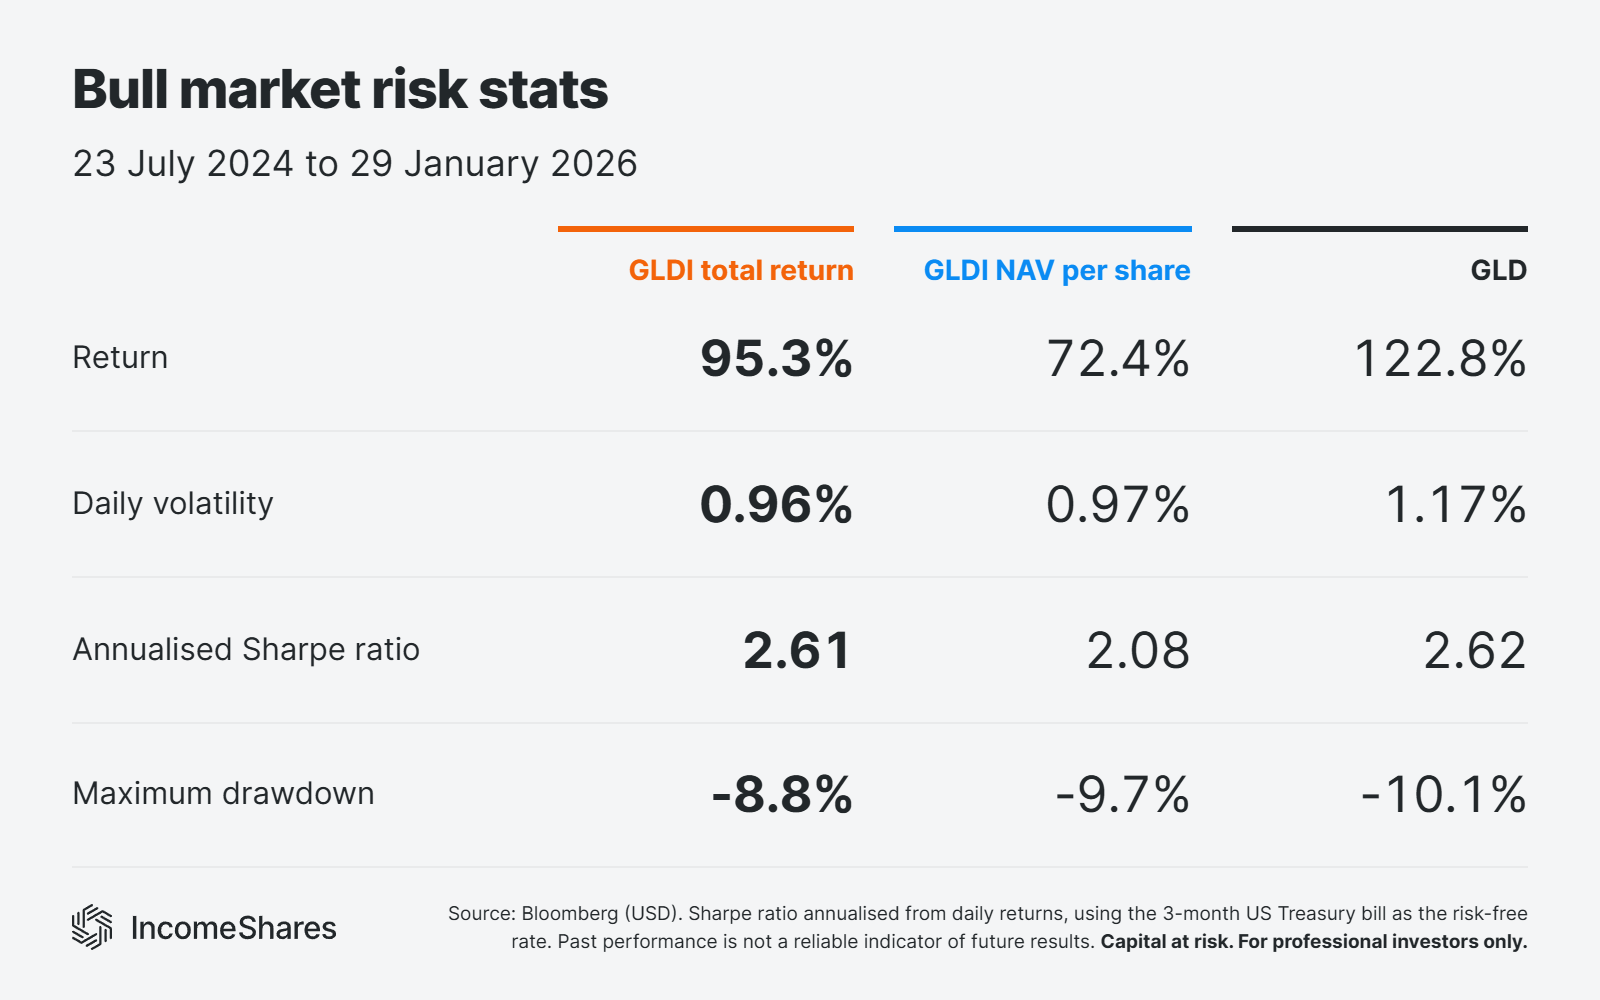
GLDI's total return and GLD scored nearly identical Sharpe ratios in the rally. But GLDI's volatility and maximum drawdown were both smaller. As for the NAV per share line, it lagged on risk-adjusted returns – which makes sense in a strong rally. Selling calls capped part of that rally, and the income GLDI paid out each month left the NAV as well.
GLDI performance in gold's bear market
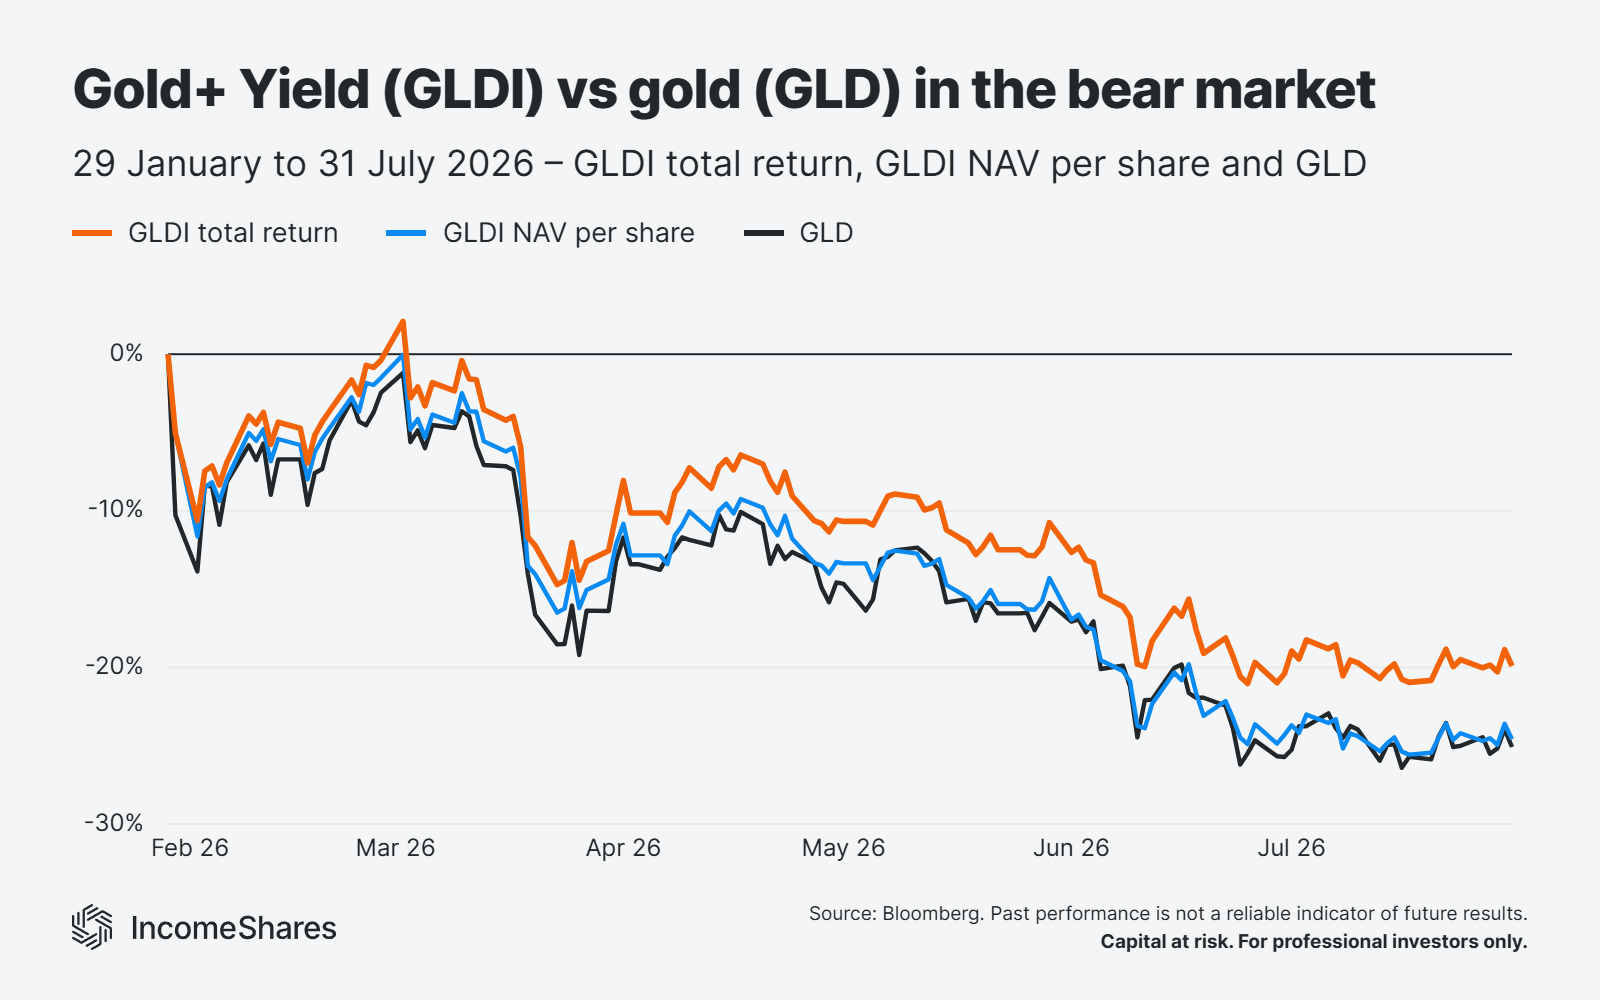
GLD lost 25.1% between the peak and 31 July. Meanwhile, GLDI's total return was -19.9% since the weekly premium income cushioned part of the fall.
Keep in mind, GLDI isn't a hedge against falling gold prices – it holds gold exposure, so it fell too. The premium income can only cushion part of a decline like this one.
GLDI's NAV per share fell 24.6% (less than GLD) before counting any income. Investors often worry that some covered call strategies can erode an ETP's NAV over time. So far, this downtrend shows the opposite: GLDI's NAV fell less than gold, and we still paid income every month.
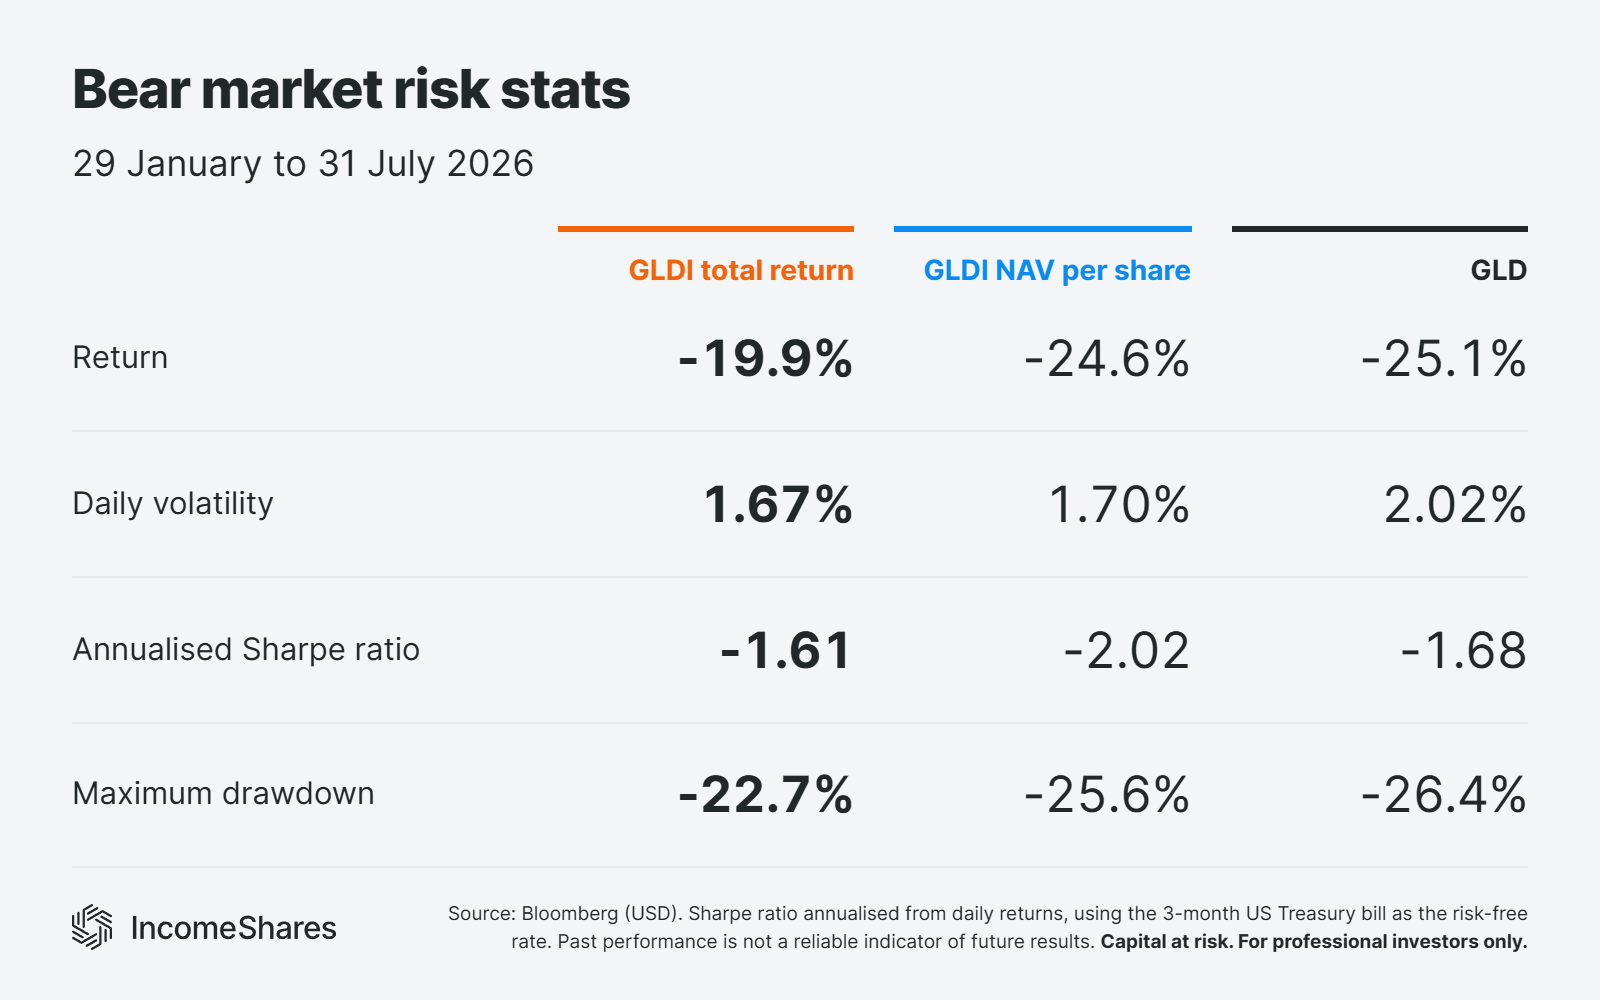
Sharpe ratios can turn negative when returns fall, so volatility and drawdown tell the clearer story here. GLDI scored better than GLD on both measures.
Gold+ Yield performance over the full two years
Across the full period, GLD gained 66.9% while GLDI's total return was 56.4%. GLDI's return came in a different form, though. Its NAV per share rose 30%, and the rest came as monthly income paid to investors.
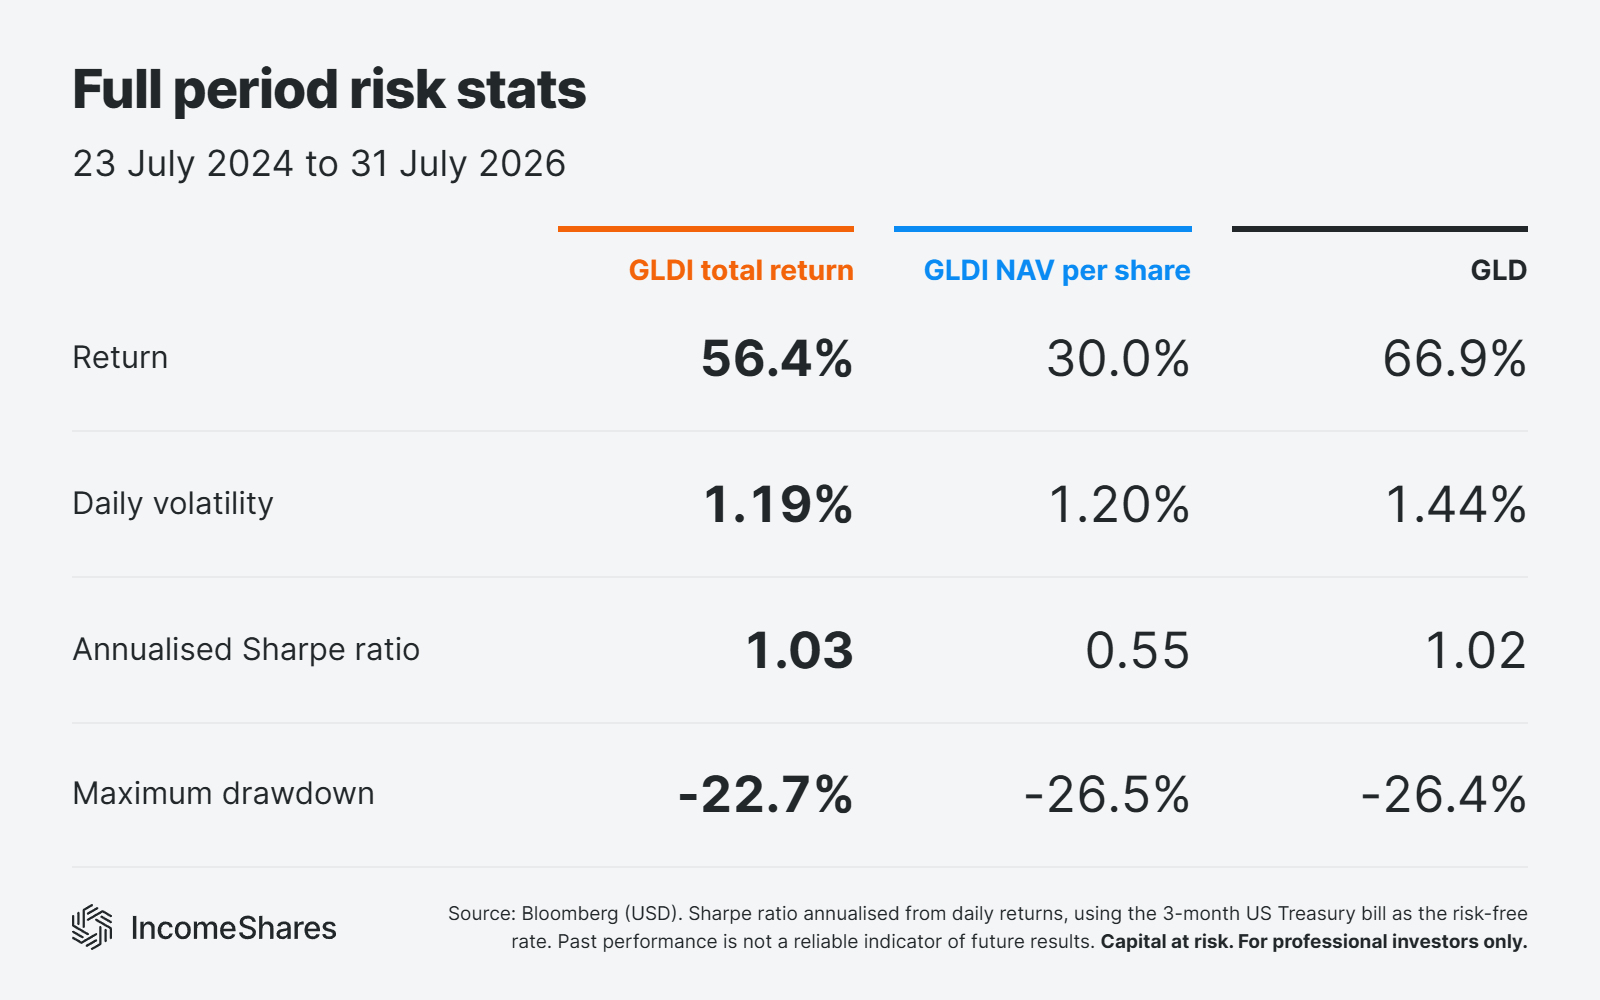
Risk-adjusted returns came out nearly identical, with a 1.03 annualised Sharpe ratio for GLDI vs 1.02 for GLD. GLDI's total return got there with less volatility, a smaller worst-case loss, and monthly income along the way.
Key highlights
In gold's bull market, GLD gained more than GLDI – selling call options capped some of the upside.
In the bear market, GLDI fell less than gold, as premium income cushioned part of the drop.
GLDI's NAV per share also fell less than gold in the bear market, before counting any income distributions.
Your capital is at risk if you invest. You could lose all your investment. Please see the full risk warning here.
Related Products:

Strategy
Covered Call
Distribution Yield
12.97%

Strategy
Cash-Secured Put + Equity
Distribution Yield
105.36%