
Author
Jonathan Hobbs, CFA
Date
28 Mar 2025
Category
Market Insights
Gold vs. Nasdaq 100: A 25-Year Look at Market Cycles
Your capital is at risk if you invest. You could lose all your investment. Please see the full risk warning here.
Over the past quarter century, investors have seen major shifts in global markets. From tech booms and financial crises to inflation spikes and geopolitical uncertainty, it’s been a turbulent ride. Most investors would expect the Nasdaq 100 – home to tech giants like Apple, Amazon, and Microsoft – to have delivered the strongest long-term returns. But the reality is more nuanced.
This article explores the monthly performance of gold versus the Nasdaq 100 from January 2000 to March 2025. The results may surprise you.
2000–2002: Dotcom crash (gold outperforms the Nasdaq)
The dotcom bubble peaked in early 2000. Tech stocks tumbled, and the Nasdaq lost nearly 80% of its value from peak to trough. Gold, meanwhile, began a multi-year rally. Investors sought safety in hard assets as stock markets corrected.
2003–2011: Gold gathers momentum
Gold had a strong run throughout the 2000s. A weaker US dollar, rising inflation concerns, and growing central bank gold demand supported the precious metal. After the 2008 global financial crisis, those trends accelerated. While the Nasdaq recovered post-2003, the 2008 crisis dealt another blow to stocks. Gold proved more resilient.
2012–2015: The Nasdaq bounces back
Gold hit a peak in 2011, then entered a multi-year bear market. At the same time, the Nasdaq found a second wind. Low interest rates and innovation (in mobile, software, and cloud computing) fueled investor enthusiasm. Growth stocks led the way.
2016–2024: Gold and the Nasdaq both rally
Both gold and the Nasdaq trended higher over the past decade. Gold was supported by rising geopolitical tensions, inflation concerns, and record central bank buying. Meanwhile, the Nasdaq’s rally picked up steam with breakthroughs in cloud technology, artificial intelligence, and big data. The Magnificent Seven stocks led the tech rally, especially Nvidia with its consistent earnings growth.
That said, there was volatility along the way. Gold and the Nasdaq both had significant drops during the March 2020 Covid crash and in the 2022 bear market.
Final results (as of 26 March, 2025):
The chart below compares the performance of gold with the Nasdaq since the turn of the century. As of 26 March, 2025, gold (blue) has gained roughly +956%, while the Nasdaq (orange) is up roughly +465%.
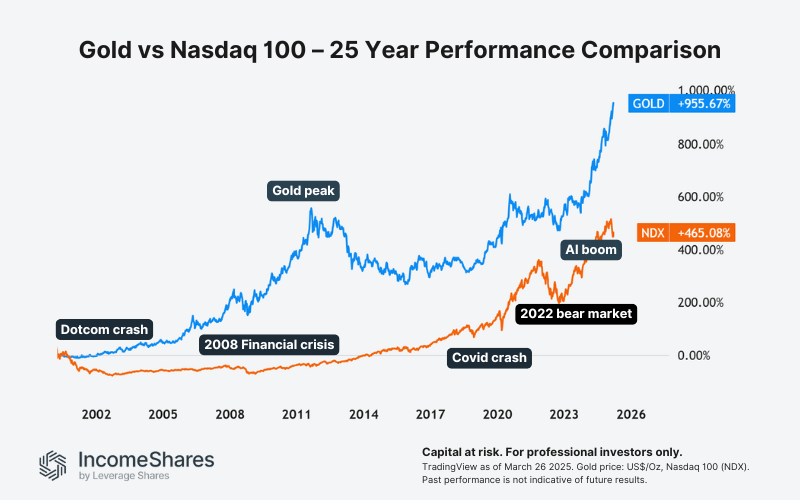
This performance gap may highlight the value of diversification. While stocks may deliver long-term growth, gold has outperformed over this specific period – especially during times of crisis and uncertainty.
IncomeShares offers the Gold+ Yield Options ETP (GLDI) and the Nasdaq-100 Options ETP (QQQI). These two exchange-traded products seek to generate monthly income using options strategies on gold and the Nasdaq 100, respectively.
Key takeaways
Gold has outperformed the Nasdaq 100 over the past 25 years, driven by macro uncertainty and crisis periods.
Tech stocks have delivered strong growth, but performance has been more cyclical.
Diversification across asset classes like gold and equities may help balance risk and return.
Your capital is at risk if you invest. You could lose all your investment. Please see the full risk warning here.
Related Products:

Strategy
Cash-Secured Put + Equity
Distribution Yield
74.56%

Strategy
Covered Call
Distribution Yield
12.16%